
Description
To get started with the use of Auditmetrics AI and a copy of the included book, contact us at [email protected].
Review the AI assistance feature with the first exhibit’s 60 second trailer. A more complete demo linking can be obtained by selecting:
https://auditmetrics.com/app_data/trailer2.mp4
For help getting started with book/software combination: [email protected]
Auditmetrics AI software is specifically designed for small business to compete in an evolving technology driven business environment that favors analytics. Our economy is on a high-tech commercial revolution where huge business entities marshal vast sophisticated programming to correct past deficiencies and search for potential opportunities. Auditmetrics helps the smaller enterprise survive by providing a level analytical playing field. In the United States, the Small Business Administration establishes small business size standards on an industry-by-industry basis but generally specifies a small business as having fewer than 500 employees for manufacturing businesses and less than $7.5 million in annual receipts for most non-manufacturing businesses. That creates a large range for analytic activity. Auditmetrics AI Professional version can handle accounts involving millions of records.
Included with this Auditmetric V6.5 Professional is a print softcover version “Forecasting Revenue and Expenses, Using Statistical Analytics” by Eleanor Winslow. This book/software combination is designed as a complete resource for business analytics and technology.
Auditmetrics V6.5 sets the stage for sampling accounts to:
-
Conduct statistical audits assuring account data integrity.
-
Convert the statistical datasets for forecasting revenue and expense.
Ensuring data integrity is a complex activity that requires coordination from different aspects of an organization. Auditmetrics AI integrates the interplay between: -
People – proper training regarding collection, input, handling, understanding, interpretation, and reporting of results
-
Processes – ensuring input, processing, and output maintain data’s reliability, consistency, availability, and accuracy.
-
Technology – Software with AI techniques to maintain the integrity between data and analytics to turn account data into useful information for forecasting and market research
The use of statistical analytics in forecasting cashflow can involve complex procedures that may be beyond the experience of many small business managers. With the software’s use of AI assistance, the manager needs only to decide on a few key targeted statistical inputs and the software and book guide the user from initial plan to completed project.
Auditmetrics has recently expanded data input potential by adding an ability to input data from standard reports that many accounting management systems such as QuickBooks offer. It then can provide a complete analytical framework from auditing cashflow to forecasting revenue and expenses.
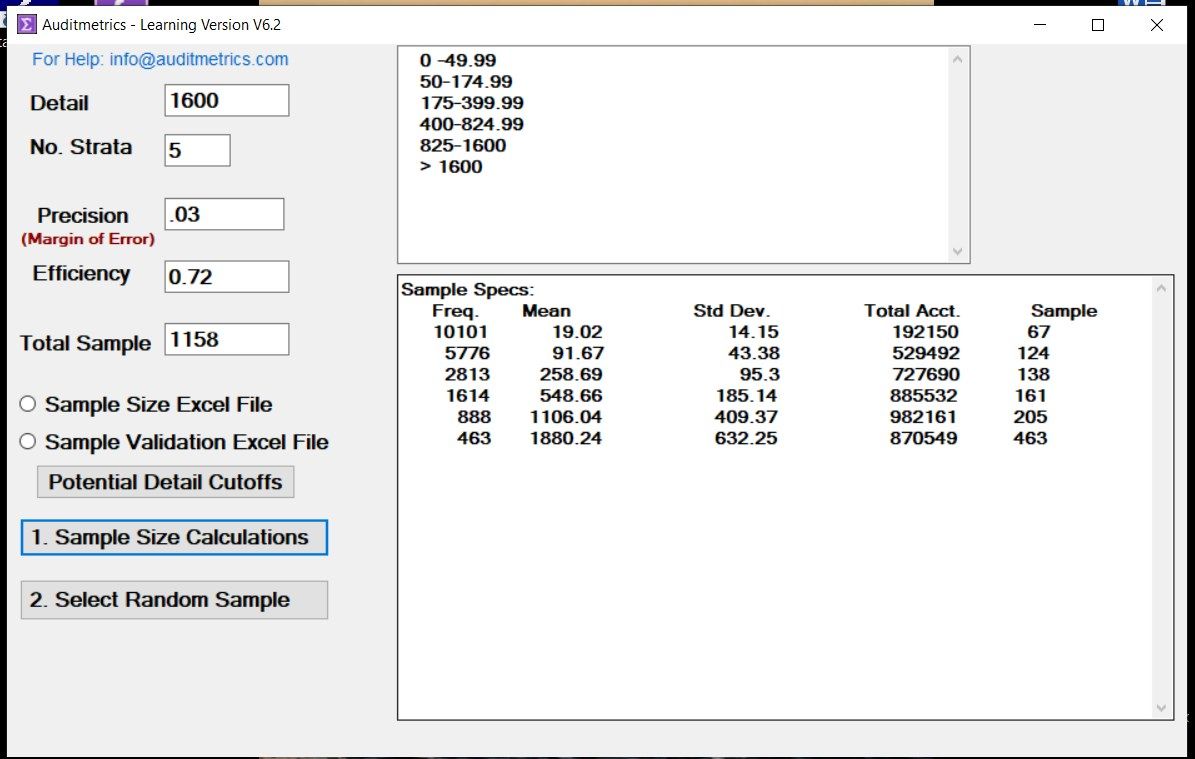
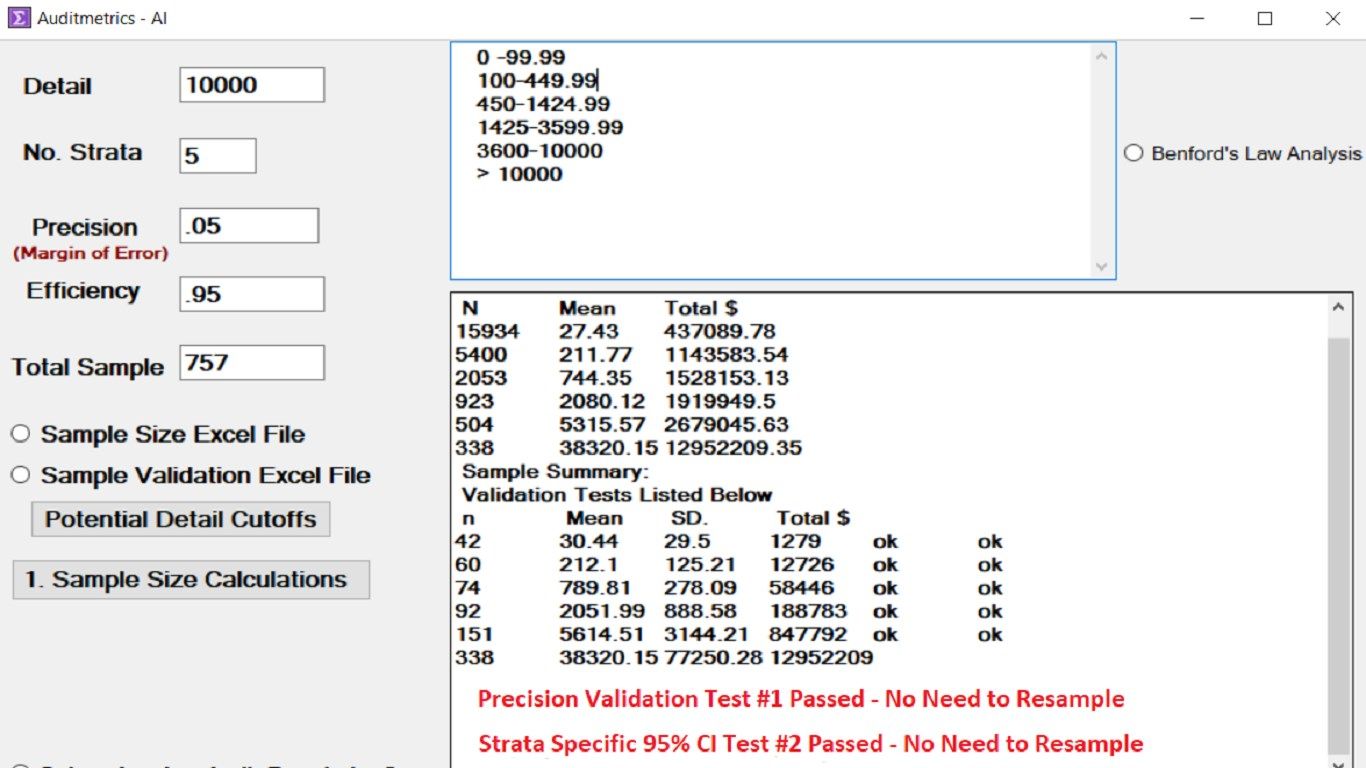
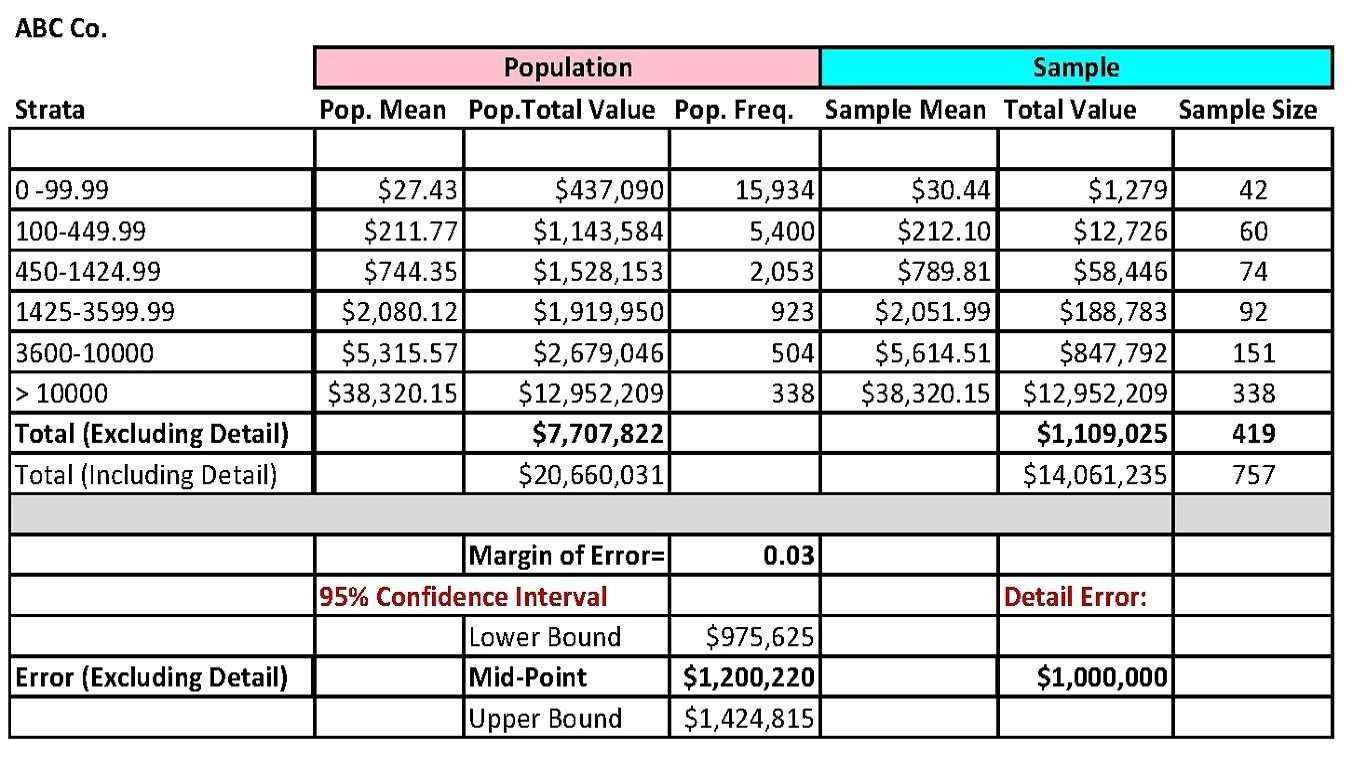
All of this is done in a user-friendly environment such that one can traverse the complexity of the statistical audit by using a simple three step process. Each step has a series of computer guided analytic checkpoints. An auditor can let the software establish sample specifications but there is ample opportunity for the auditor to fine tune the final design. Once a design is accepted, a random sample of the account is generated. The AI system also generates Excel templates that can be used to document and record audit results.
DOCUMENT TO HELP GET STARTED WITH AUDITMETRICS V6.5:
https://auditmetrics.com/App_Data/GettingStarted.pdf
The included book provides support documentation for the business manager when following the process from original statistical sample selection to developing datasets for forecasting using such powerful statistical tools as regression and correlation. There is no need for any additional statistical software. All analytic techniques are available with MS Excel’s Analysis ToolPak, an add-in program that provides data analysis tools for financial and statistical data analysis. It is a feature MS Office Professional
“FORECASTING REVENUE AND EXPENSES, USING STATISTICAL ANALYTICS”:
By Eleanor Winslow
Education Director
ISBN - 9780578797250
© 2020 Auditmetrics
For Businesses that order AuditmetricsAI Professional V6.5, we will send a paperbound print versions of the book:
PART I – The Statistical Method
In this section is covered the statistical principles of analyzing empirically derived account data that is the underpinning of economic analysis. The fundamental idea covered is the uncertainty and variation of data used to help explore and understand the dynamics of the business fiscal environment.
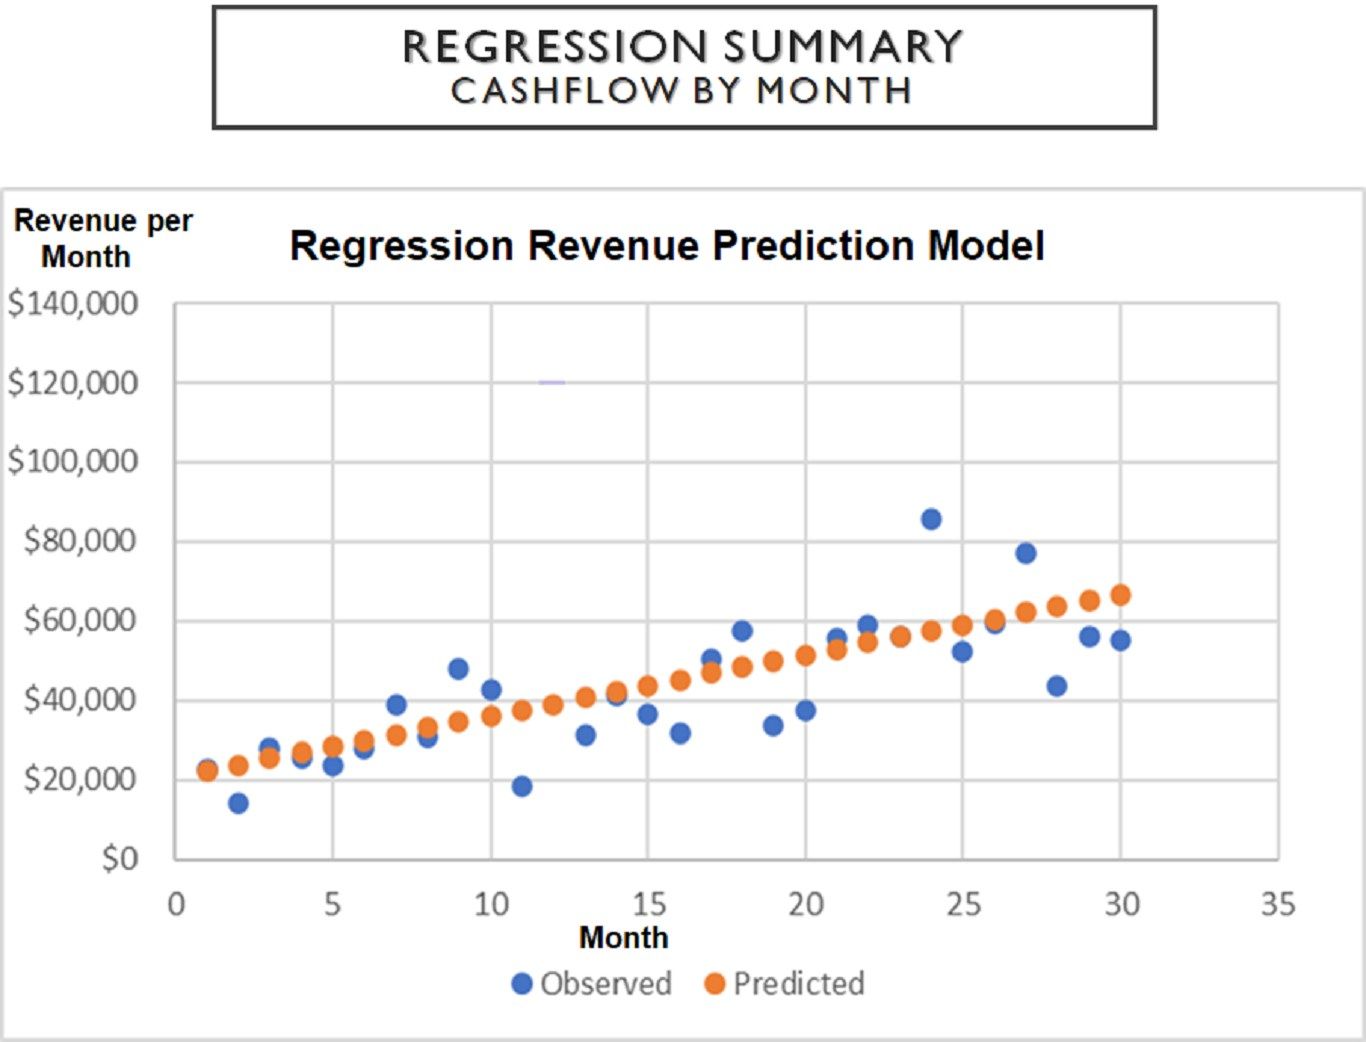
PART II – Forecasting Revenue and Expenses using Multivariate Techniques
This Section is the discussion of two powerful tools for forecasting future economic activity, linear regression and correlation.
The building and interpretation of regression model outputs is accomplished by using MS Excel built-in functions
AUDITMETRICS IS IDEALLY SUITED FOR:
-
Teachers of accounting & business administration who want students to get quickly up to speed with statistical analytics with the use of AI assistance
-
Small businesses that operate out of desktops & laptops who want to keep up with the growing trend in using analytics without investing in less focused analytical tools.
-
CFOs & fiscal managers of larger businesses who want to quickly audit revenue streams, accounts payable and receivable and forecast future trends.
-
CPAs who want to use the AI assisted umbrella to monitor client cashflow and then follow-up with forecasting and market research
-
QucikBooks, Excel and MS Access Data Plugins
-
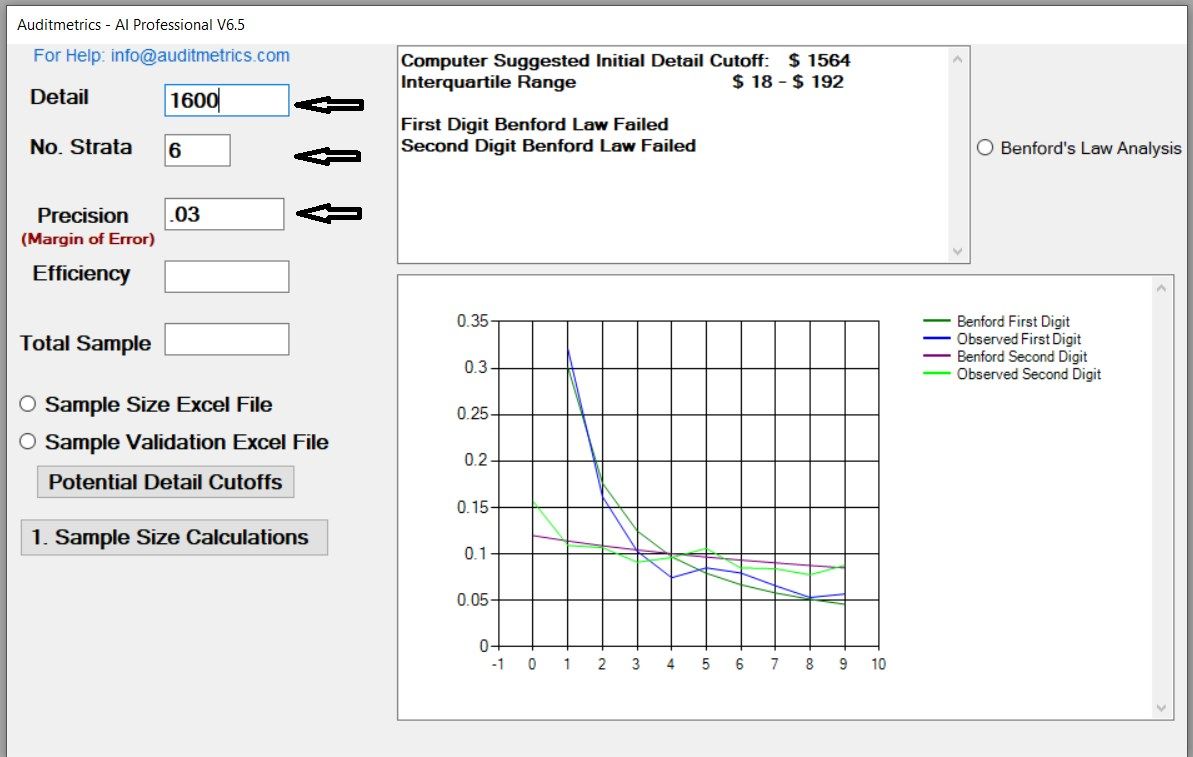
Design Sample Stratification Boundaries
-
Determine Detail (100%) Stratum Cutoff
-
Calculate Strata Sample Size Using Neyman Allocation
-
Generate Stratified Random Sample for Auditing and Forecasting
-
Conduct Forensic Accounting using Bedford's Formula
-
Generate Excel Templates to Record Sample Results
-
Convert Audit dataset for conducting forecasting
-
Use regression and correlation multivariate techniques
-
Deriving Input Data from Various Sources including Excel, Ms Access and QuickBooks