

BeSpiceWave
Description
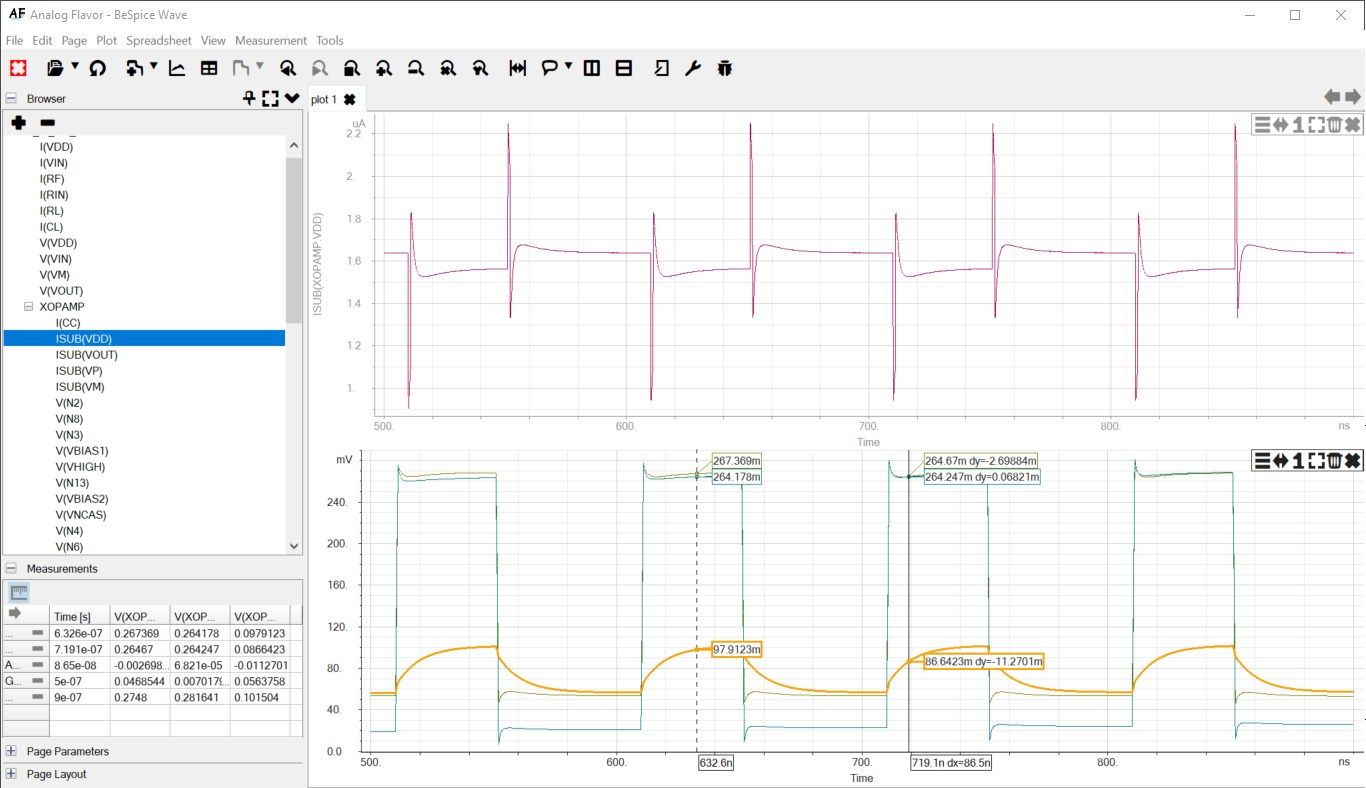
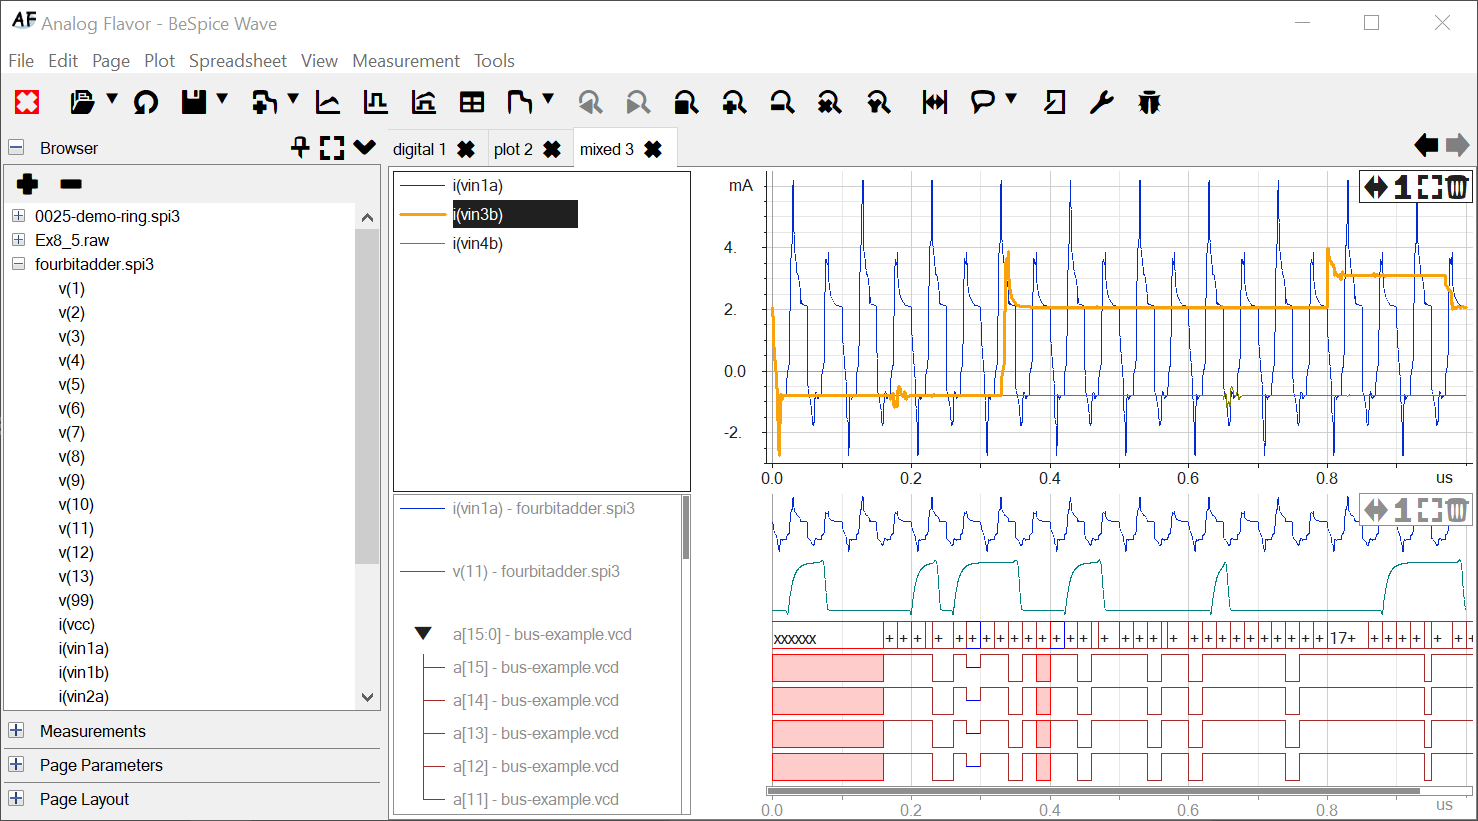
BeSpice Wave shows file data as graphs. Input files can be CSV or VCD files or files generated by SPICE simulators.
BeSpice Wave is frequently used to visualize files generated by data loggers.
As soon as a file has been opened, it’s contents is shown in a hierarchical browser. Double-clicking the an item in the browser or dragging it to the notebook shows the curves as graphs.
The curves can be moved from one plot to another. Several files can be opened. Notebook pages can be detached and split into several individual plots. Cursors allow measurements on the curves.
-
shows CSV files as graphs, visualizes files generated by data loggers, plots ngspice simulation results (*.spi3 files), plots XYCE simulation results (*.prn)
Product ID:
9PG67LV956HH
Release date:
2019-03-15
Last update:
2022-03-12