
Description
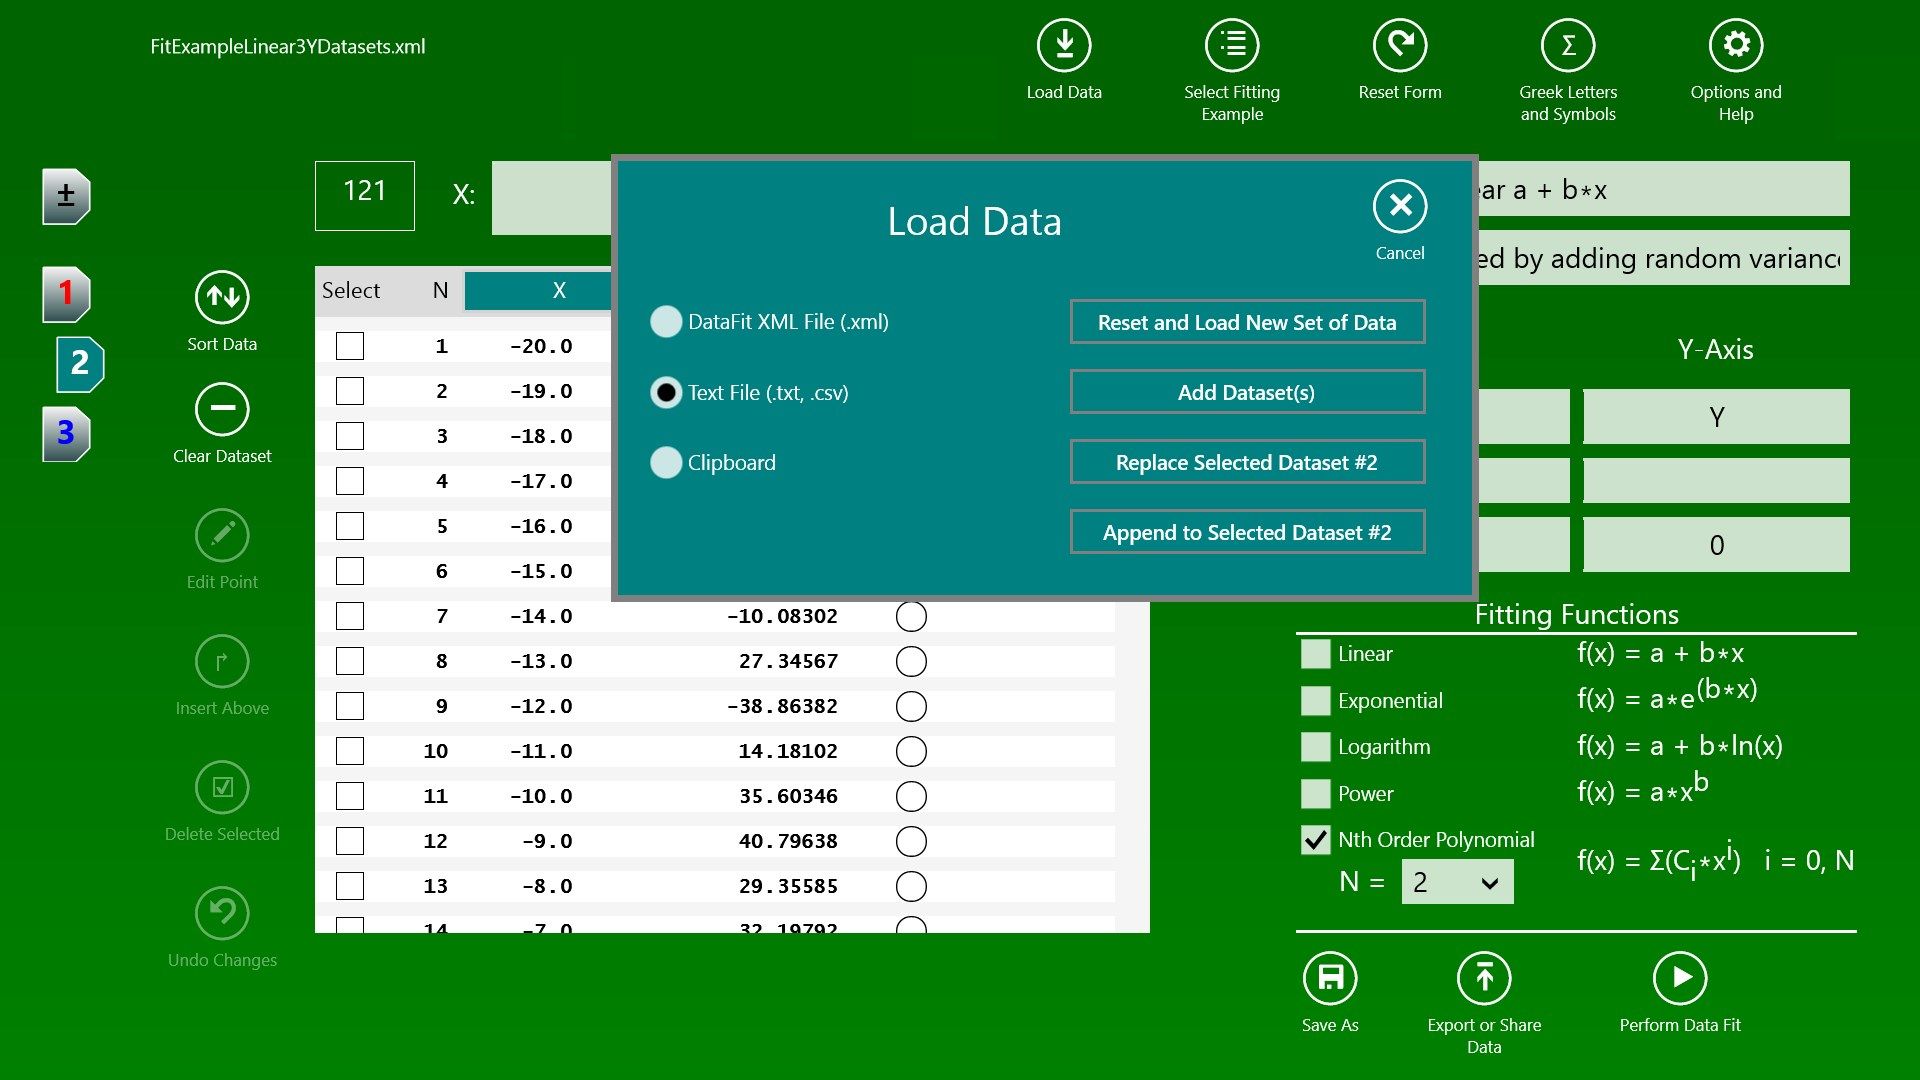
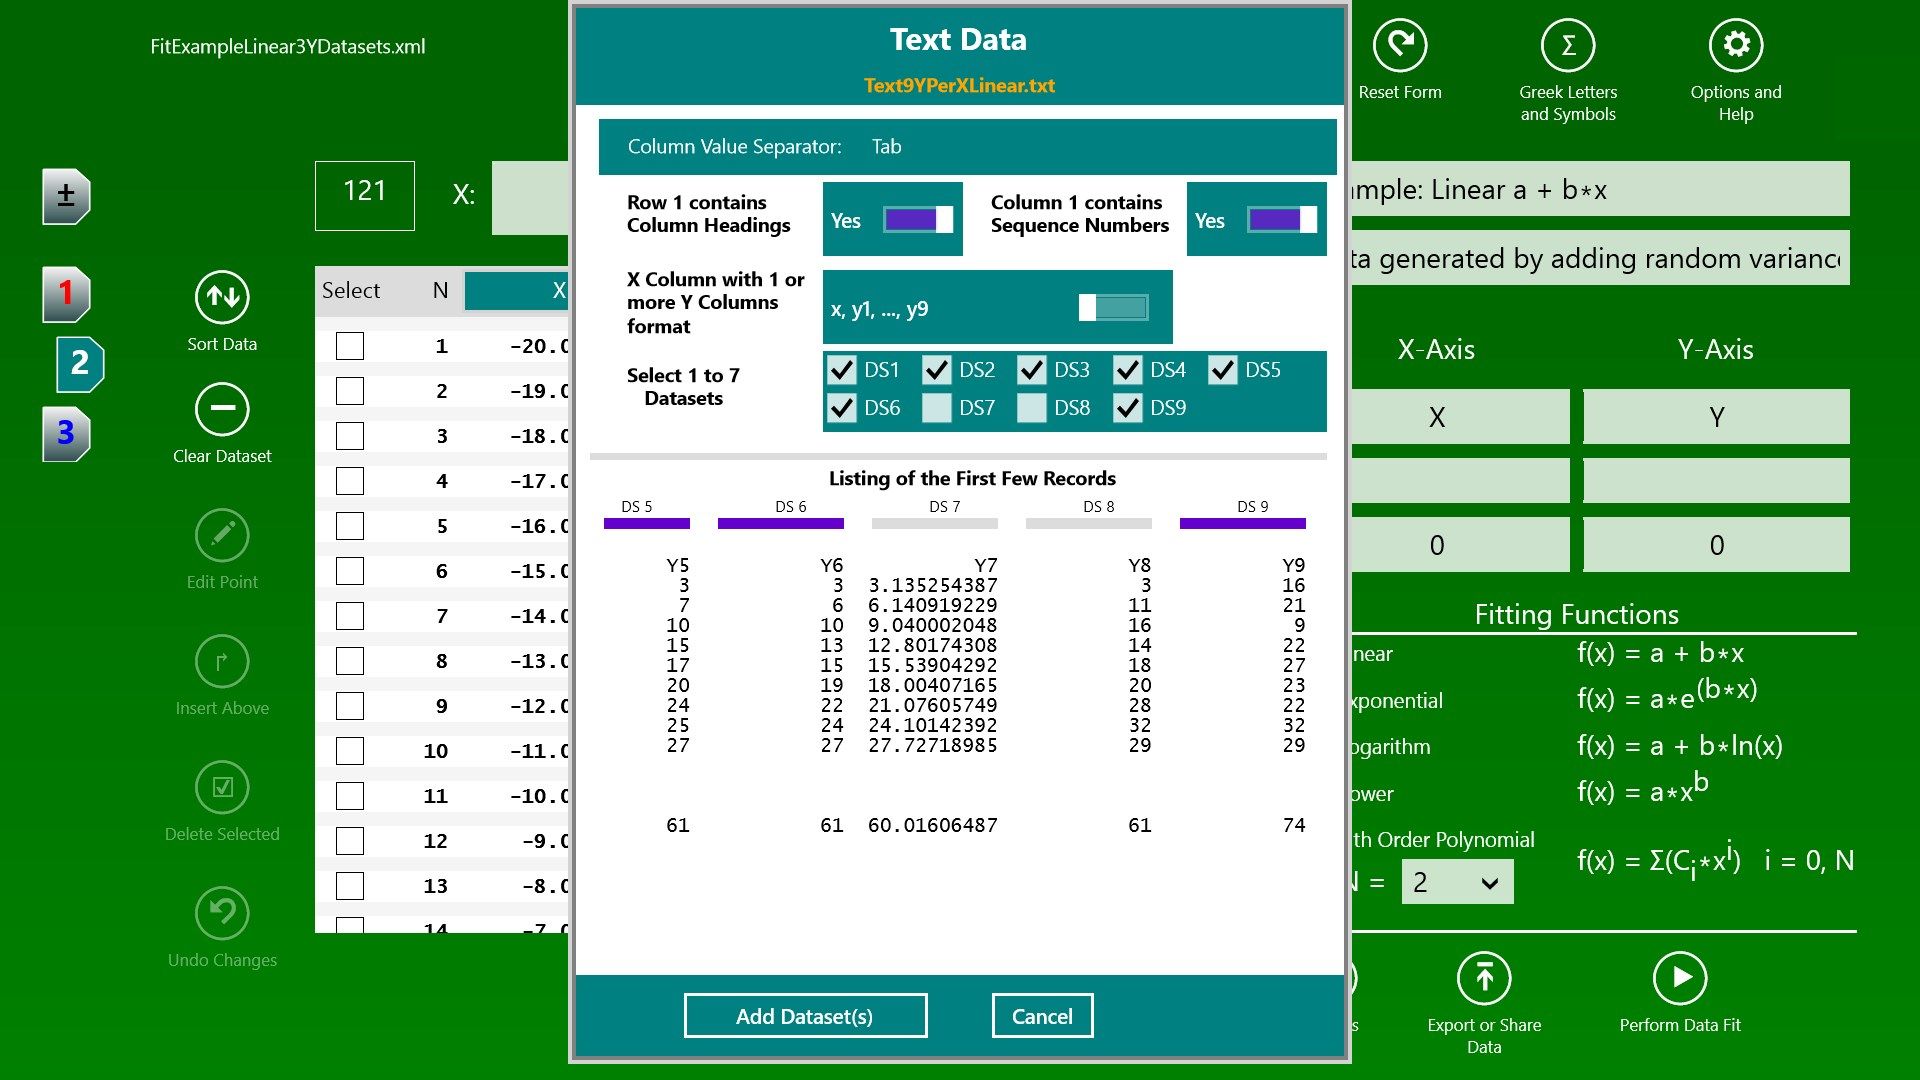
This application performs linear least squares regression fitting to obtain a line of best fit for data. It is designed for scientific and business small datasets less than 500 data points, but can handle larger. Currently, the available fitting functions are Linear, Exponential, Logarithm, Power and Polynomial of order up to 10. It determines the fit line equation, regression R² value, graphs the original data with the fit line and lists the original data with predicted values. Data can be inputted from text files and the clipboard with tab, comma, semicolon and space delimited fields and with fixed width columns as well as inputting DataFit saved xml files. The original data and results can be saved to an XML file for reviewing and exporting. The graph of input data with fit line and its fit equation, R² value and tabular results can be printed. Data point labels per dataset can be added.
-
Supports manually entering xy values or loading xy values from a CSV text file. Multiple datasets can be entered and any combination of them can be fitted.
-
Data Entry form has fields for entering graph meta data, selecting fitting function and saving of xy data.
-
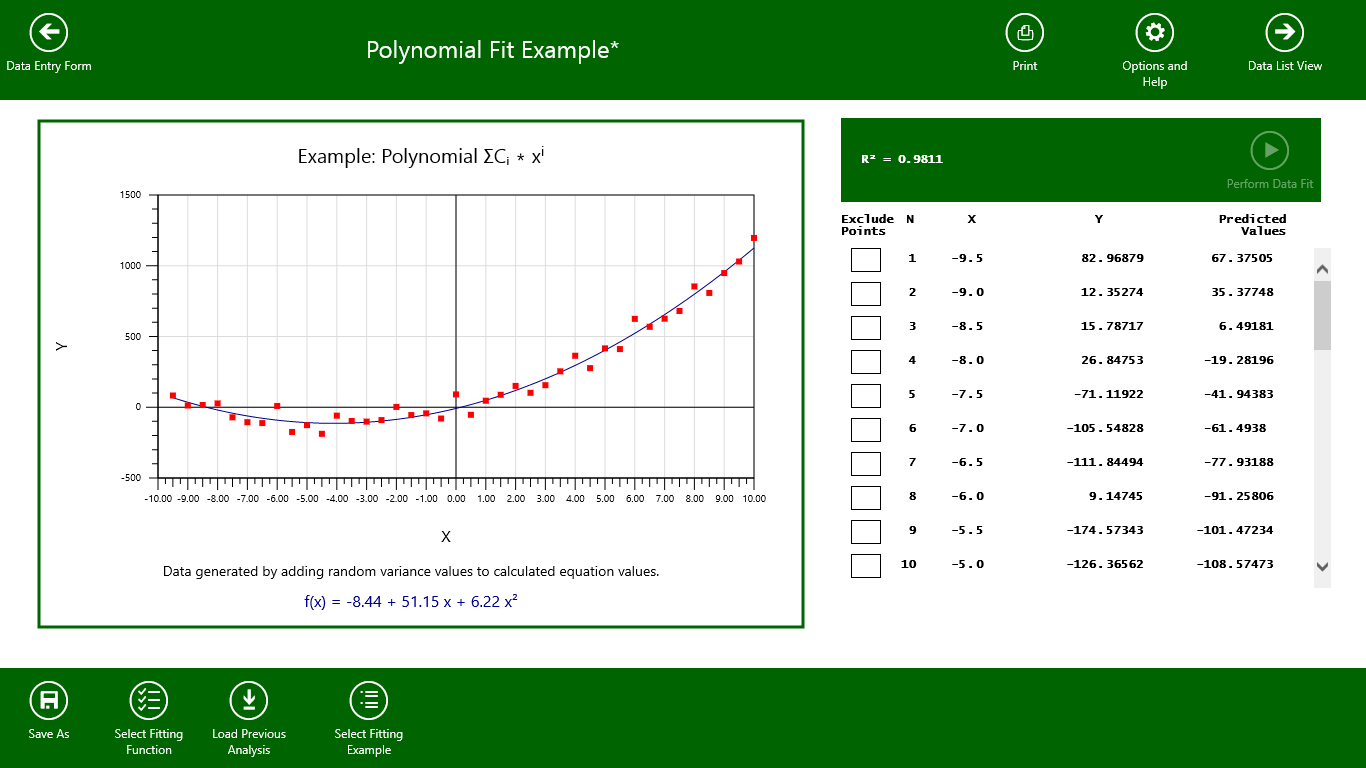
After selecting fitting function simply click on 'Perform Fit' button to do the fit.
-
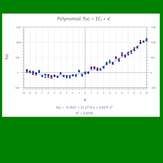
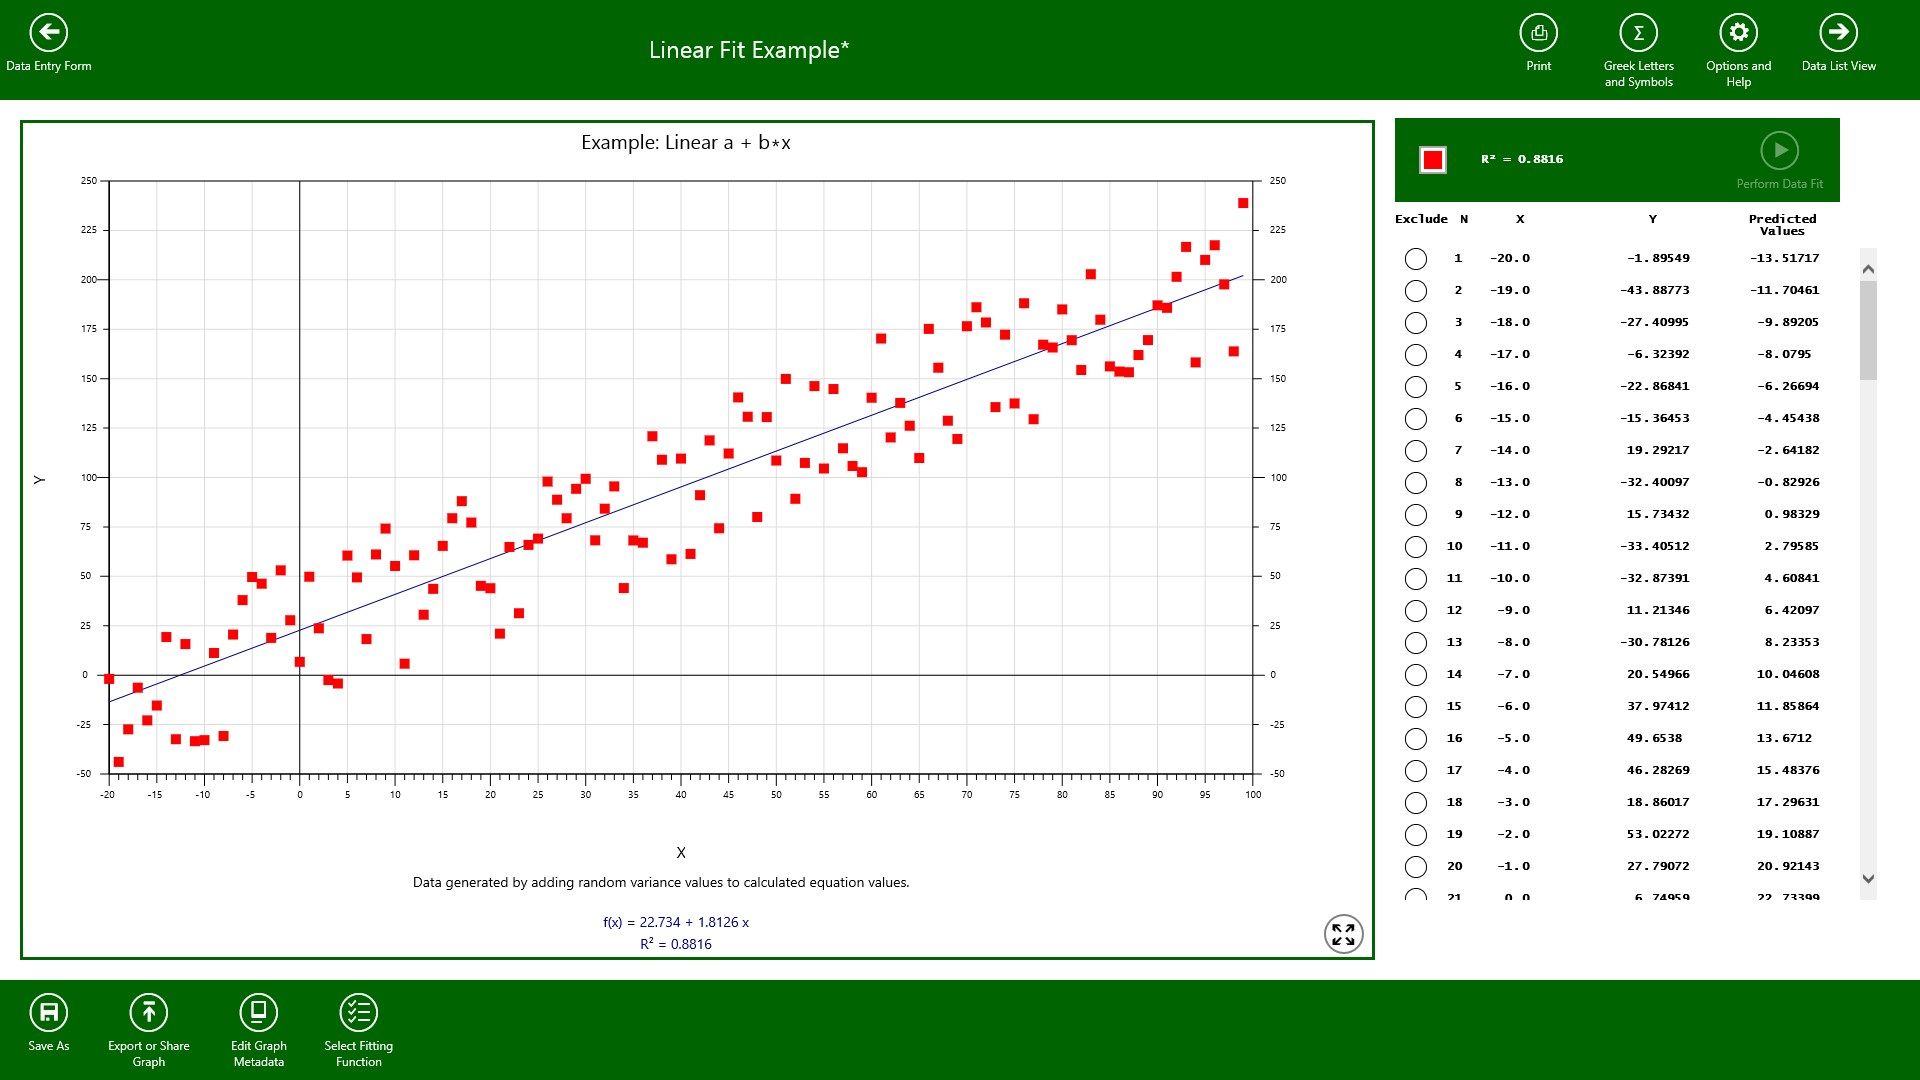
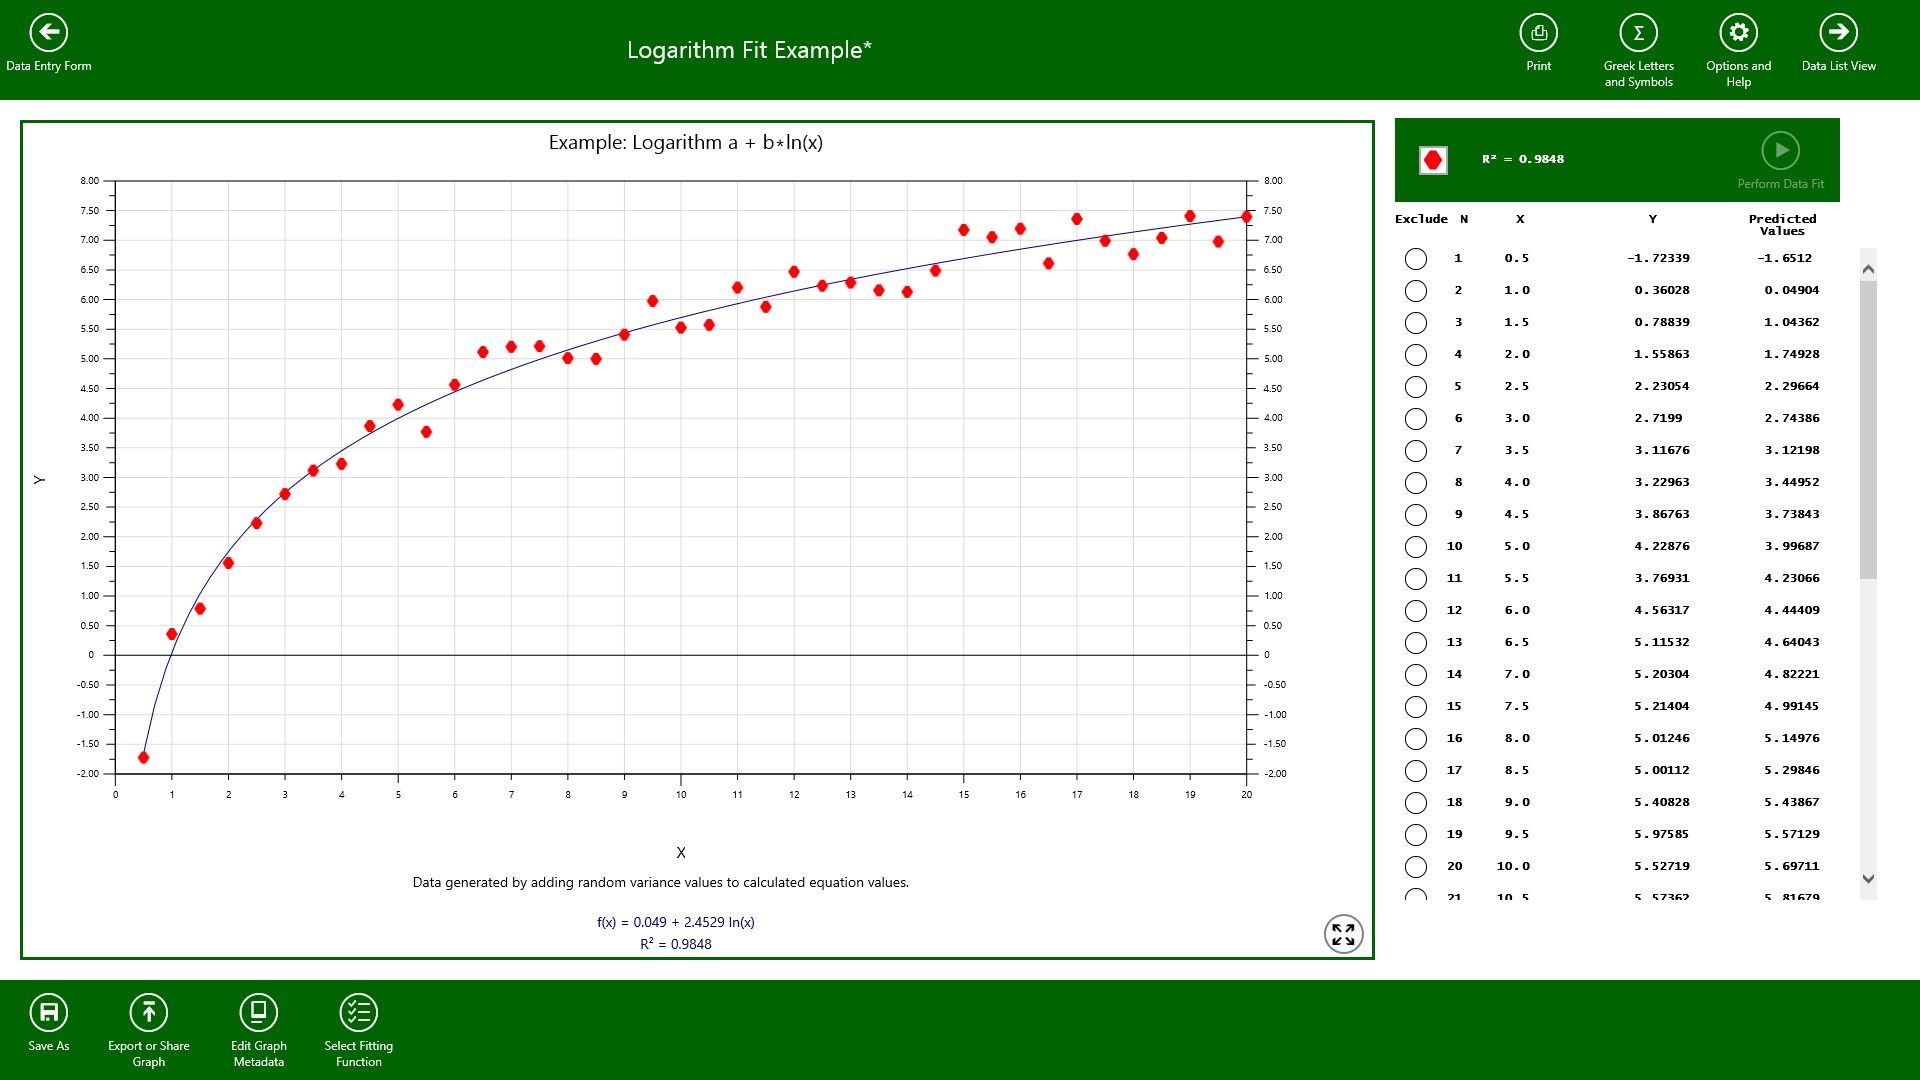
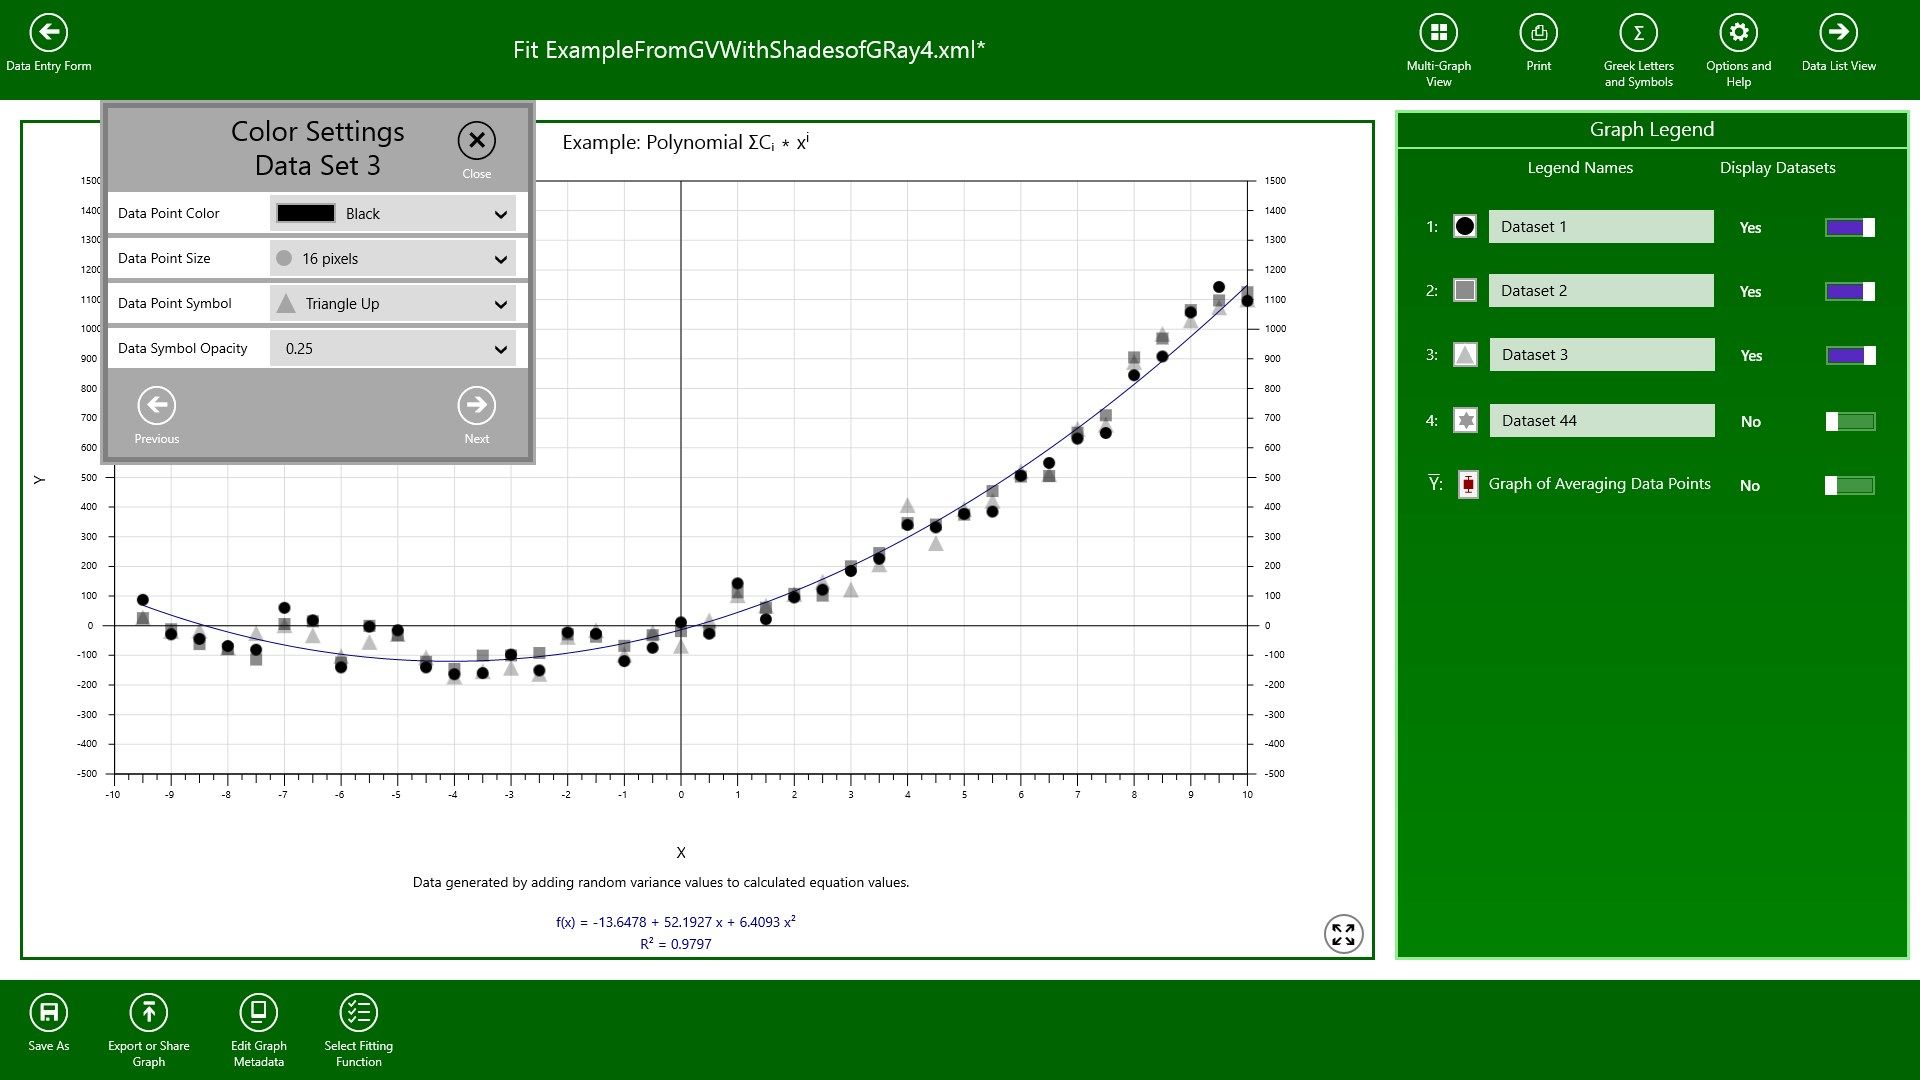
Graph view displays a graph of the data points, line of best fit and determined equation.
-
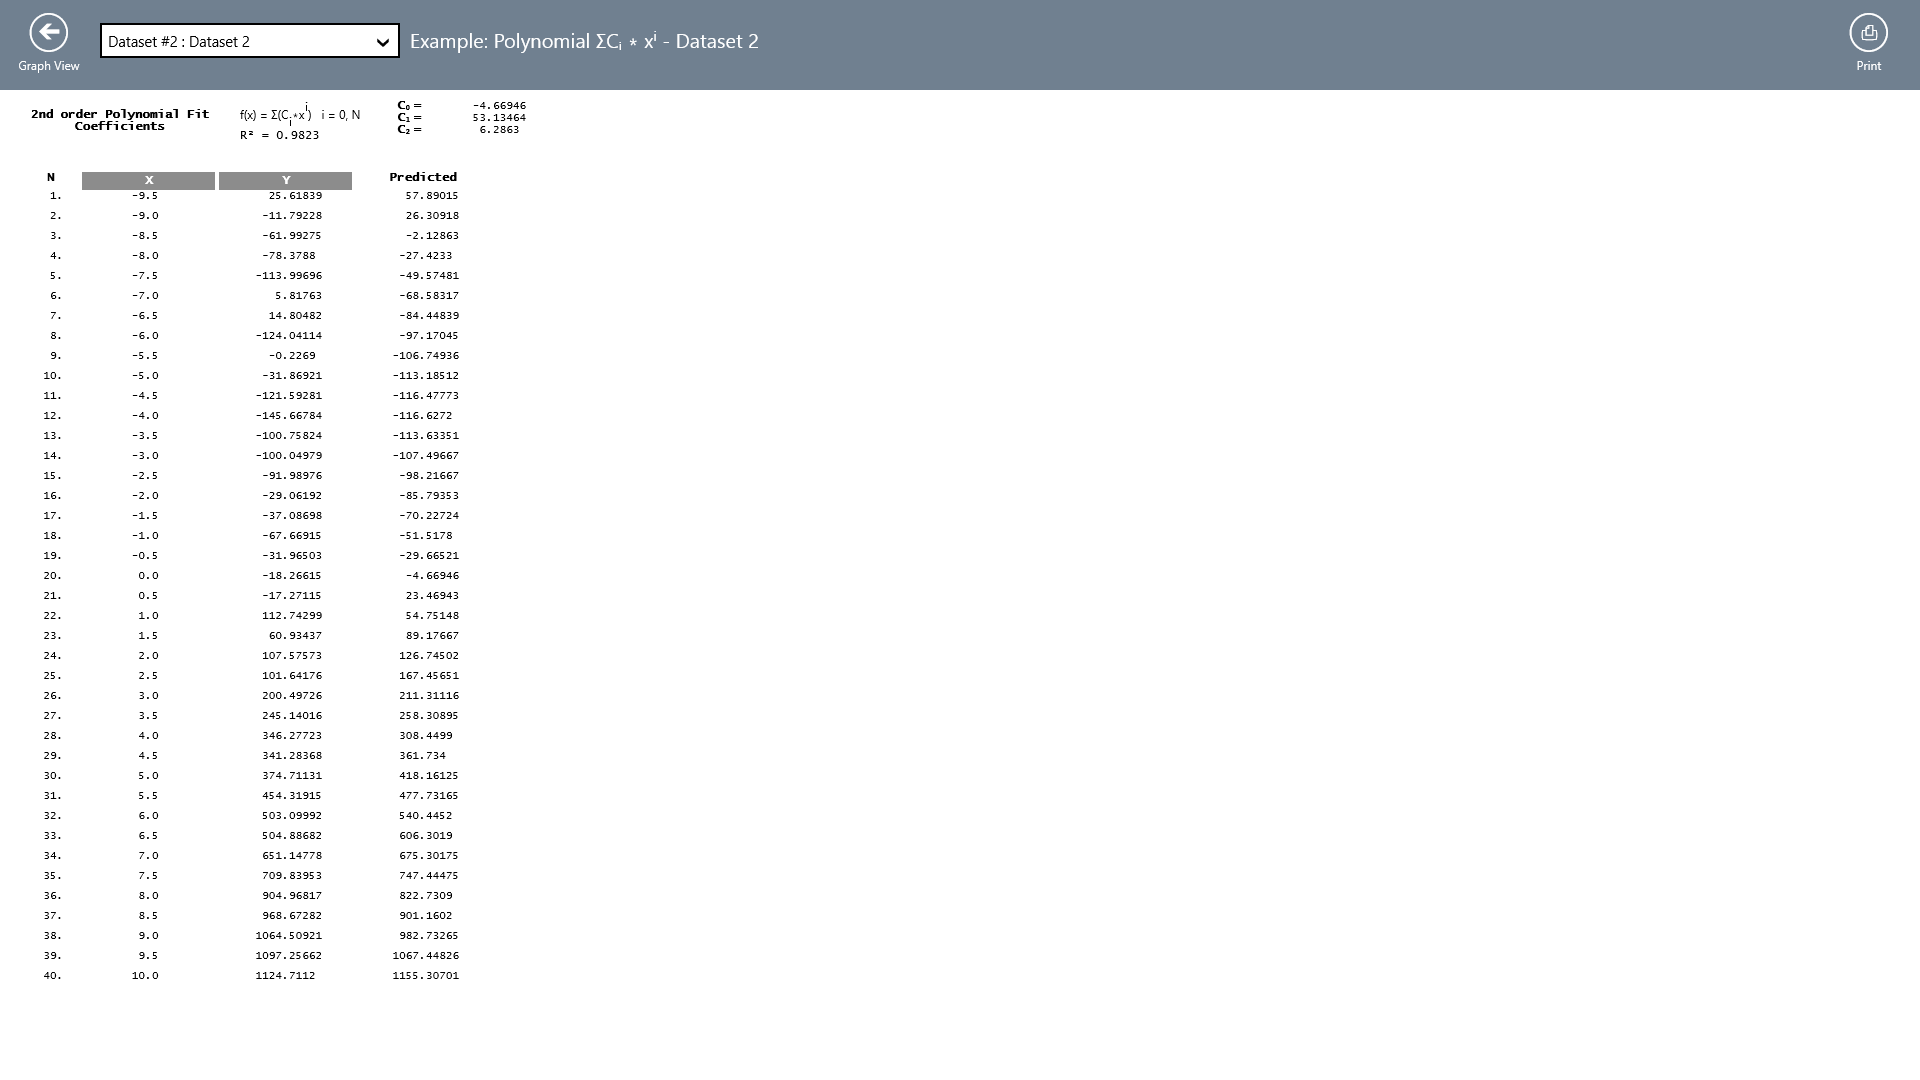
Graph view also displays a tabular view of original data, predicted values and allows for excluding points for a new fit.
-
It supports saving of data and results for reviewing and editing, exporting of xy data in tab delimited text files and printing.
-
Data Entry form has options for autoincrementing the X-Value from a starting value using an increment value.
-
Data Entry form provides tables for selecting Greek Letters and some special symbols for meta data fiels (Title, Caption, X and Y labels and units)
-
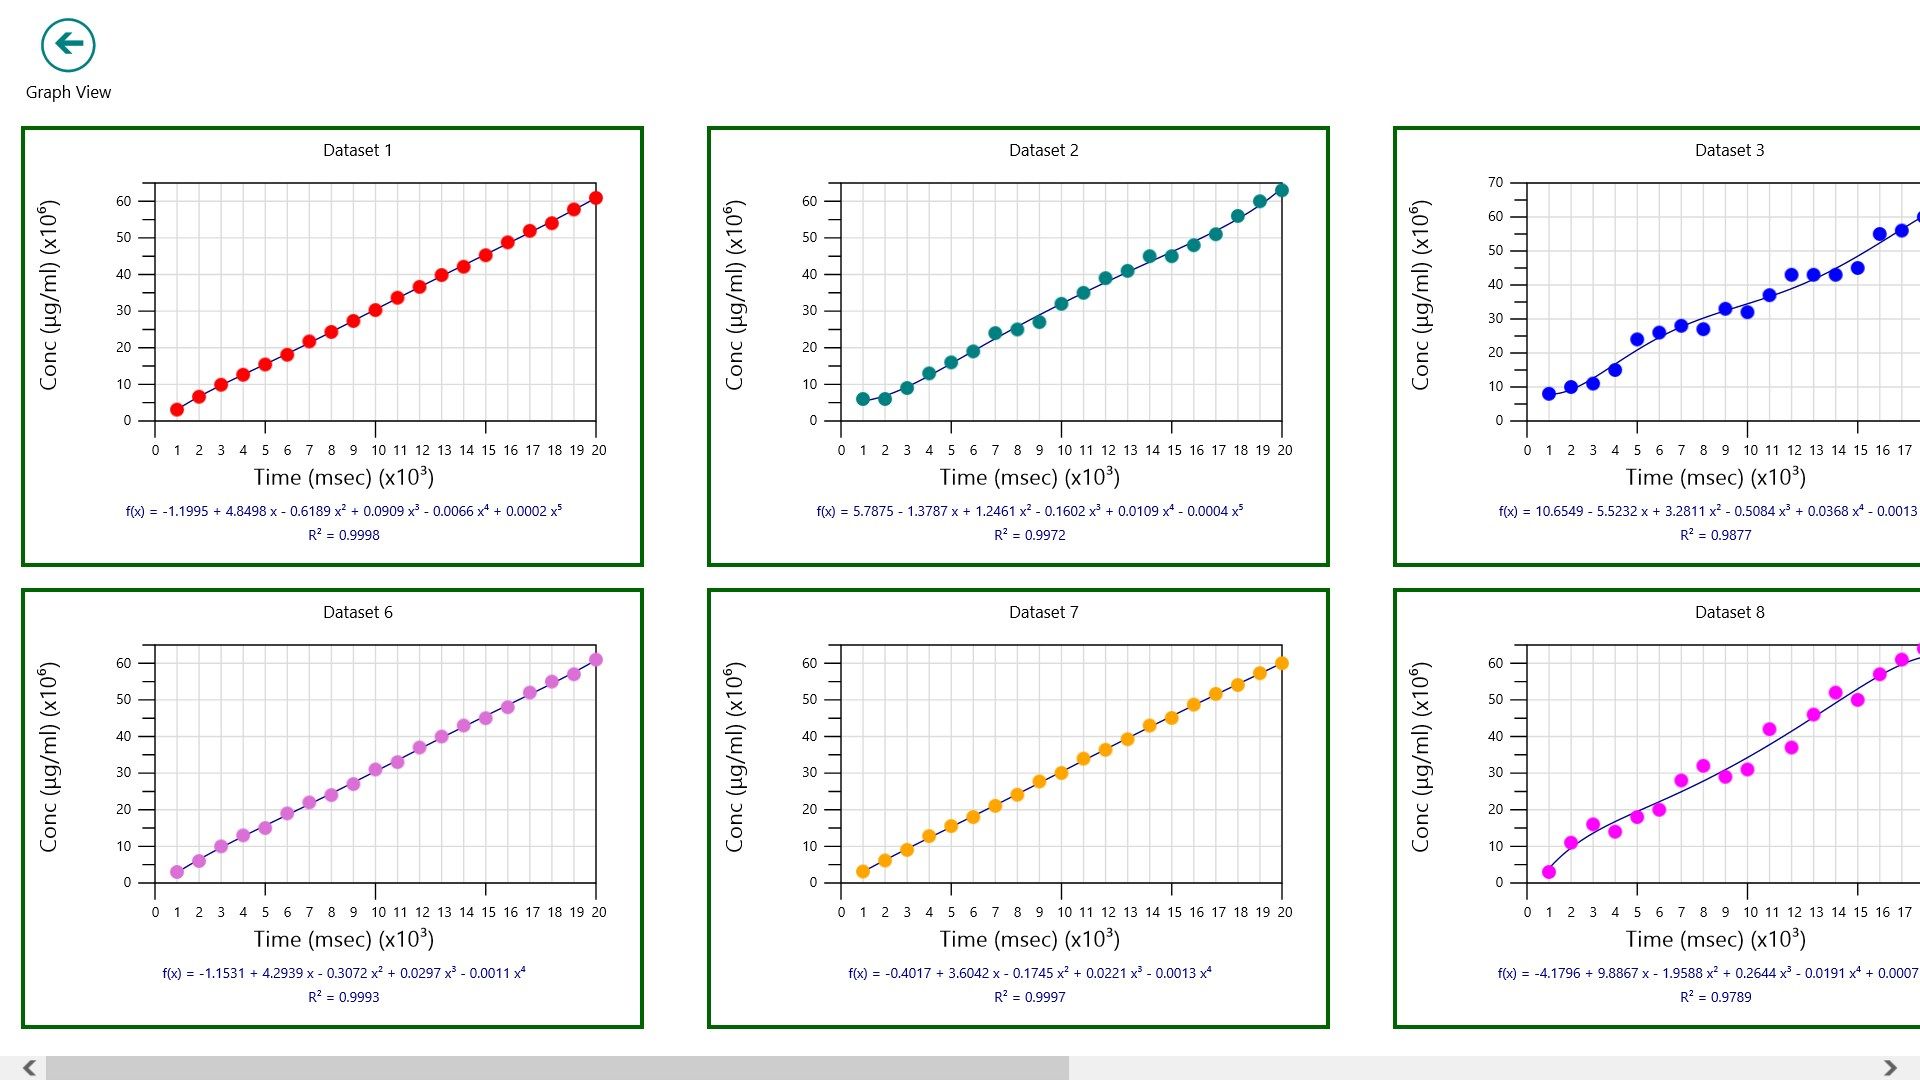
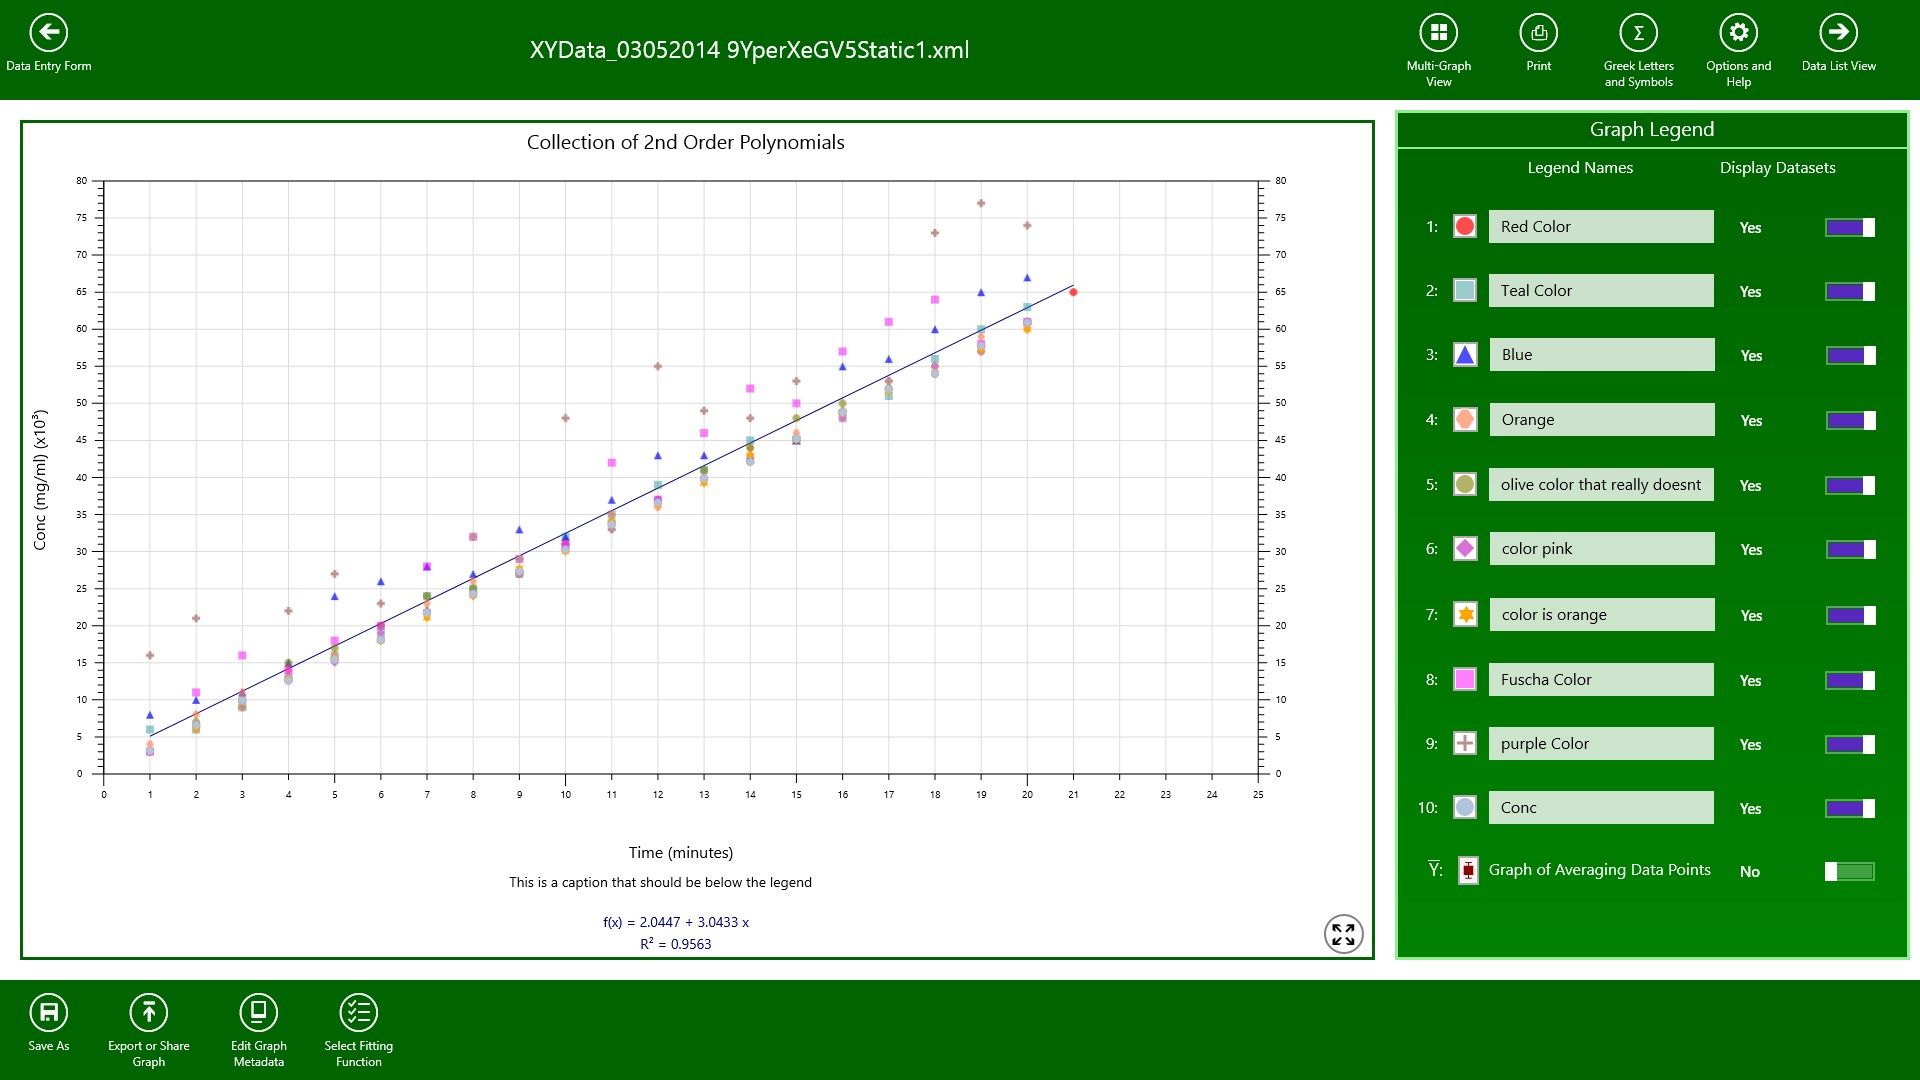
Multiple Graph View with Printing was added to support analyzing multiple datasets
-
Data from the clipboard, text and DataFit .xml files can be merged with data already in data entry form.
-
Data, graph and multi-graph view can be exported to files, the clipboard and shared with applications that support sharing.
-
Slide view of graphs in multi-graph view is available
-
Individual data points for each dataset can be independently labeled.