
Description
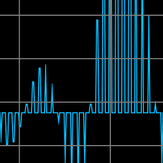
DSAP Studio is a digital signal analysis tool. Allows a discrete signal or its spectrum to be read in a specific format, Fourier or inverse Fourier analysis of the signal, and digital filtering. Short Time FFT analysis with spectrogram is available.
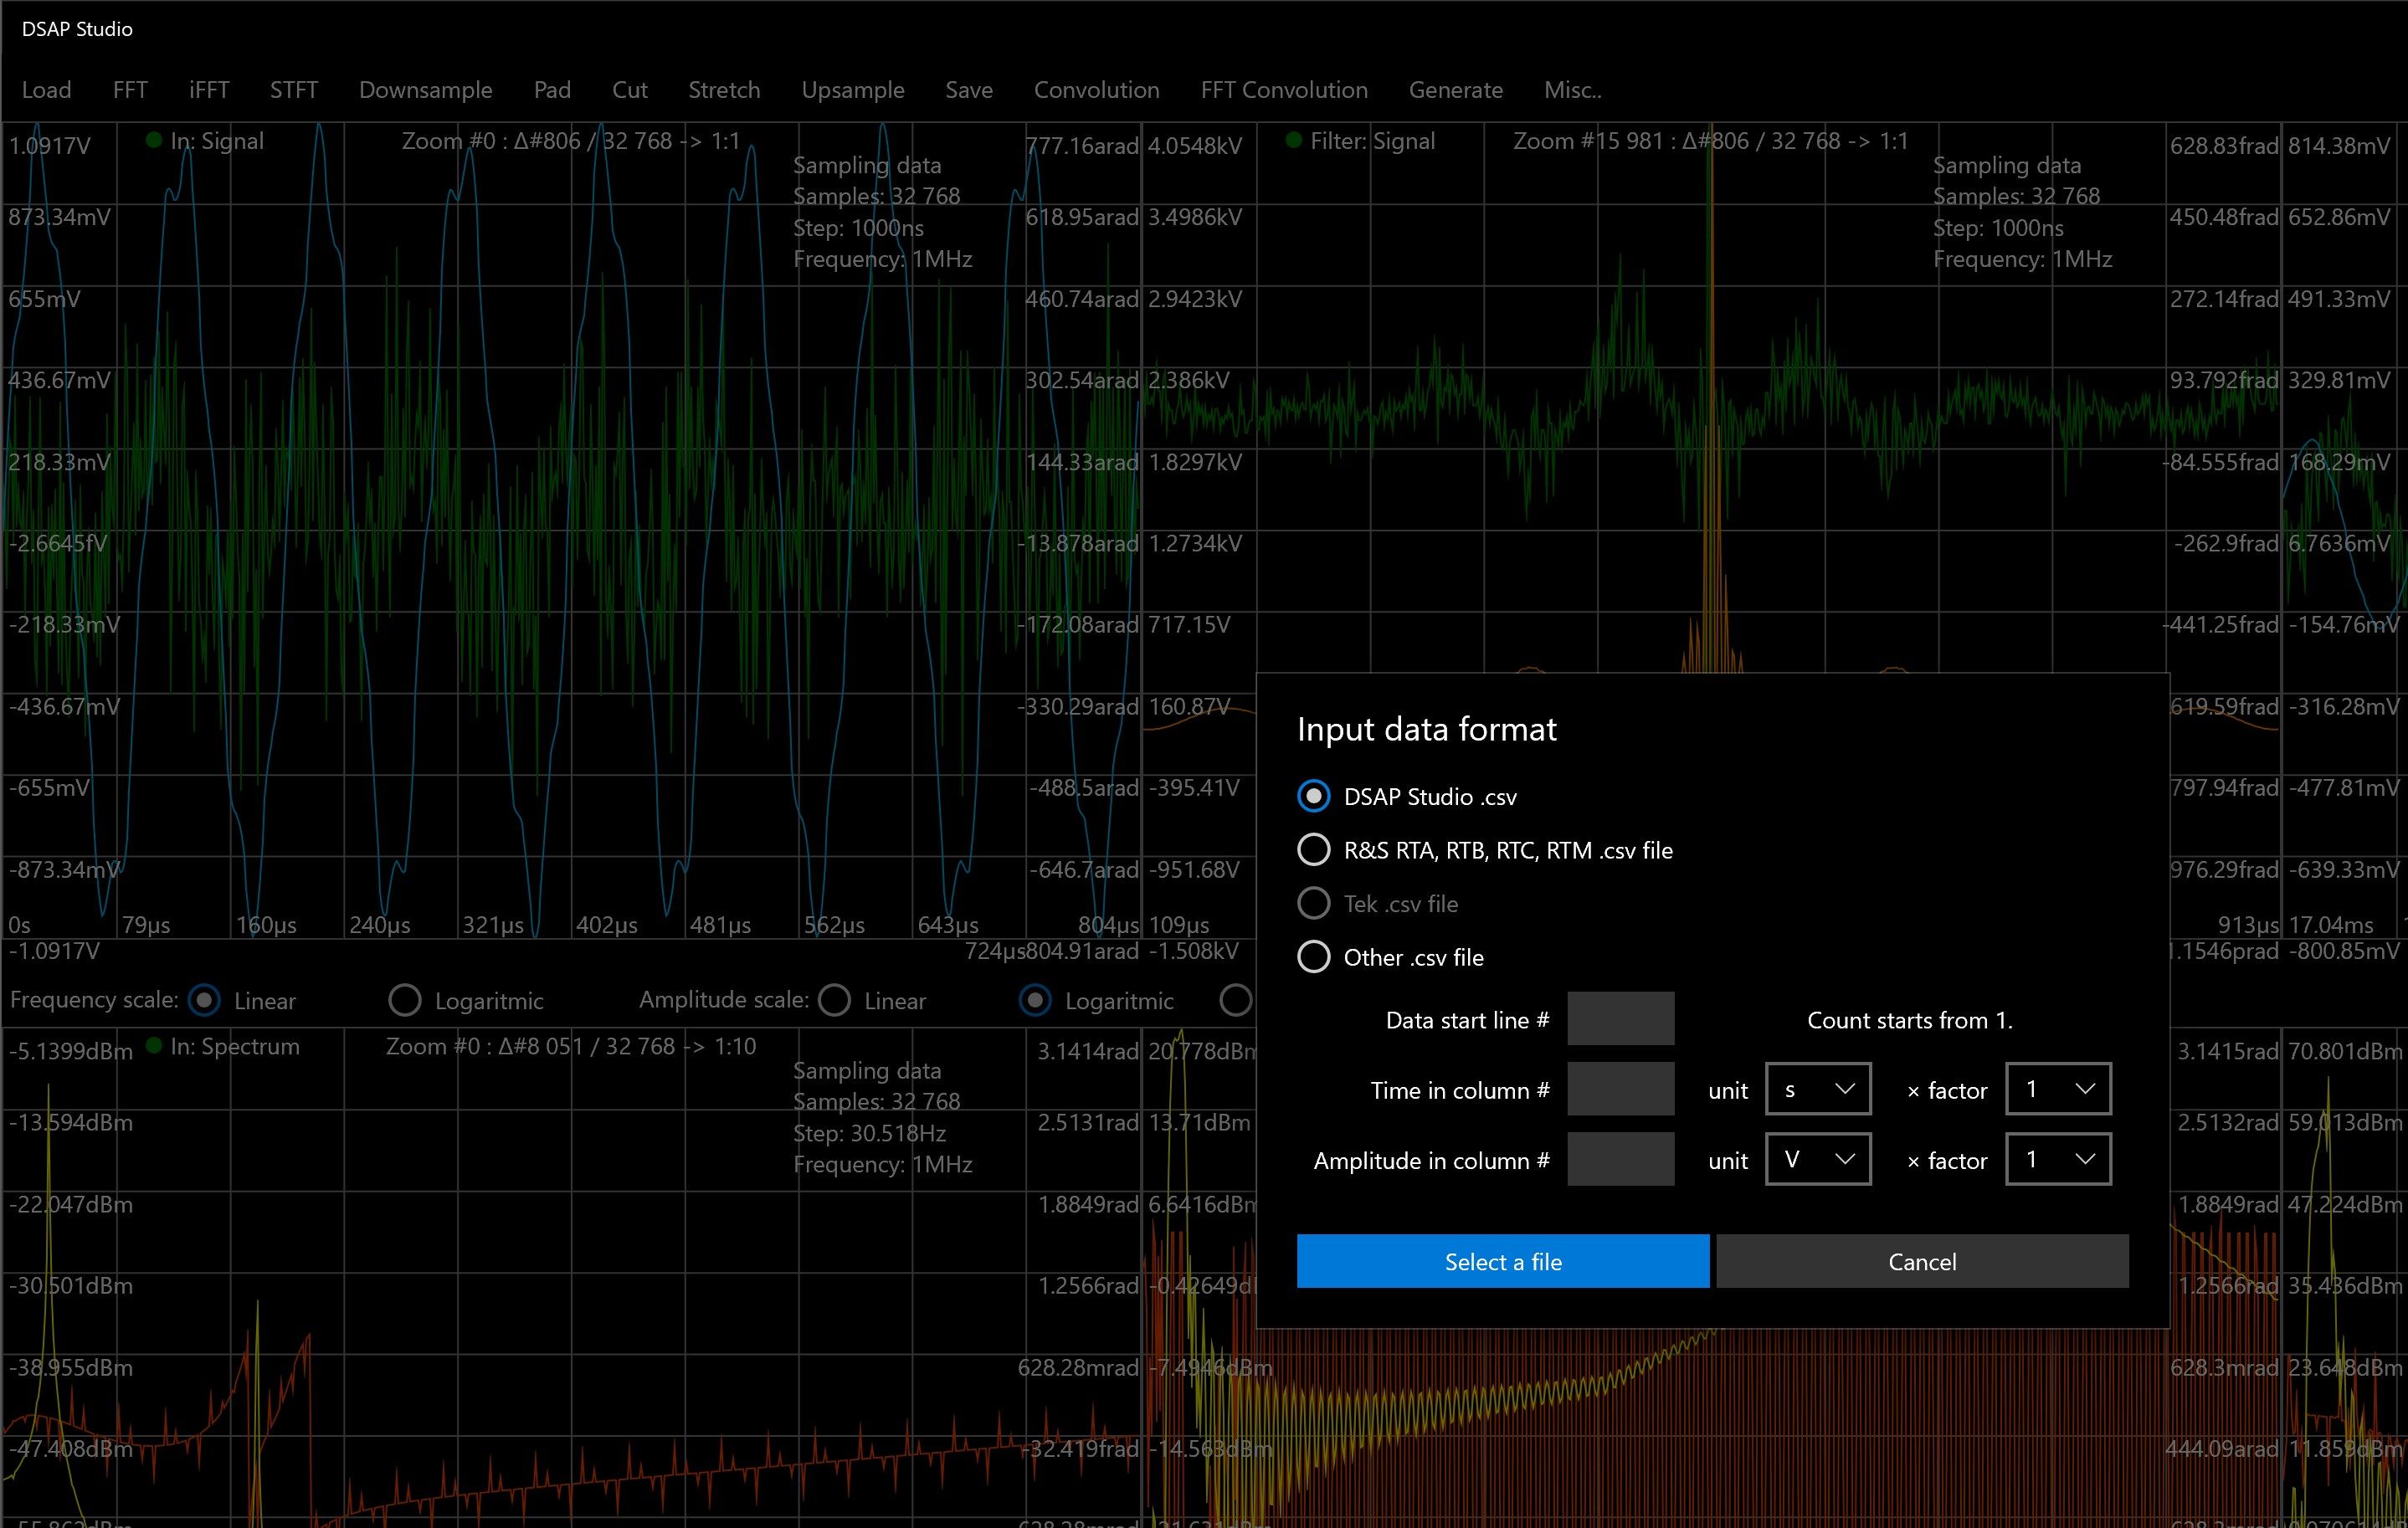
Import of signals or spectra recorded directly from the oscilloscope is supported:
R&S RTB, RTM, RTA series.
Import of signals or spectra from other data sources is also possible, just set first row position and column data positions, units and multipliers.
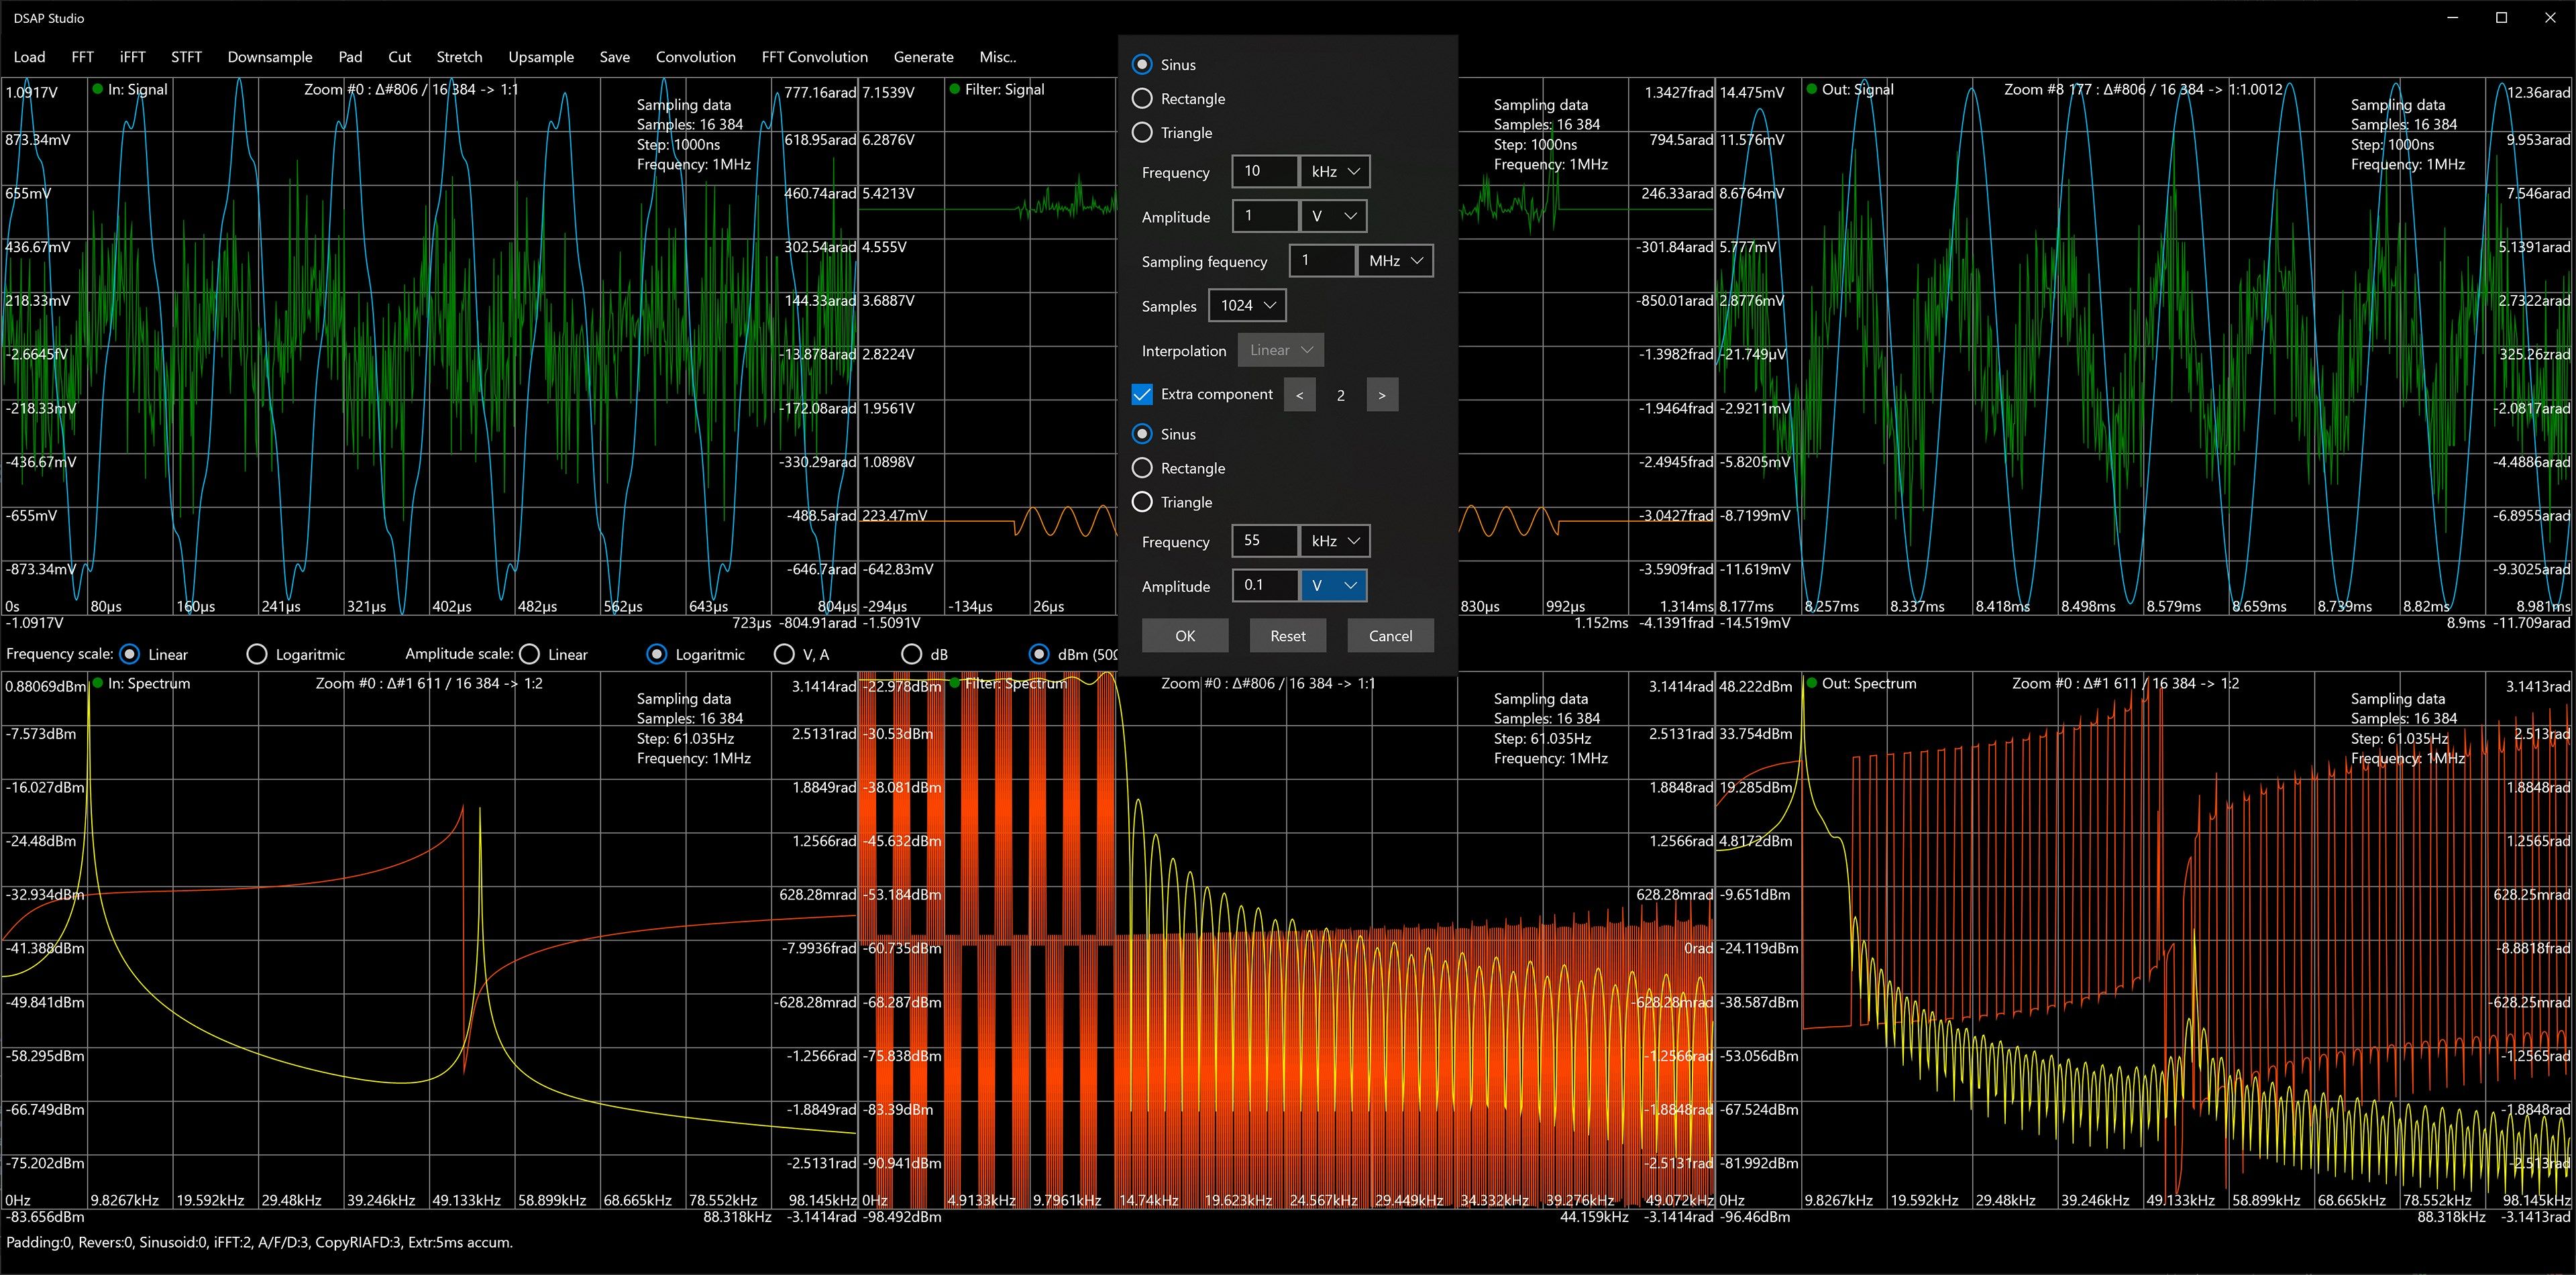
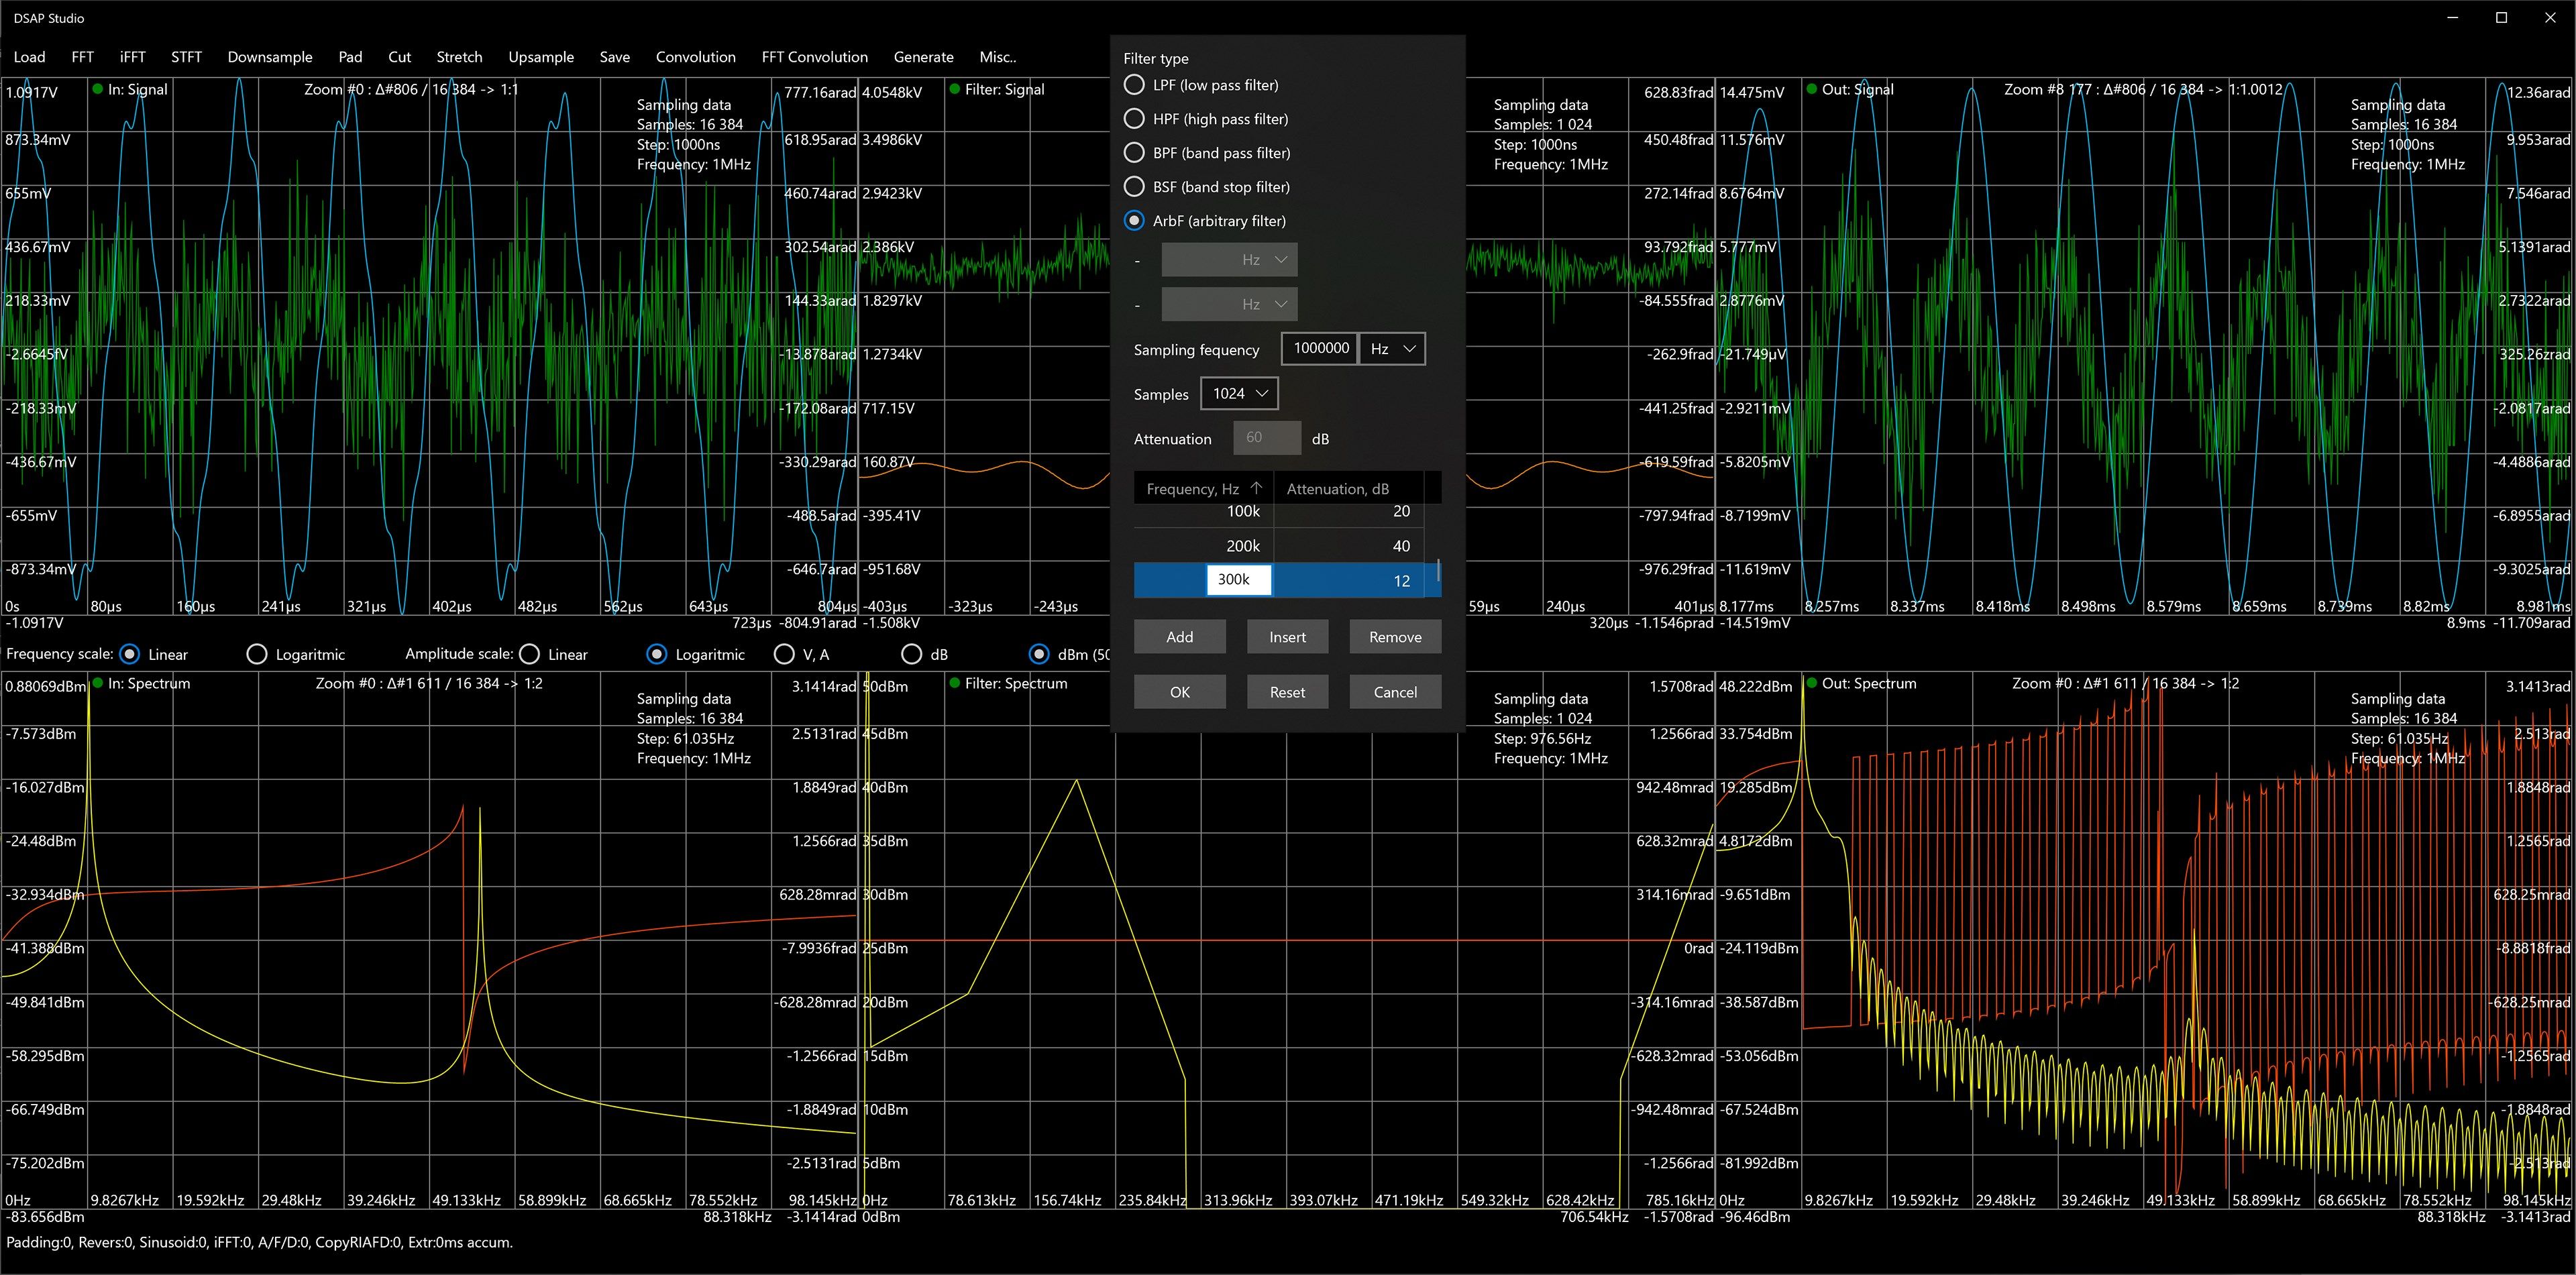
The user can specify the frequency values of the digital filter and analyze the effect of the filter on the input signal accordingly.
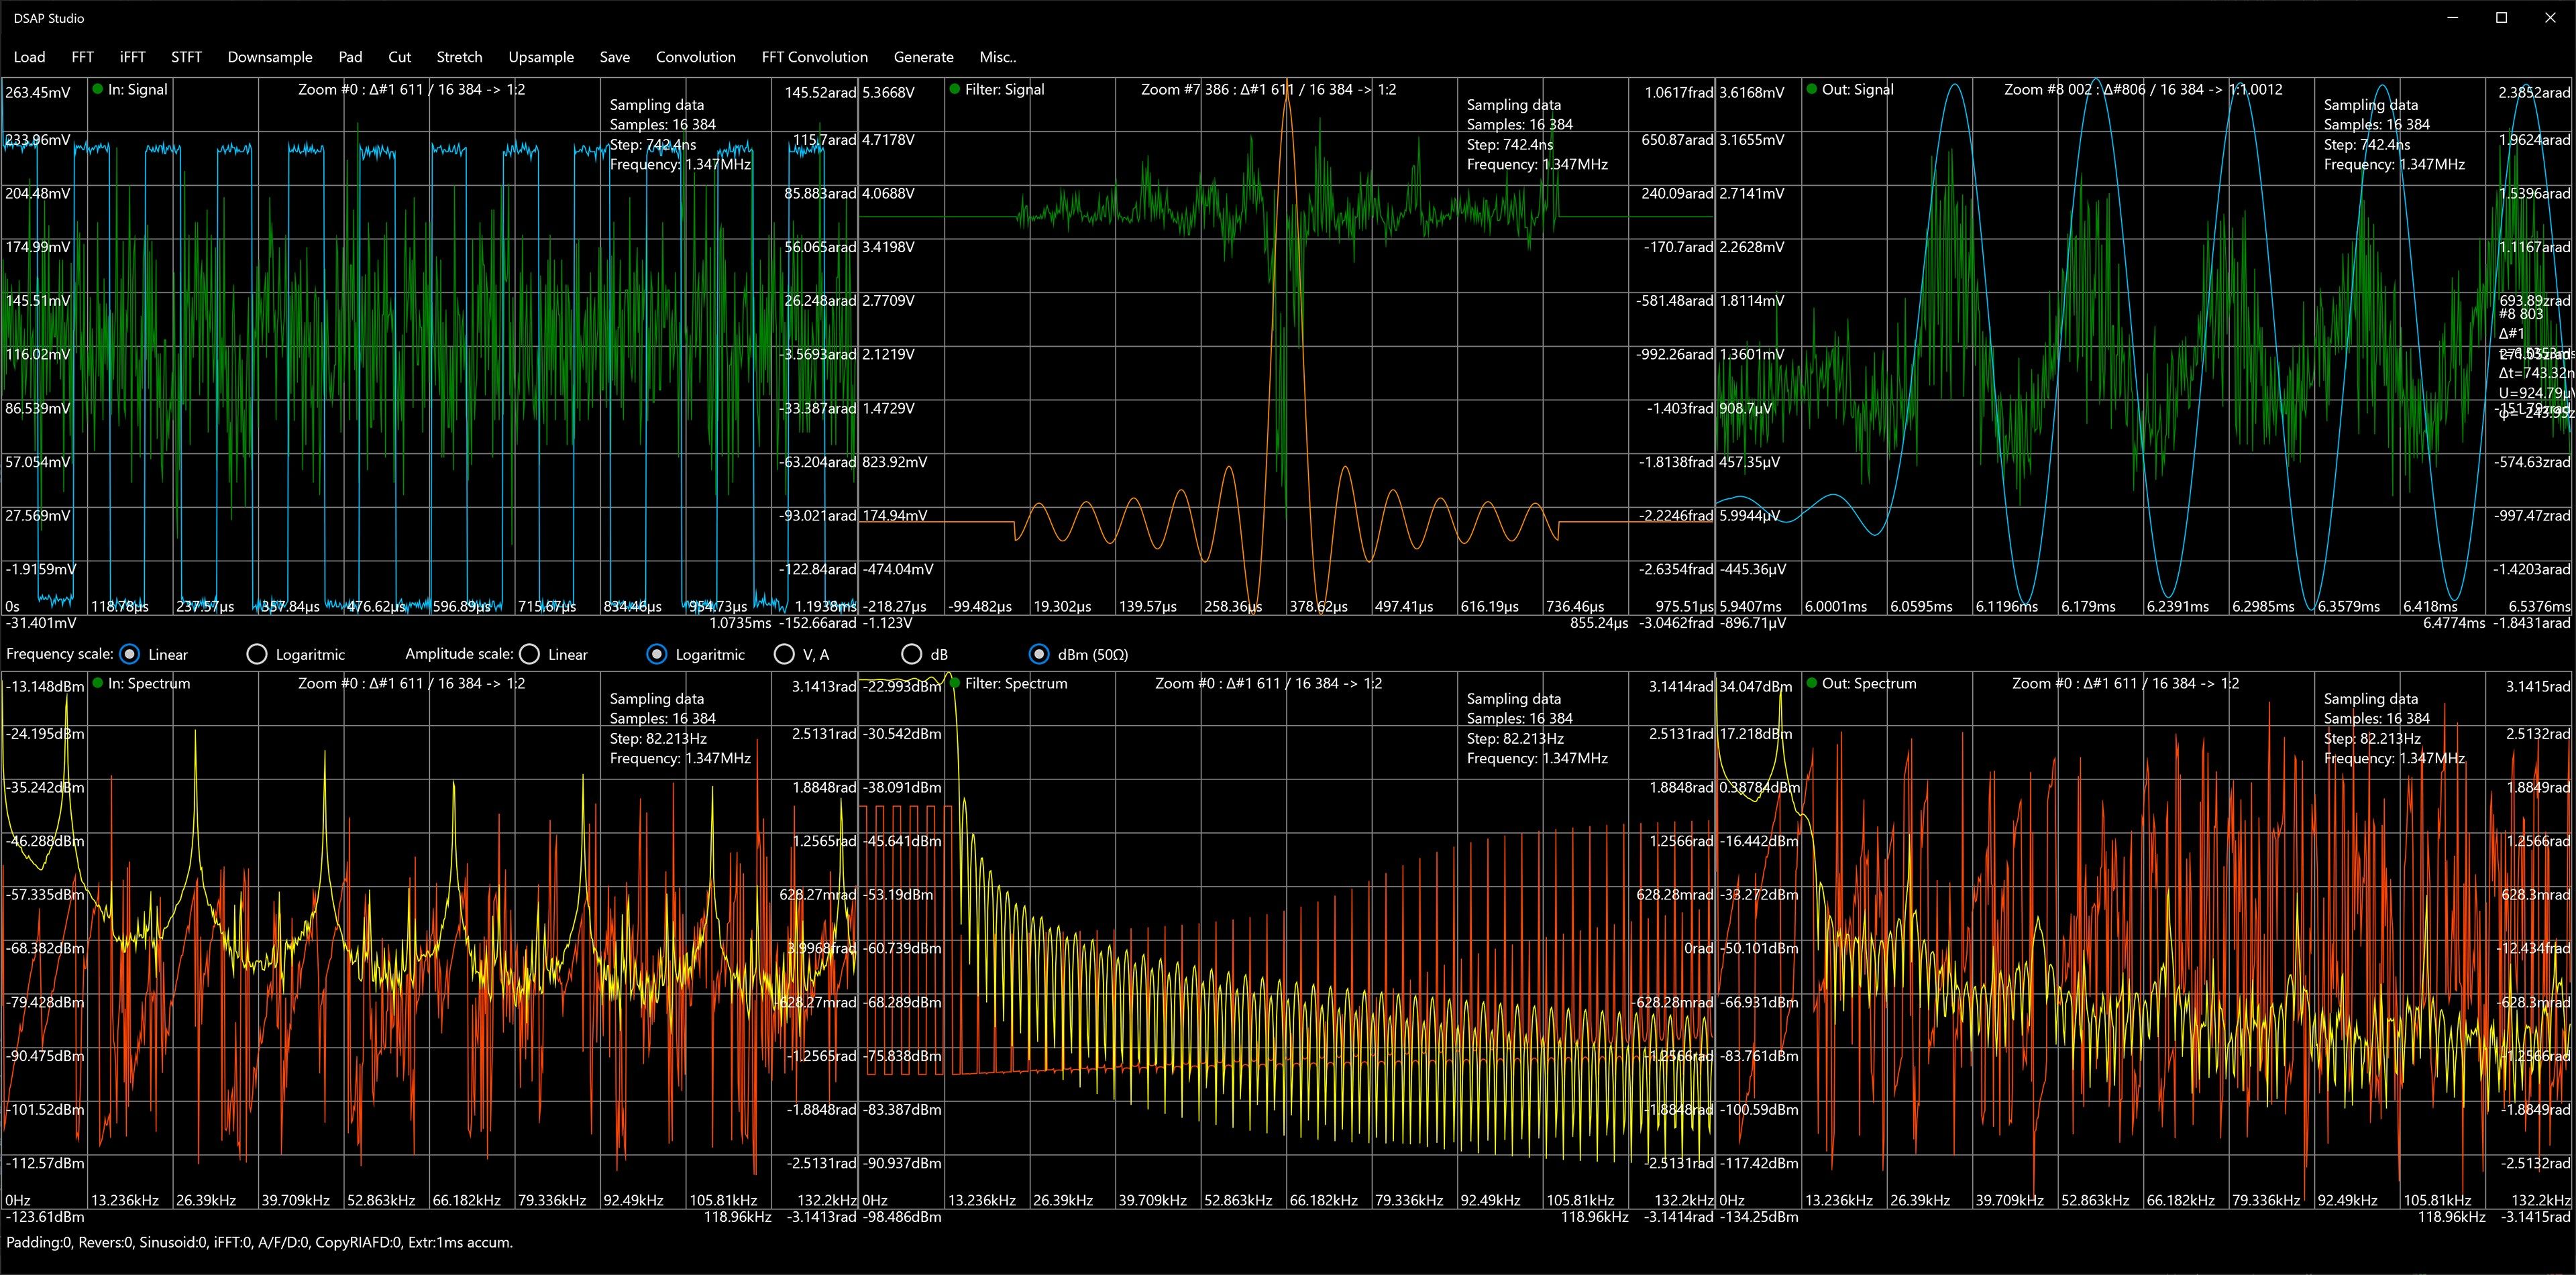
The user can generate a signal from several components of different shapes, frequencies and amplitudes and process it with the desired filter. Configuring of arbitrary filter is also possible beside to low-pass, high-pass, band-pass and band-stop filter. Spectrum of arbitrary filter can be set by multiple pairs of frequency-attenuation.
It is possible set a specific level for signal or spectrum and analyse filtered transient samples. This is useful when signal or spectrum has more samples than display can represent and some interesting samples are decimated or averaged to overall level.
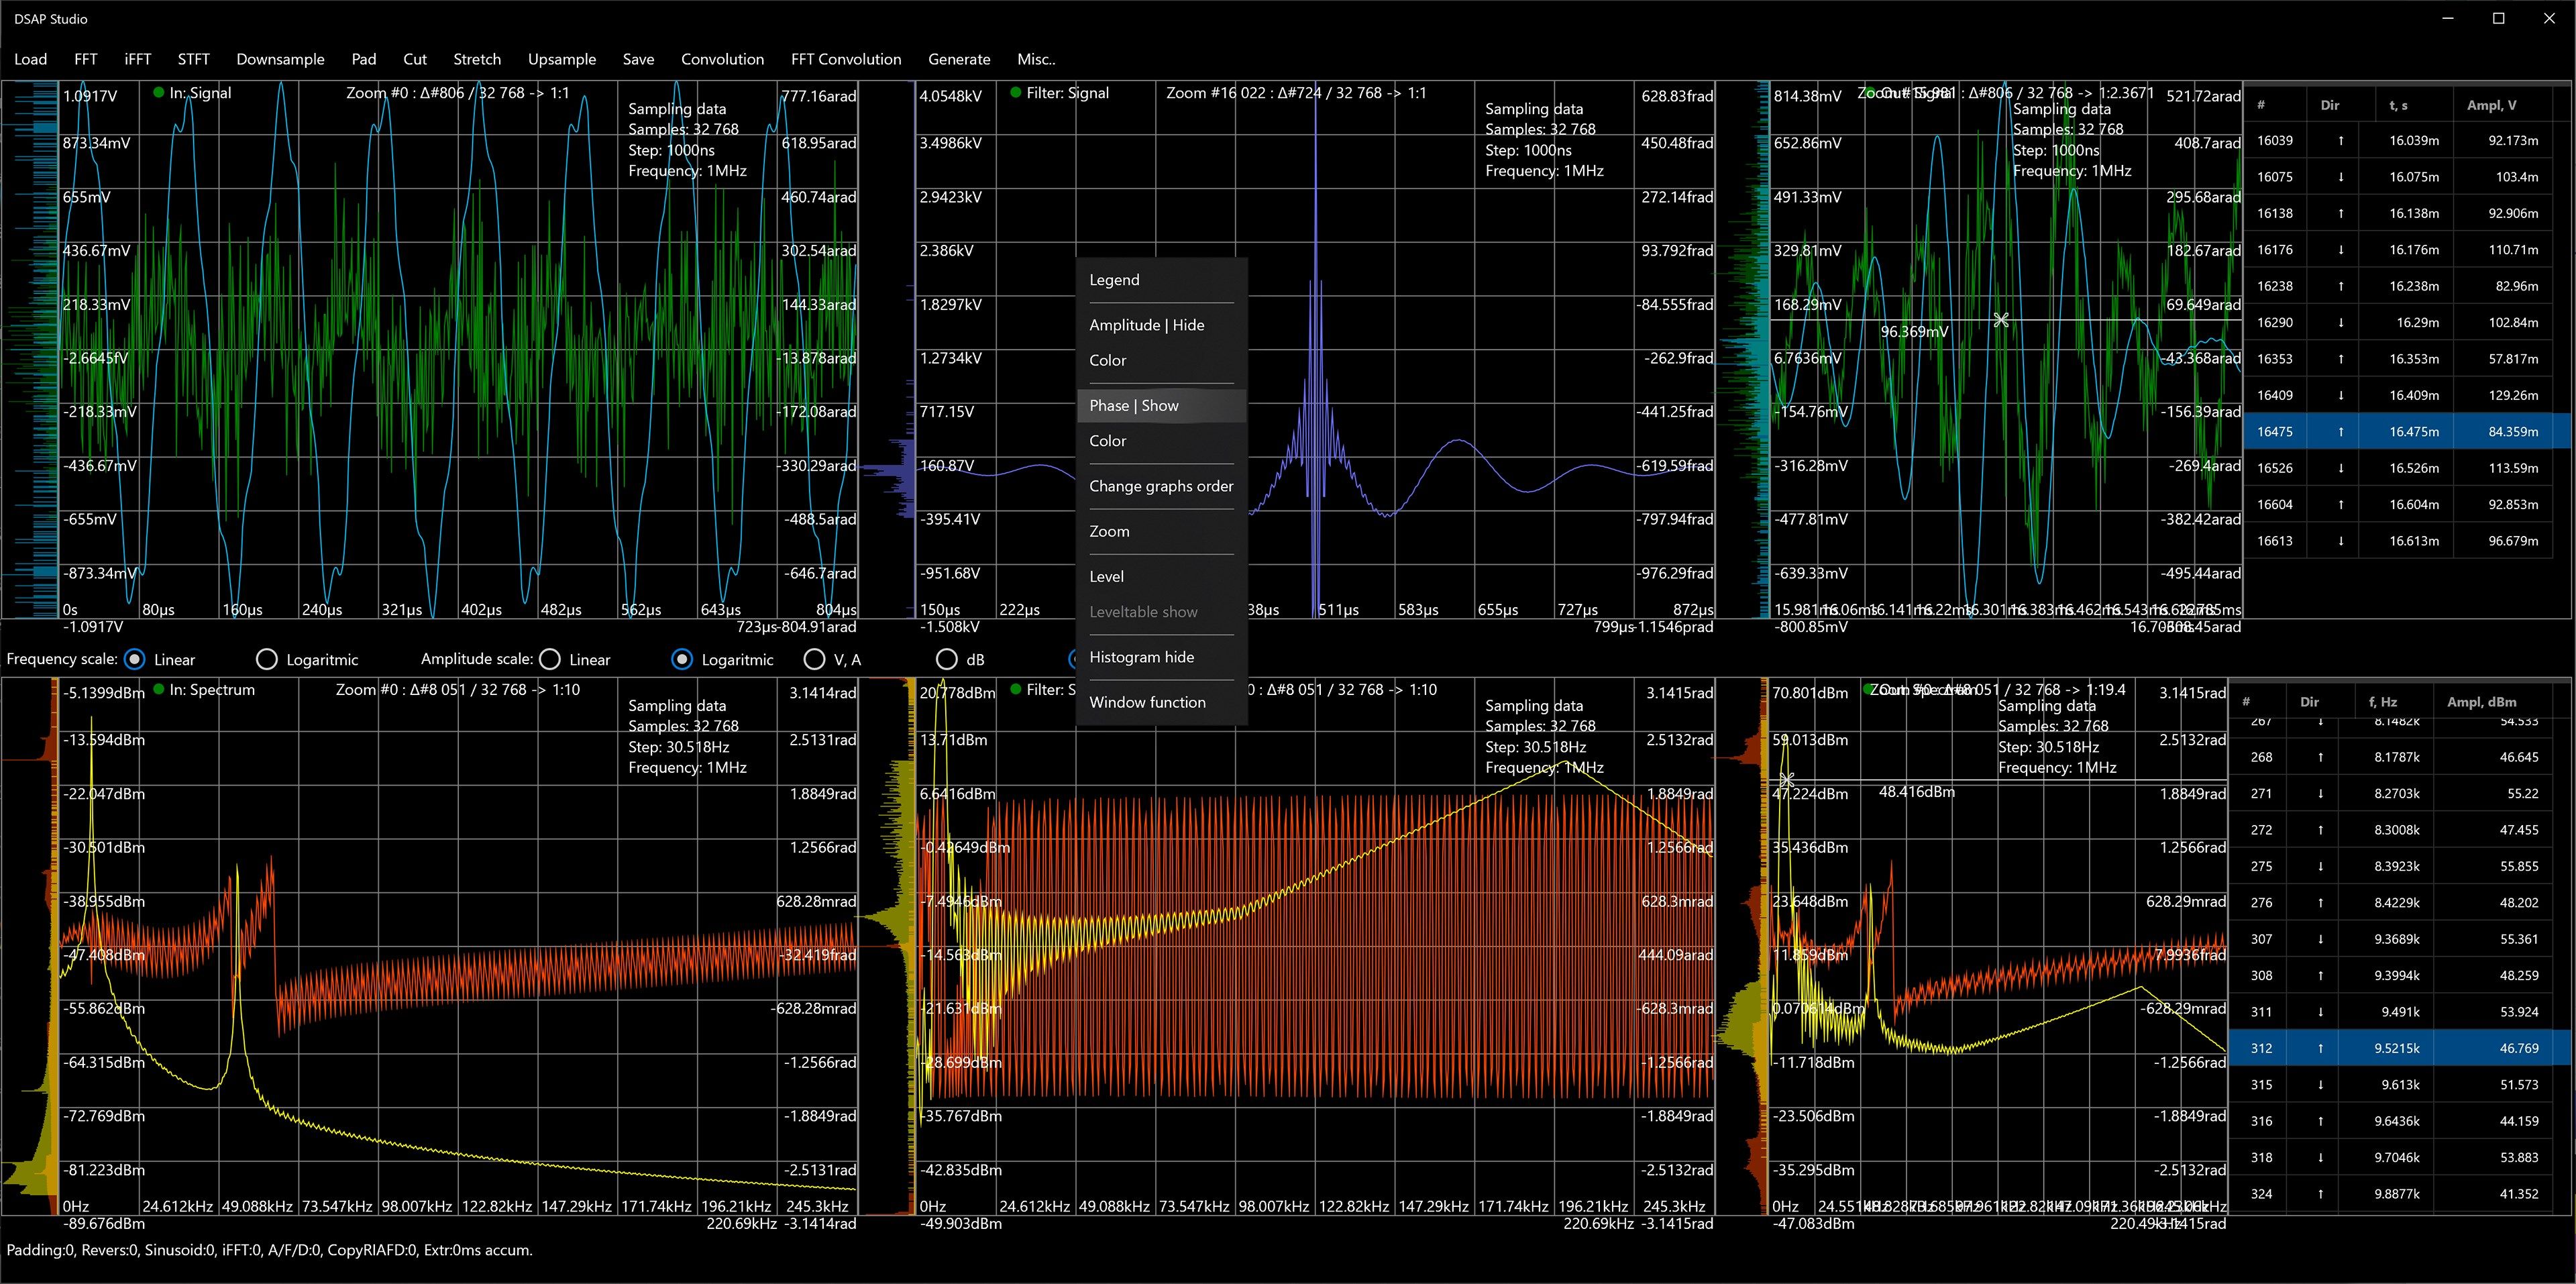
Histogram is available (show/hide using context flyout menu.
Window functions can be used, in trial version only Hamming, in full version rectangular, triangular, Hamming, Blackman, Hann, Flat-Top, Welch window functions.
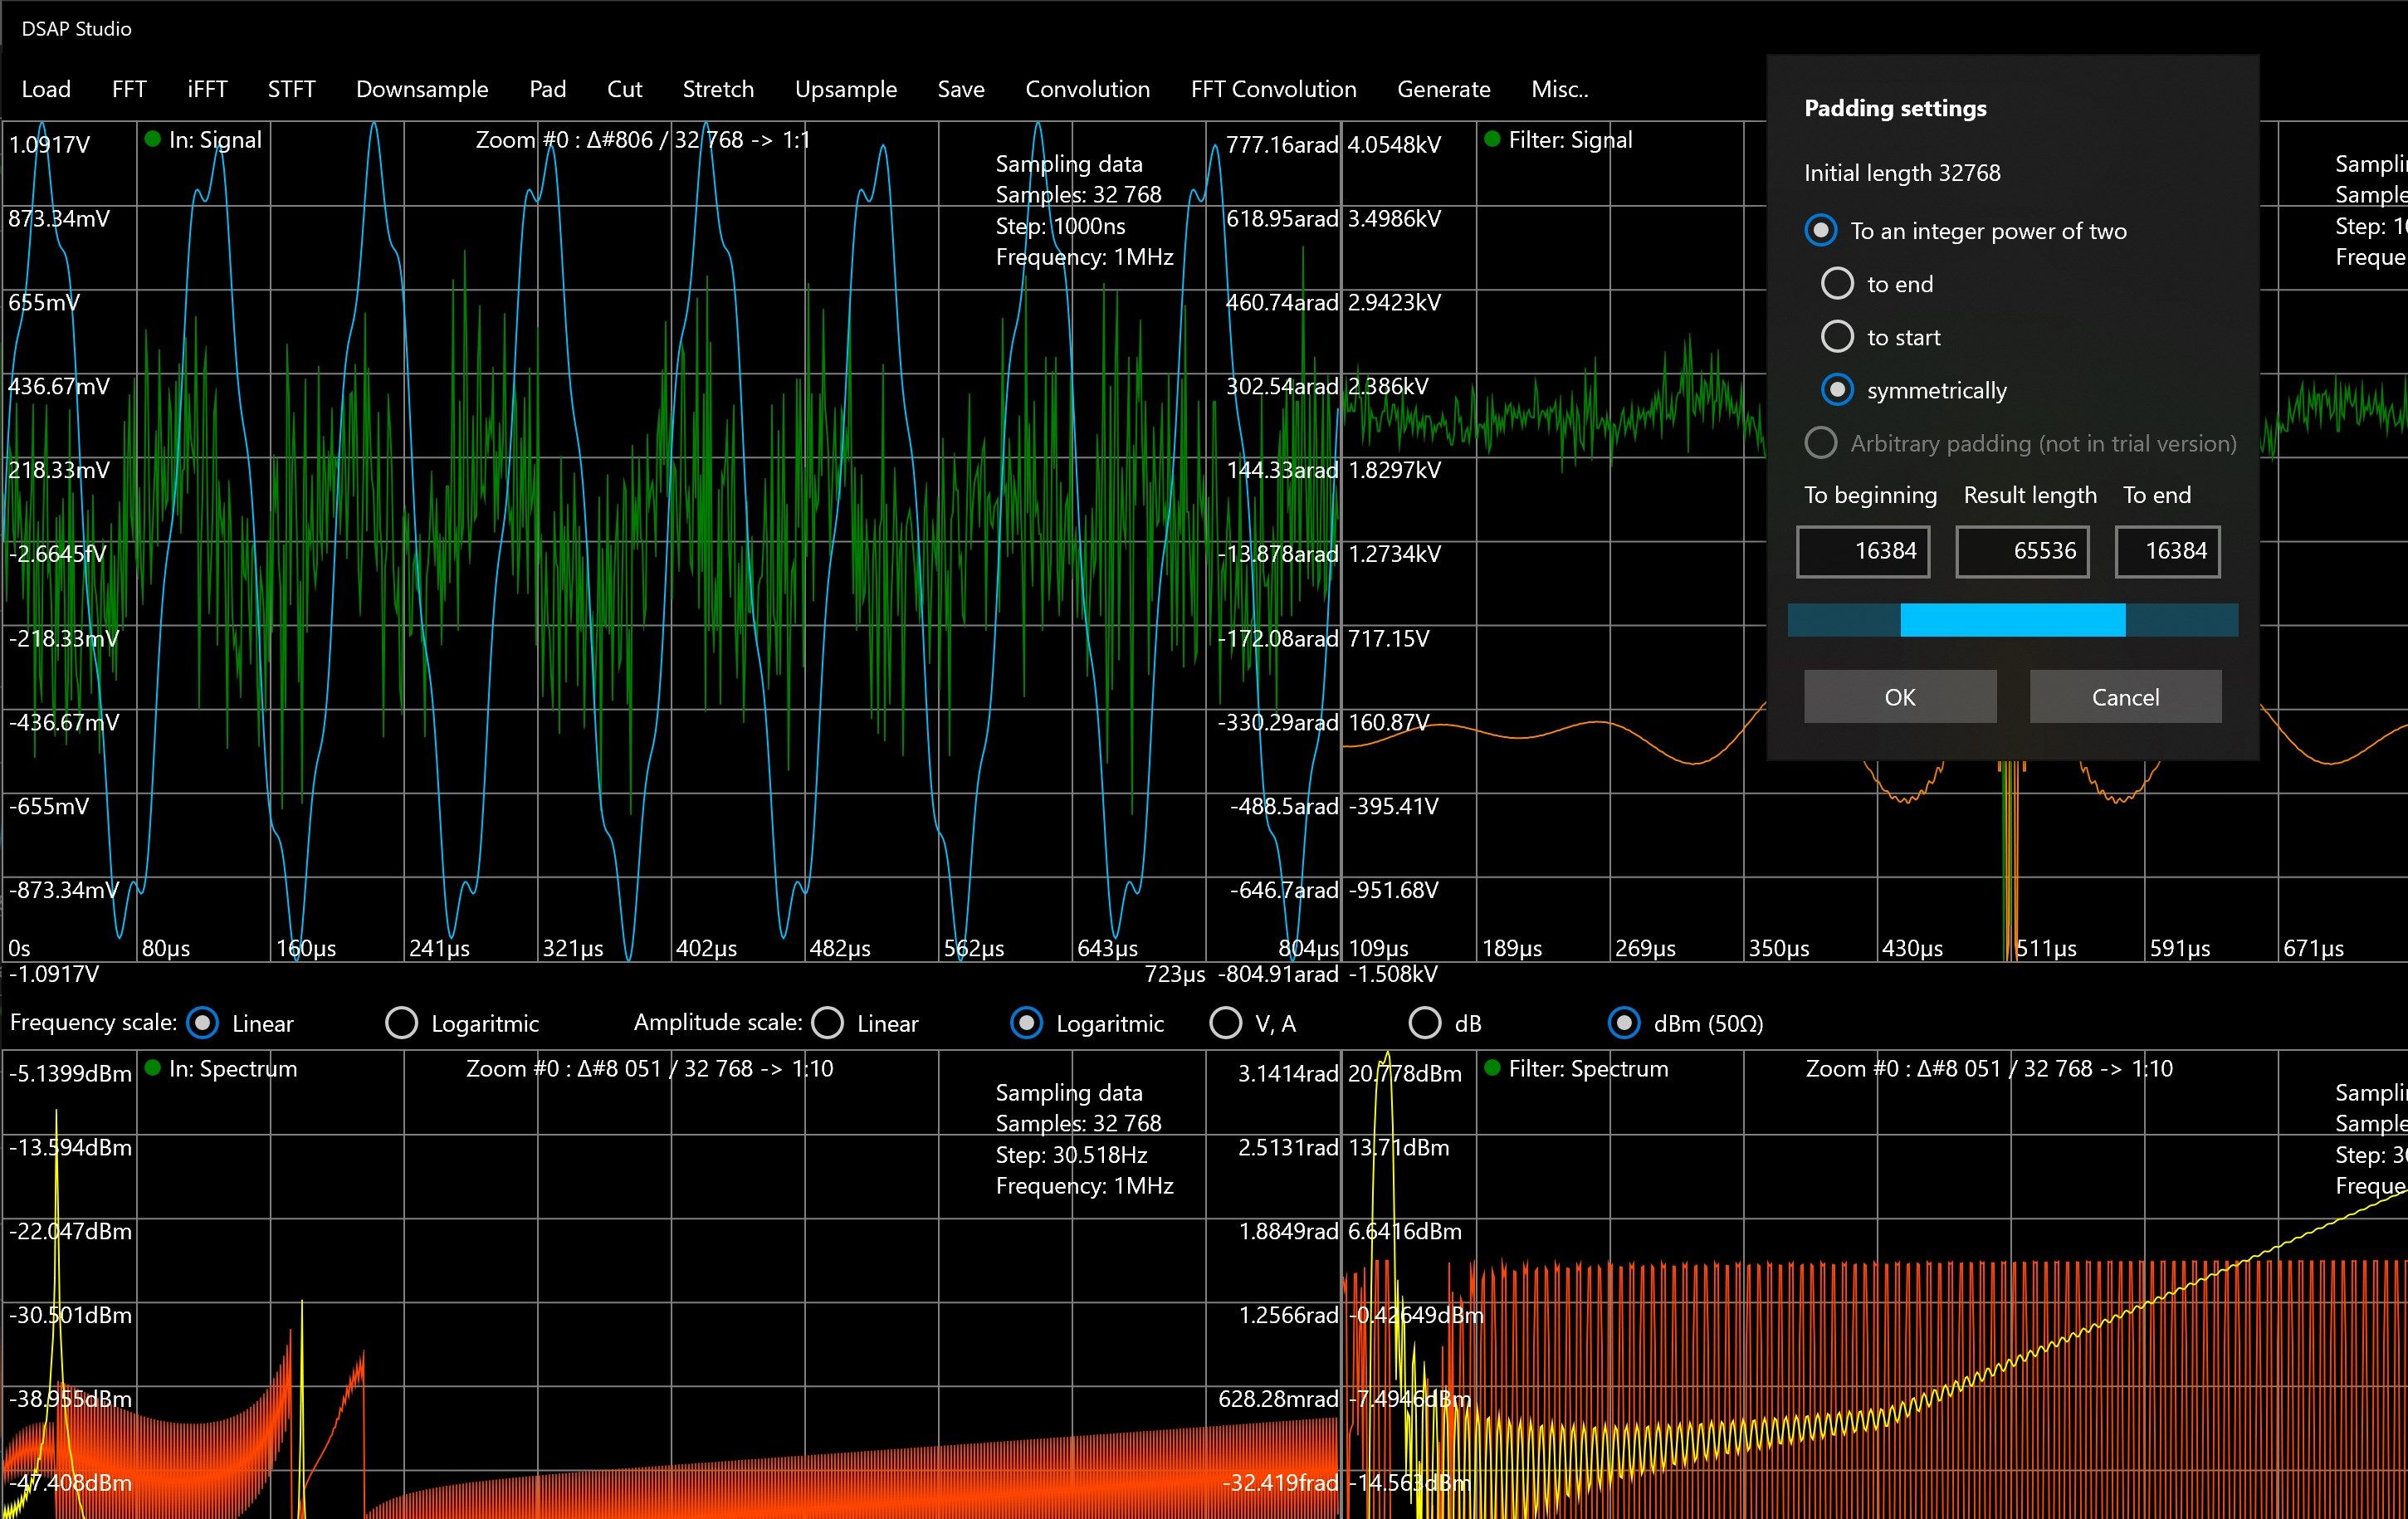
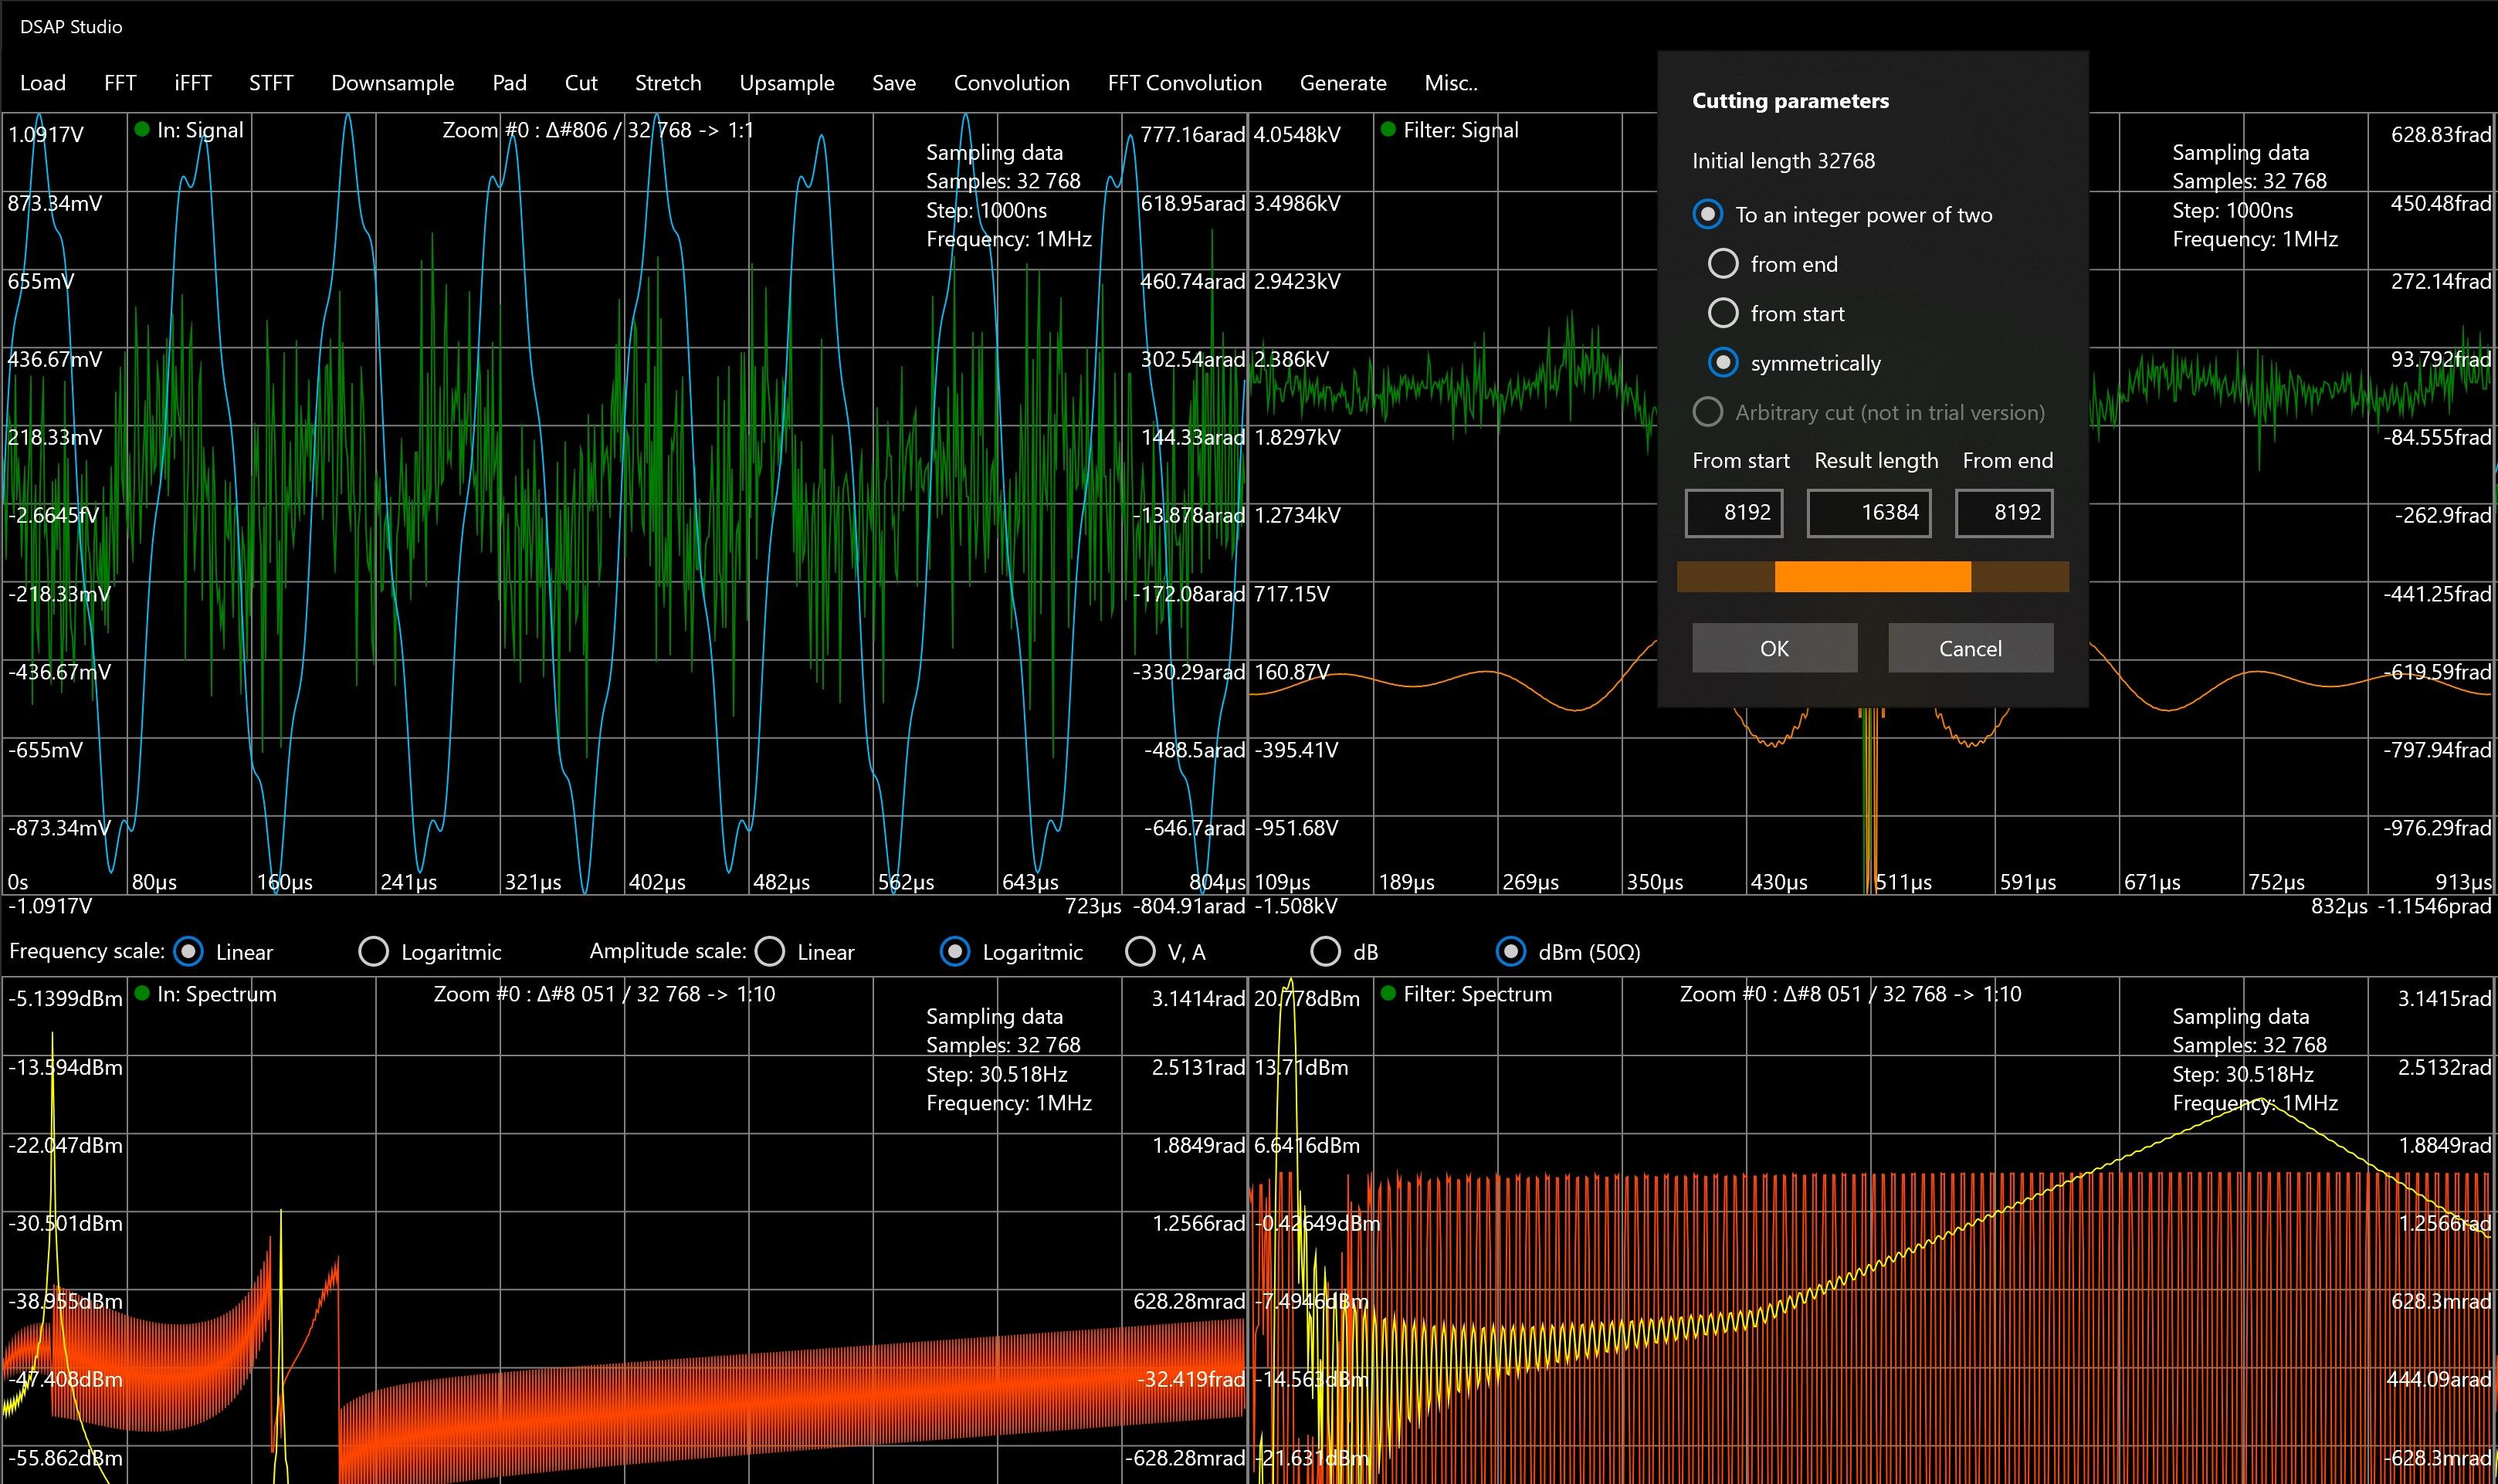
For signal and filter response signal cutting and padding there are options to free setting or by integer power of two (end, start, both sides).
When spectrum is shown in logarithmic format the scales are in logarithmic (decade or octave) form too.
Previous changes:
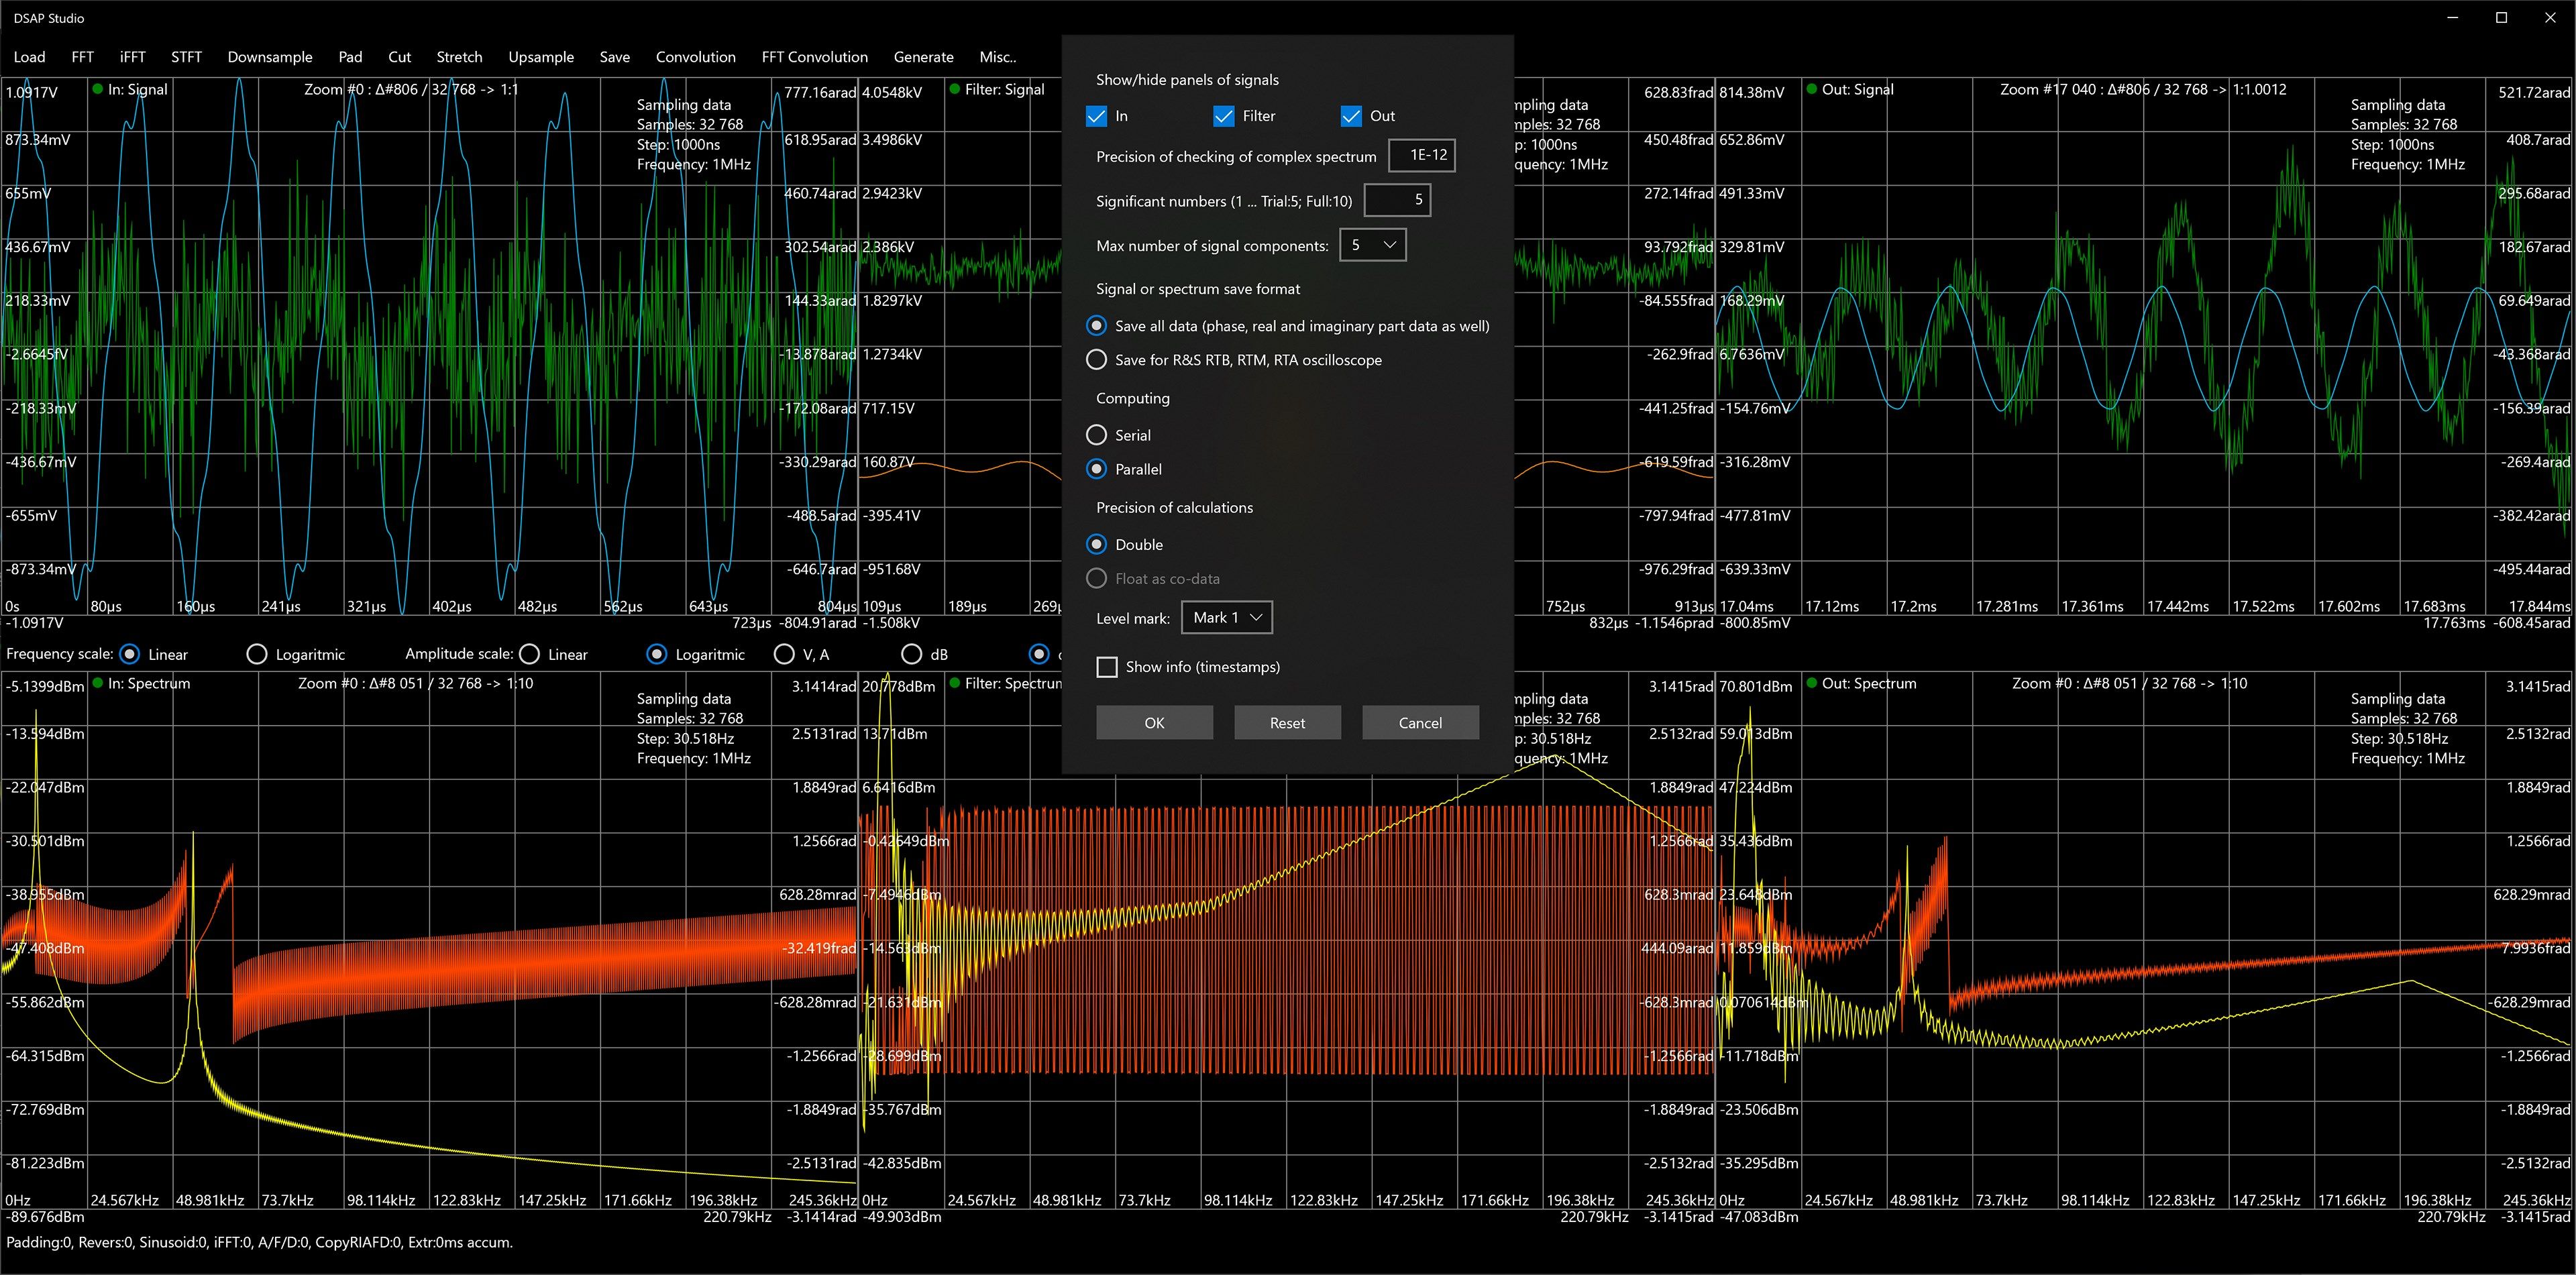
- Parallel computing for FFT, inverse FFT, convolution and FFT convolution,
- User can select parallel or serial computing,
- Zoom from left or middle added to graphs flyout menu (removed, zooming has been changed),
- Zoom 1:2 added to graphs flyout menu (removed, zooming has been changed),
- Reset button added to signal ja filter generator forms,
- Saving user settings,
- Reset to default settings,
- Added Tips form,
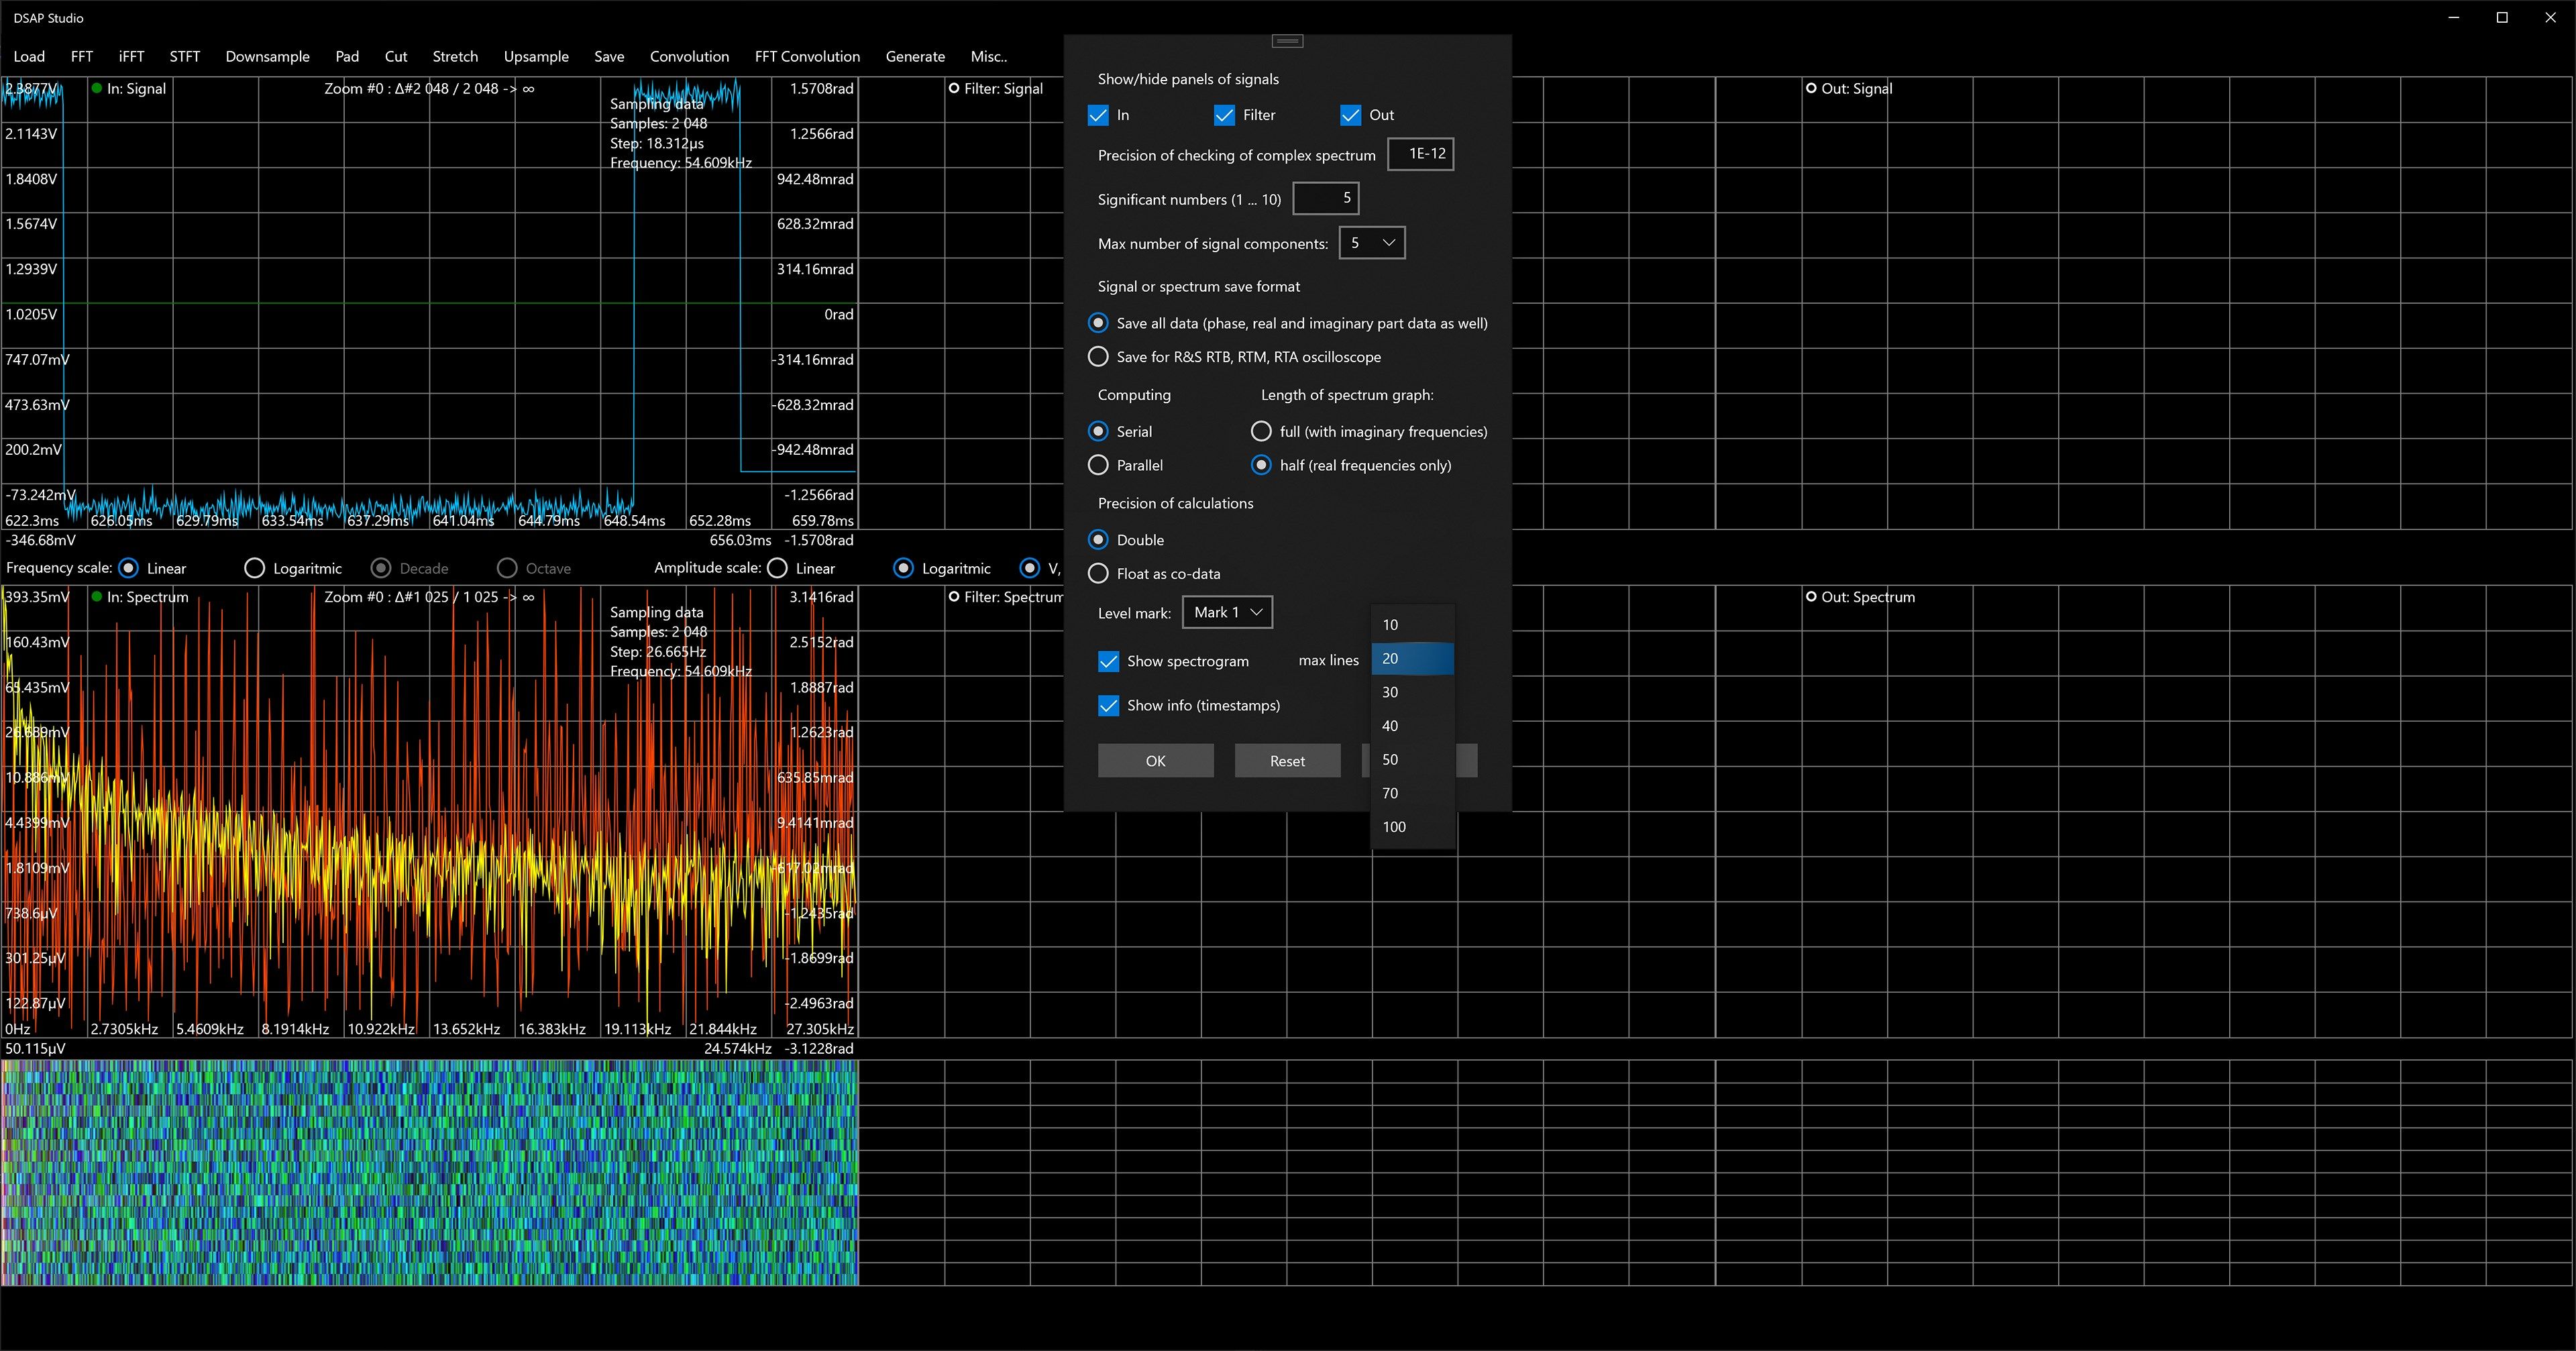
- Option in Settings to save all the data or for oscilloscope,
- Option to save as .csv file,
- Save filter data as filter coefficients only,
- Multiple instances of DSAP Studio app can run,
- Symmetrical padding of input signal,
- Symmetrical padding of filter response signal,
- Cutting of input signal,
- Cutting of filter response signal,
- Symmetrical cutting of input signal,
- Symmetrical cutting of filter response signal,
- Generate filter response spectrum moved to Generate menu,
- Generating of input signal (multicomponent),
- Windows of Input, Filter response and Output can be switched on/off,
- Settings: number of significant numbers can be adjusted,
- Settings: max number of signal components can be adjusted,
- dBm scale in vertical scale,
- Removed limitations on file size,
- Large integers presentation,
- Status info to signal and spectrum import,
- Status info to signal and spectrum saving,
- Load output signal,
- Load output spectrum,
- FFT of output signal,
- inverse FFT of output signal,
- Pad filter response signal,
- Stretch input signal,
- Save filter response signal,
- Save filter response spectrum,
- Save output signal,
- Save output spectrum,
- Free trial possible,
- Check for updates,
- Calculations and save data in single (float) precision also (in Full version only), default is double precision,
- User can change draw order of graphs,
- User can change number of significant numbers between 1…5 in trial, 1…10 in full version,
- Graphs can be zoomed by mouse wheel or via context menu,
- The arbitrary filter is usable now with multiple freely settable frequency and attenuation values,
- Improved reaction to vertical size change, vertical size of graphs changes according to main window size,
- Can read other signal and spectrum data when set first row position and column data positions, units and multipliers,
- Reading out current unit (A),
- A signal or spectrum amplitude level can be set and analyze transient samples,
- Histograms of signal and spectrum graphs,
- Window functions, in trial version only Hamming, in full version rectangular, triangular, Hamming, Blackman, Hann, Flat-Top, Welch window functions,
- Short-time Fourier transform (STFT or STFFT),
- Added options to signal and filter response signal cutting and padding,
- Spectrum frequency scales in logarithmic form (decade or octave),
- Spectrogram (not available in trial),
- Show spectrum real part only is possible (full or half spectrum).
-
Modeling of digital signal processing.
-
Application of digital filter to input signal.
-
Export of filter coefficients.
-
FFT.
-
STFT.
-
FFT convolution.
-
Logarithmic spectrum and scales.
-
Spectrogram.