
Description
This app will not run on Windows 10S or Windows running on an x86 architecture.
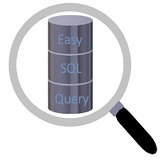
This app allows users who run SQL queries to do so using a graphical interface. SQL authentication is enforced. The user can query any table and view they have rights to.
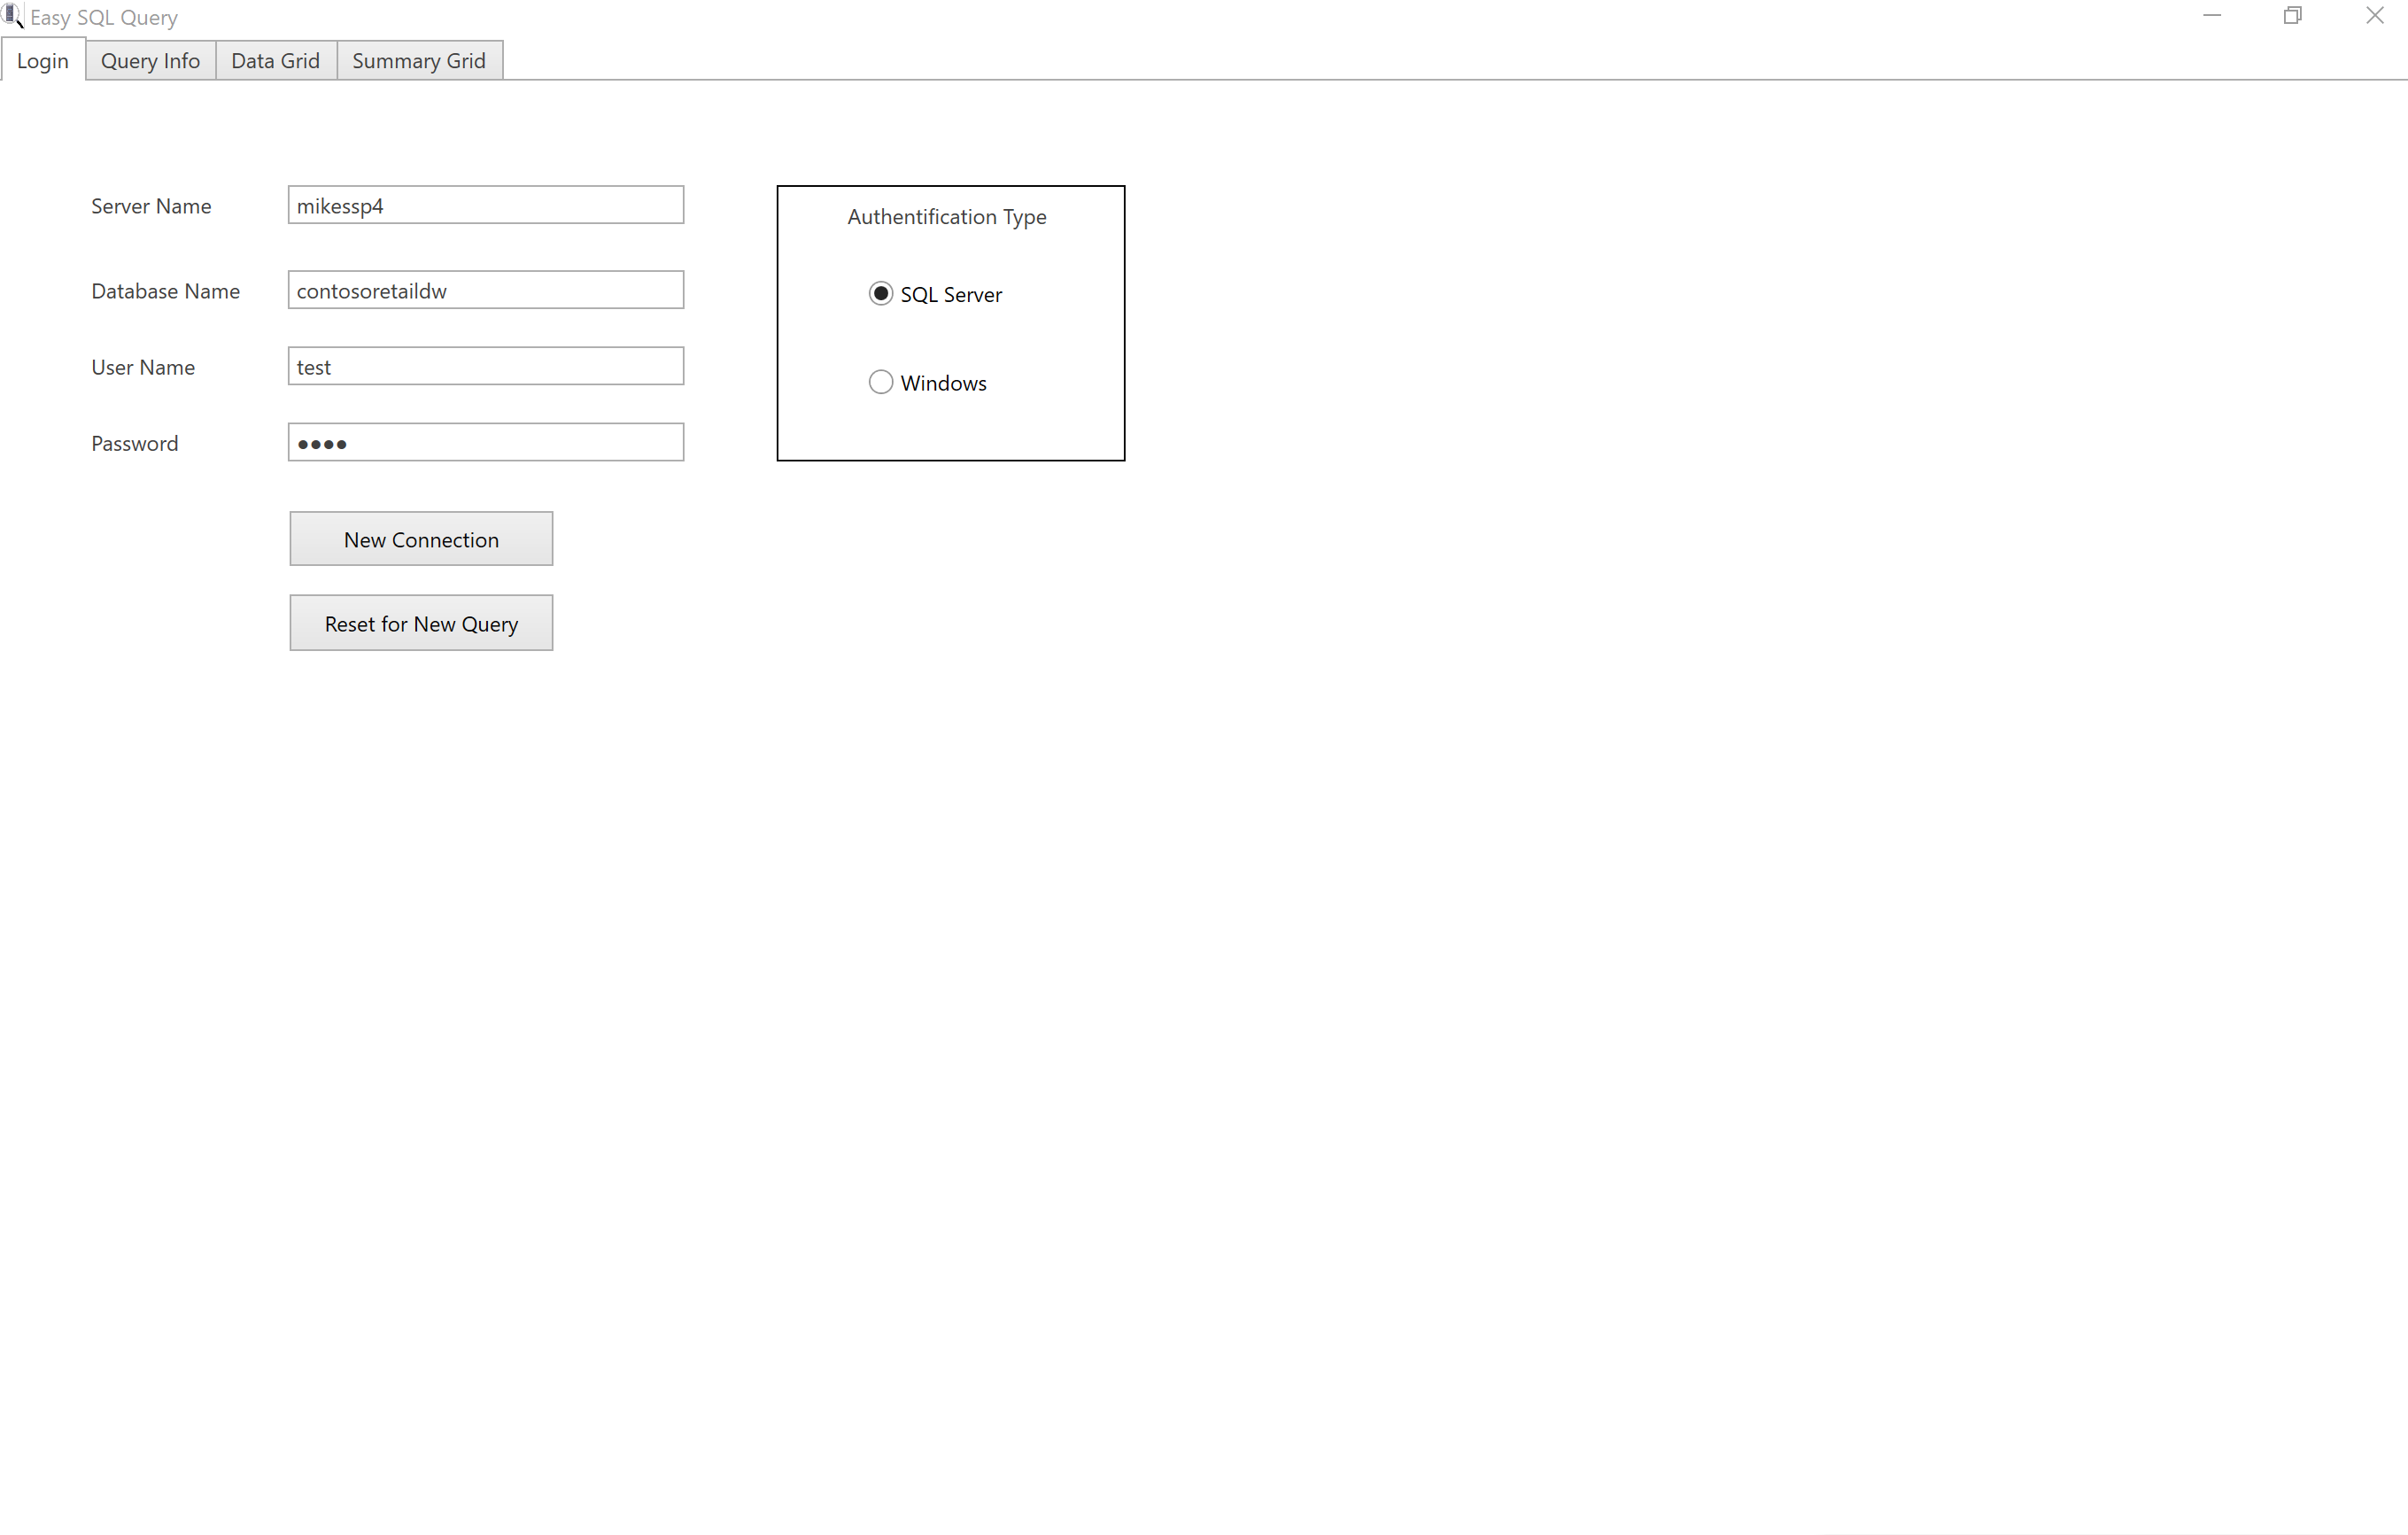
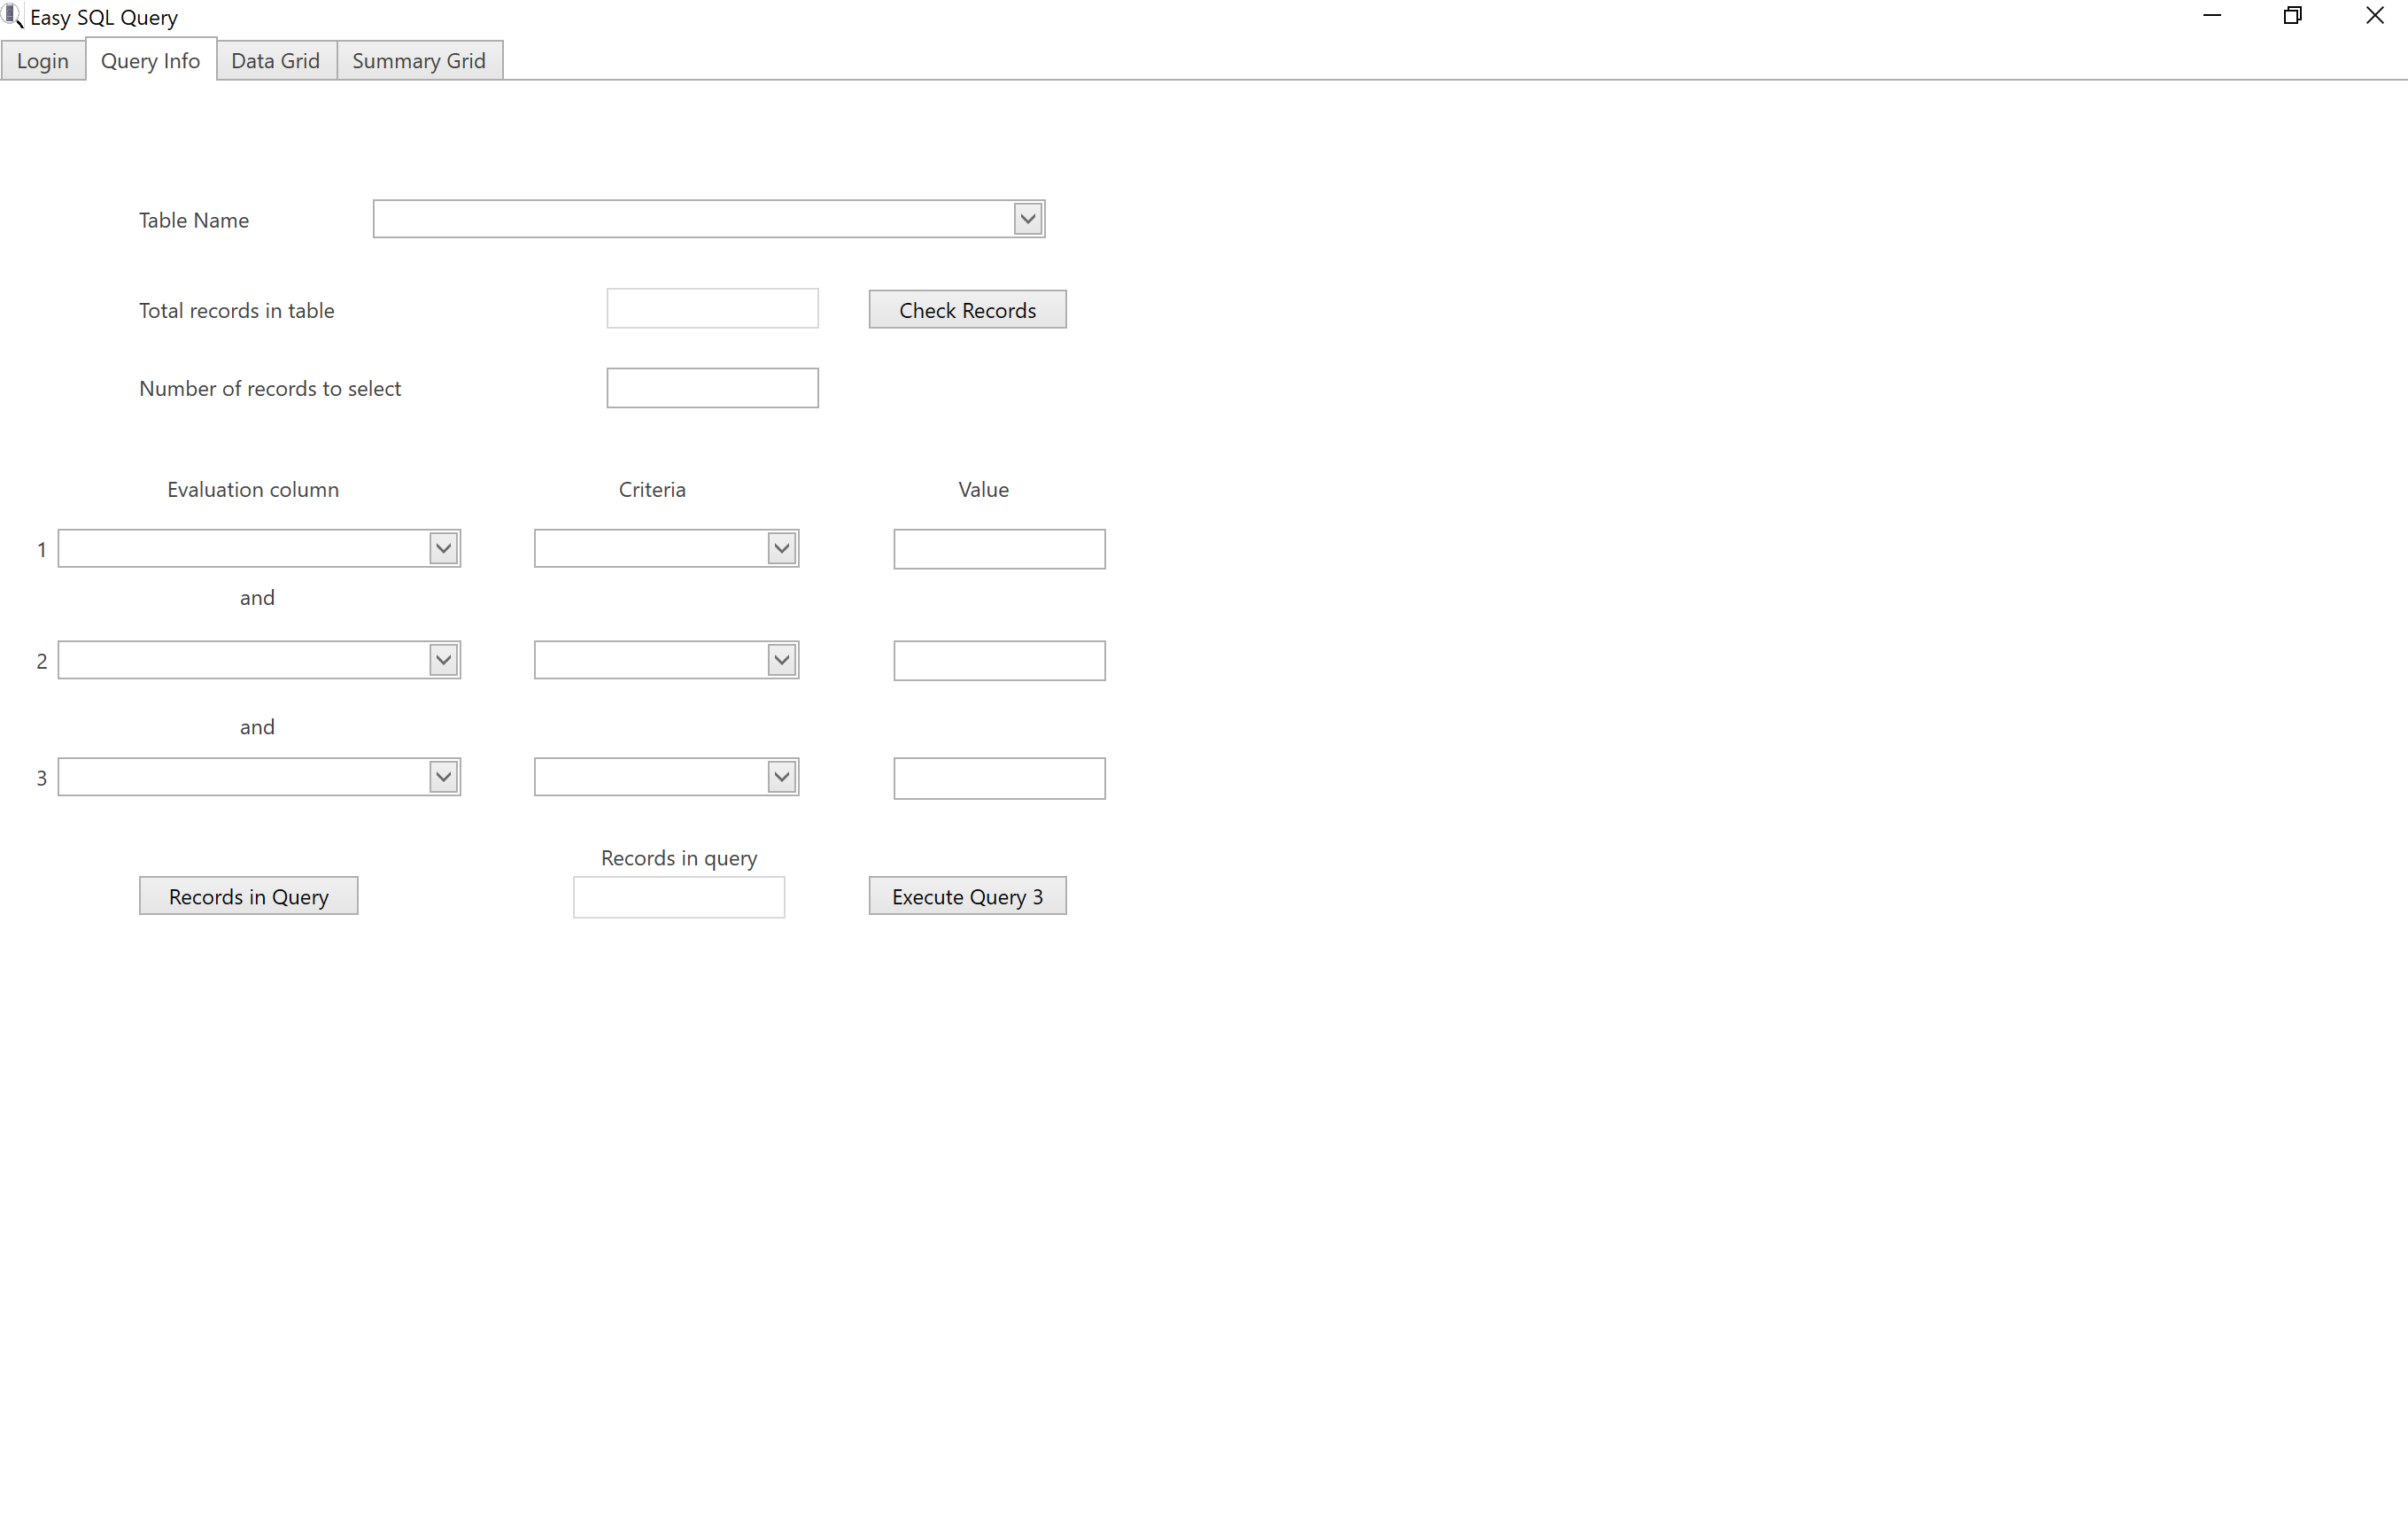
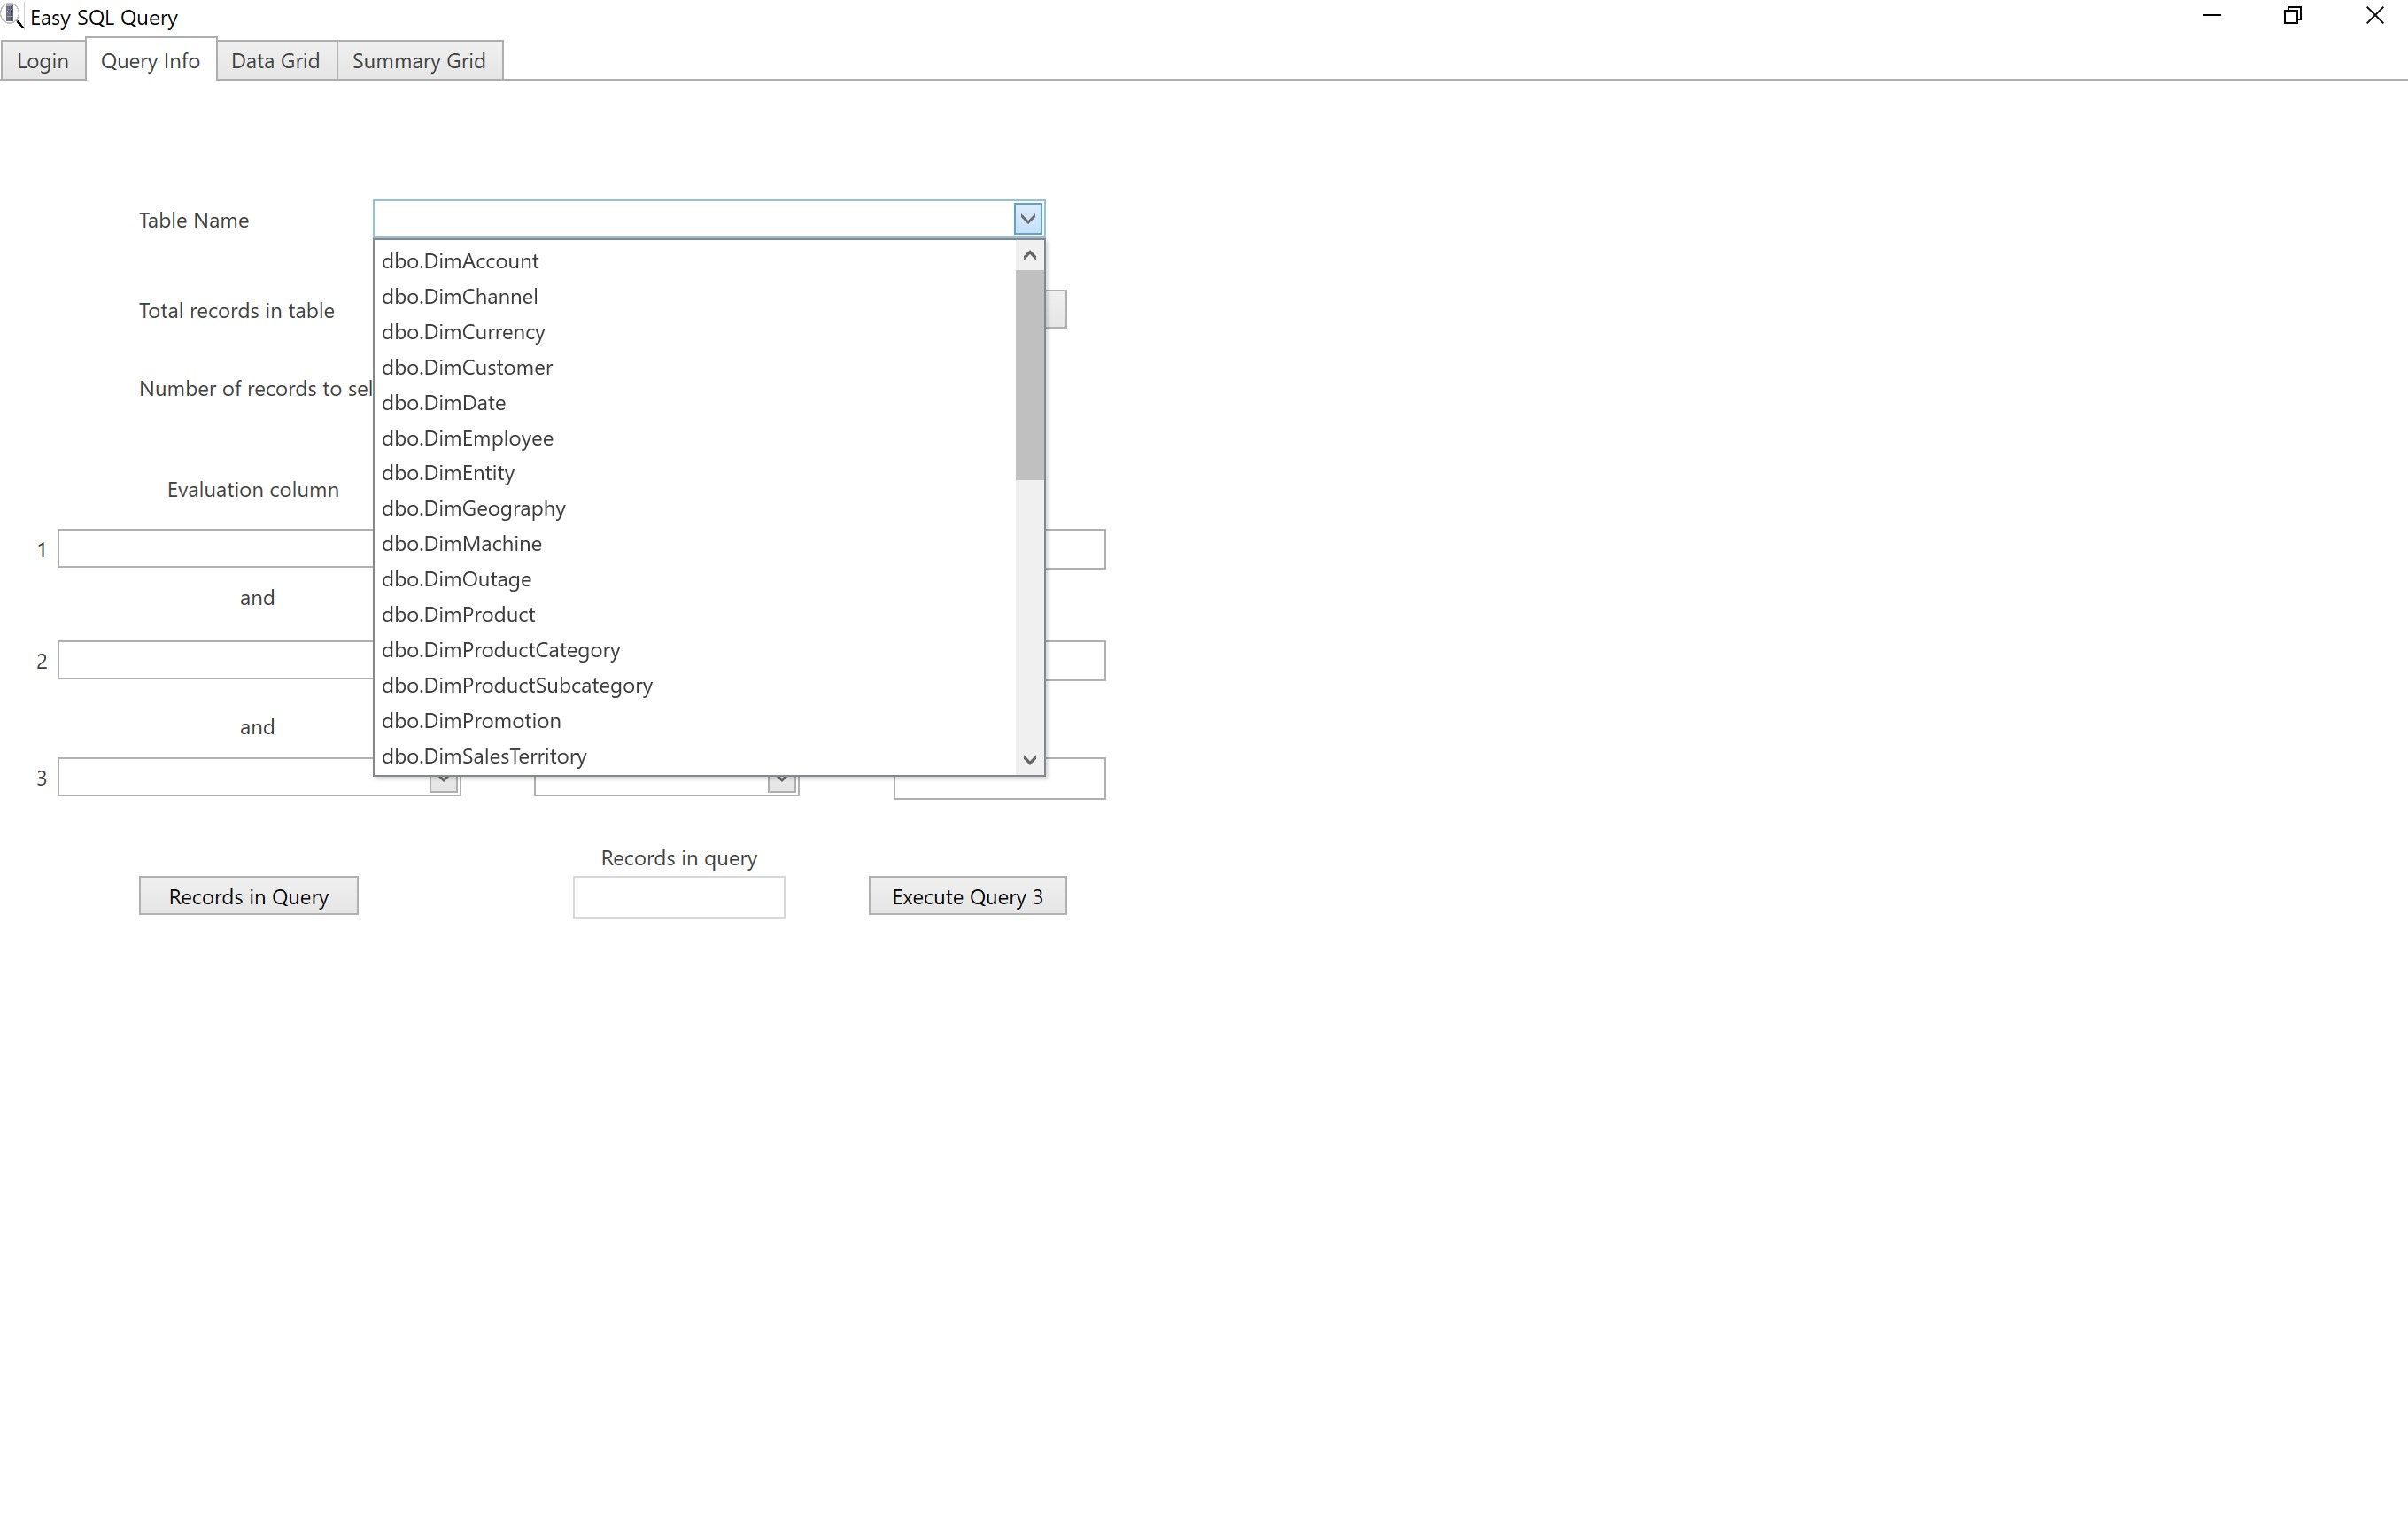
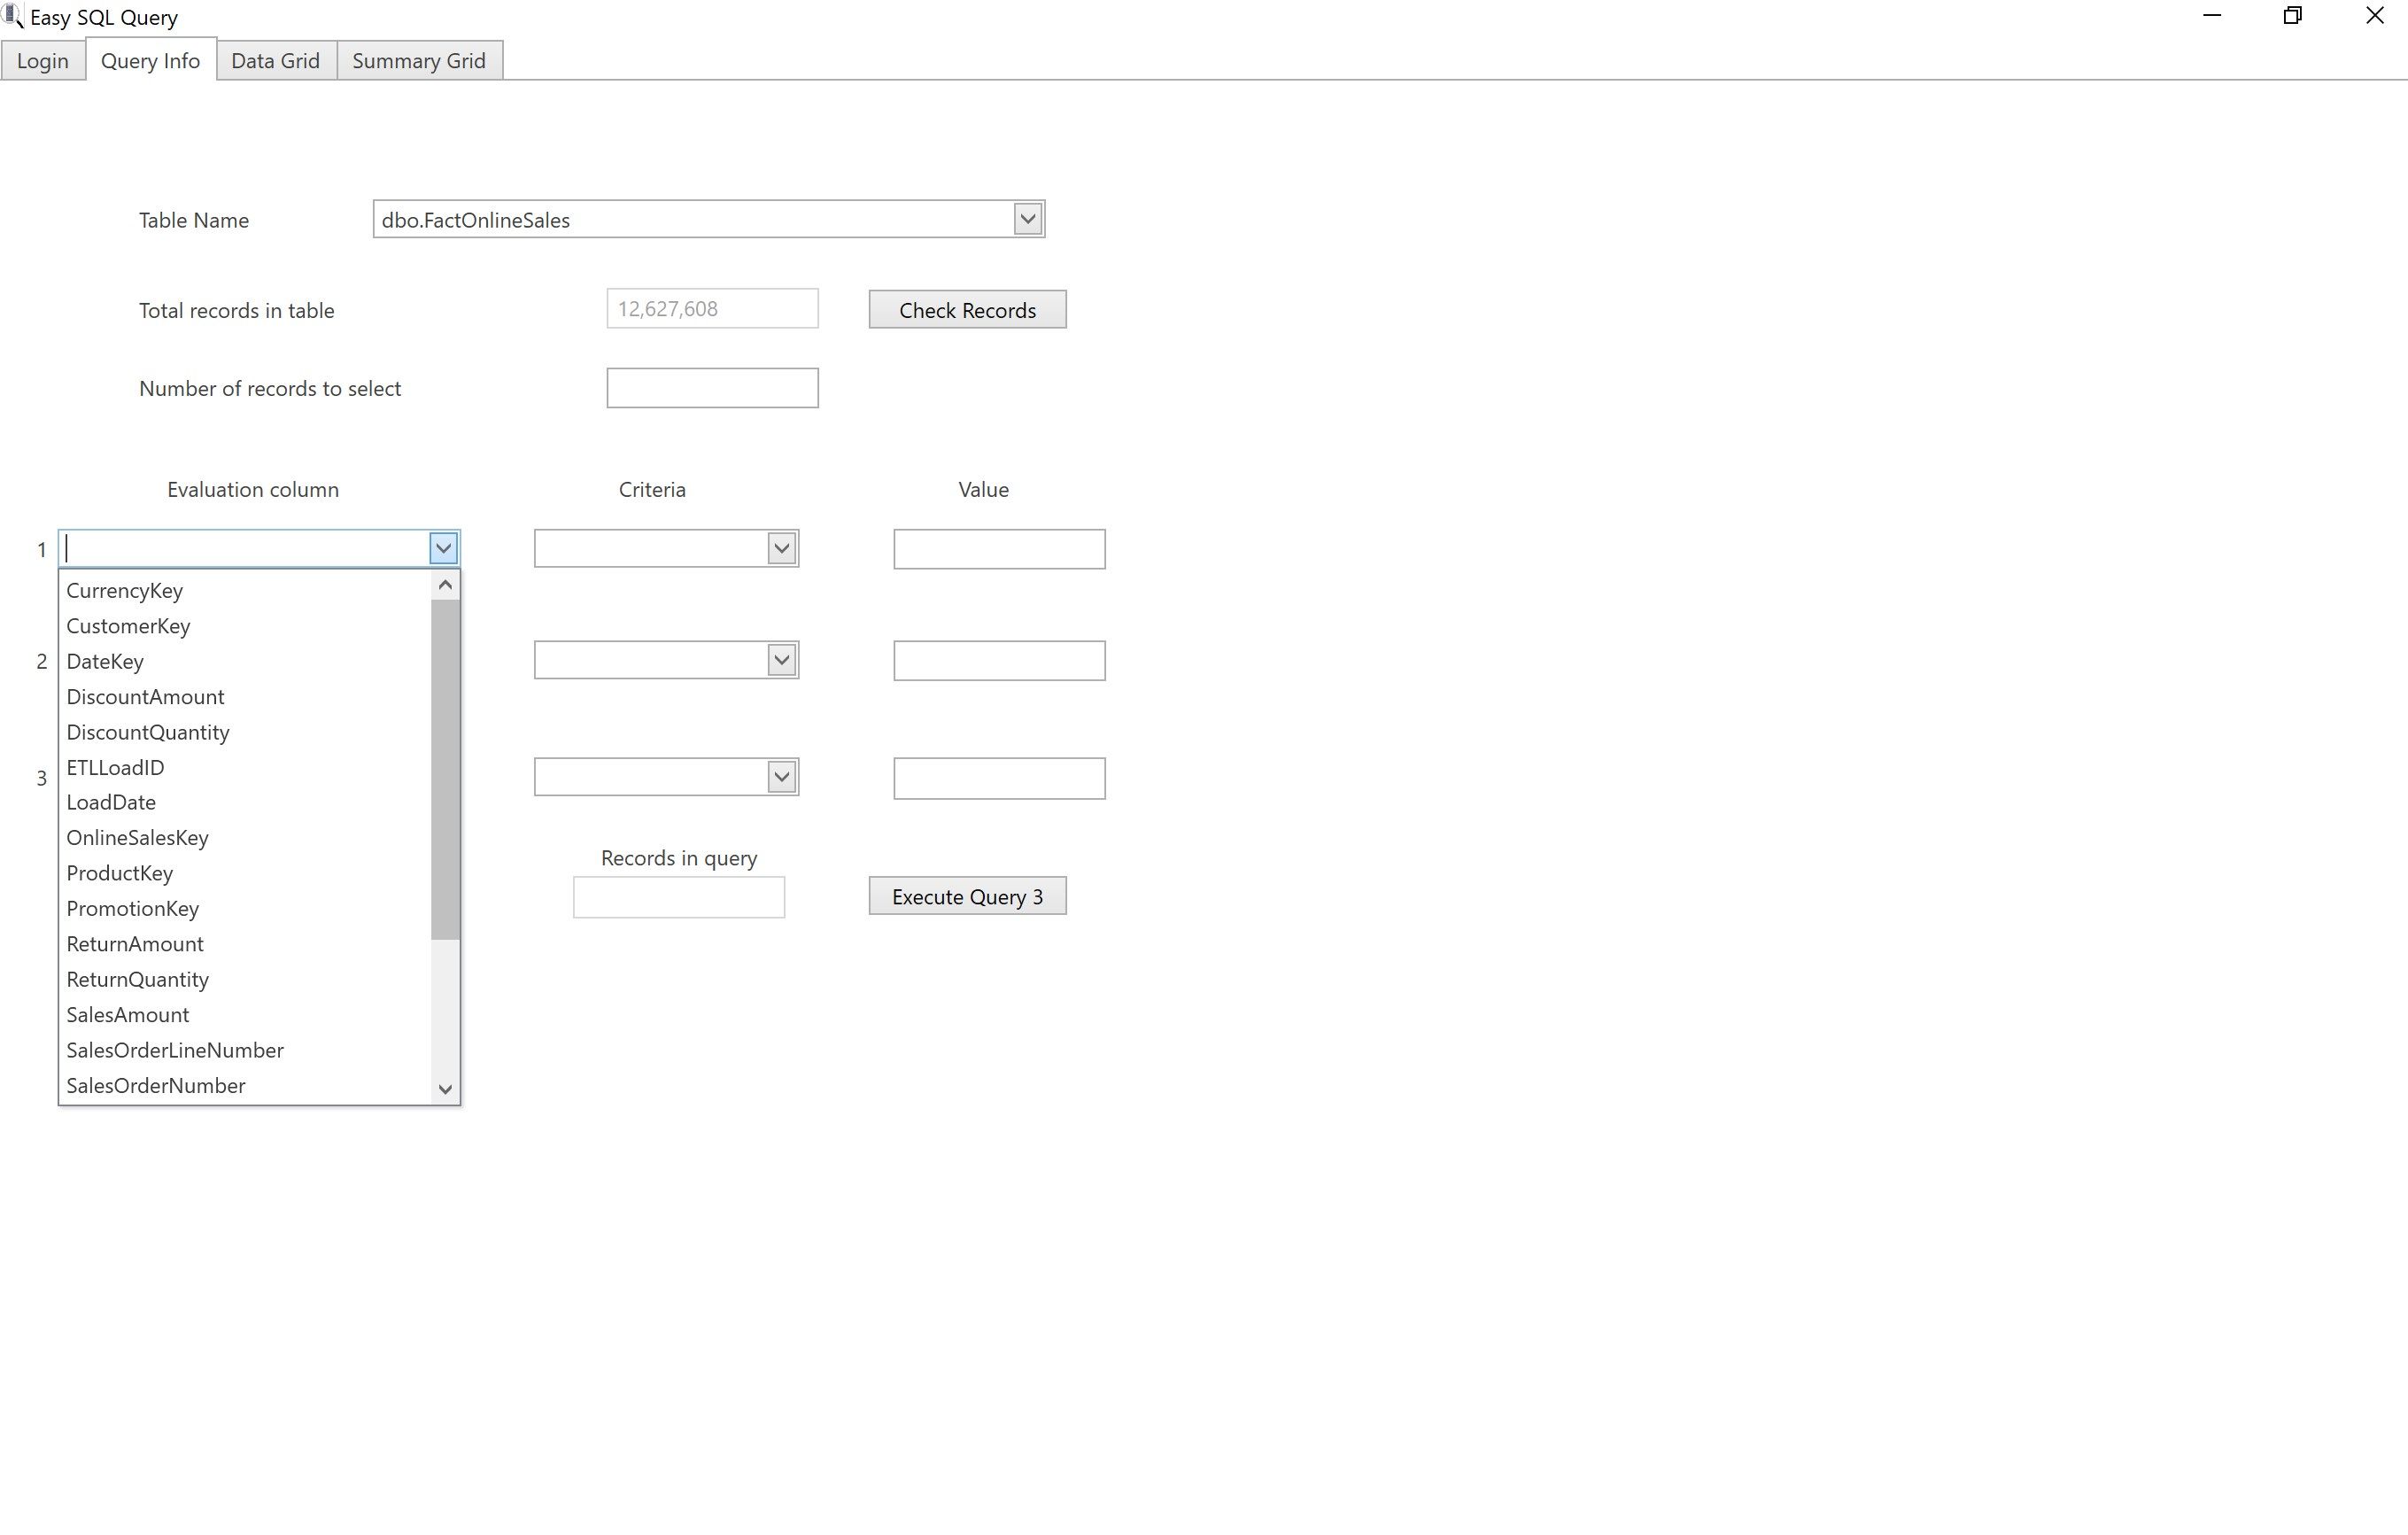
The driving purpose of this app is to allow the user to select the records needed for analysis through the use of pre-populated drop down for tables and column. Filtering criteria is applied up to three columns. The app can be used to determine how many records are in a table before the query executes as well as the number of records a filter will return. The user can specify the number of records to be returned for a query in concert with the application of filters.
Once the records are returned, the user has two additional modules to use for additional analysis.
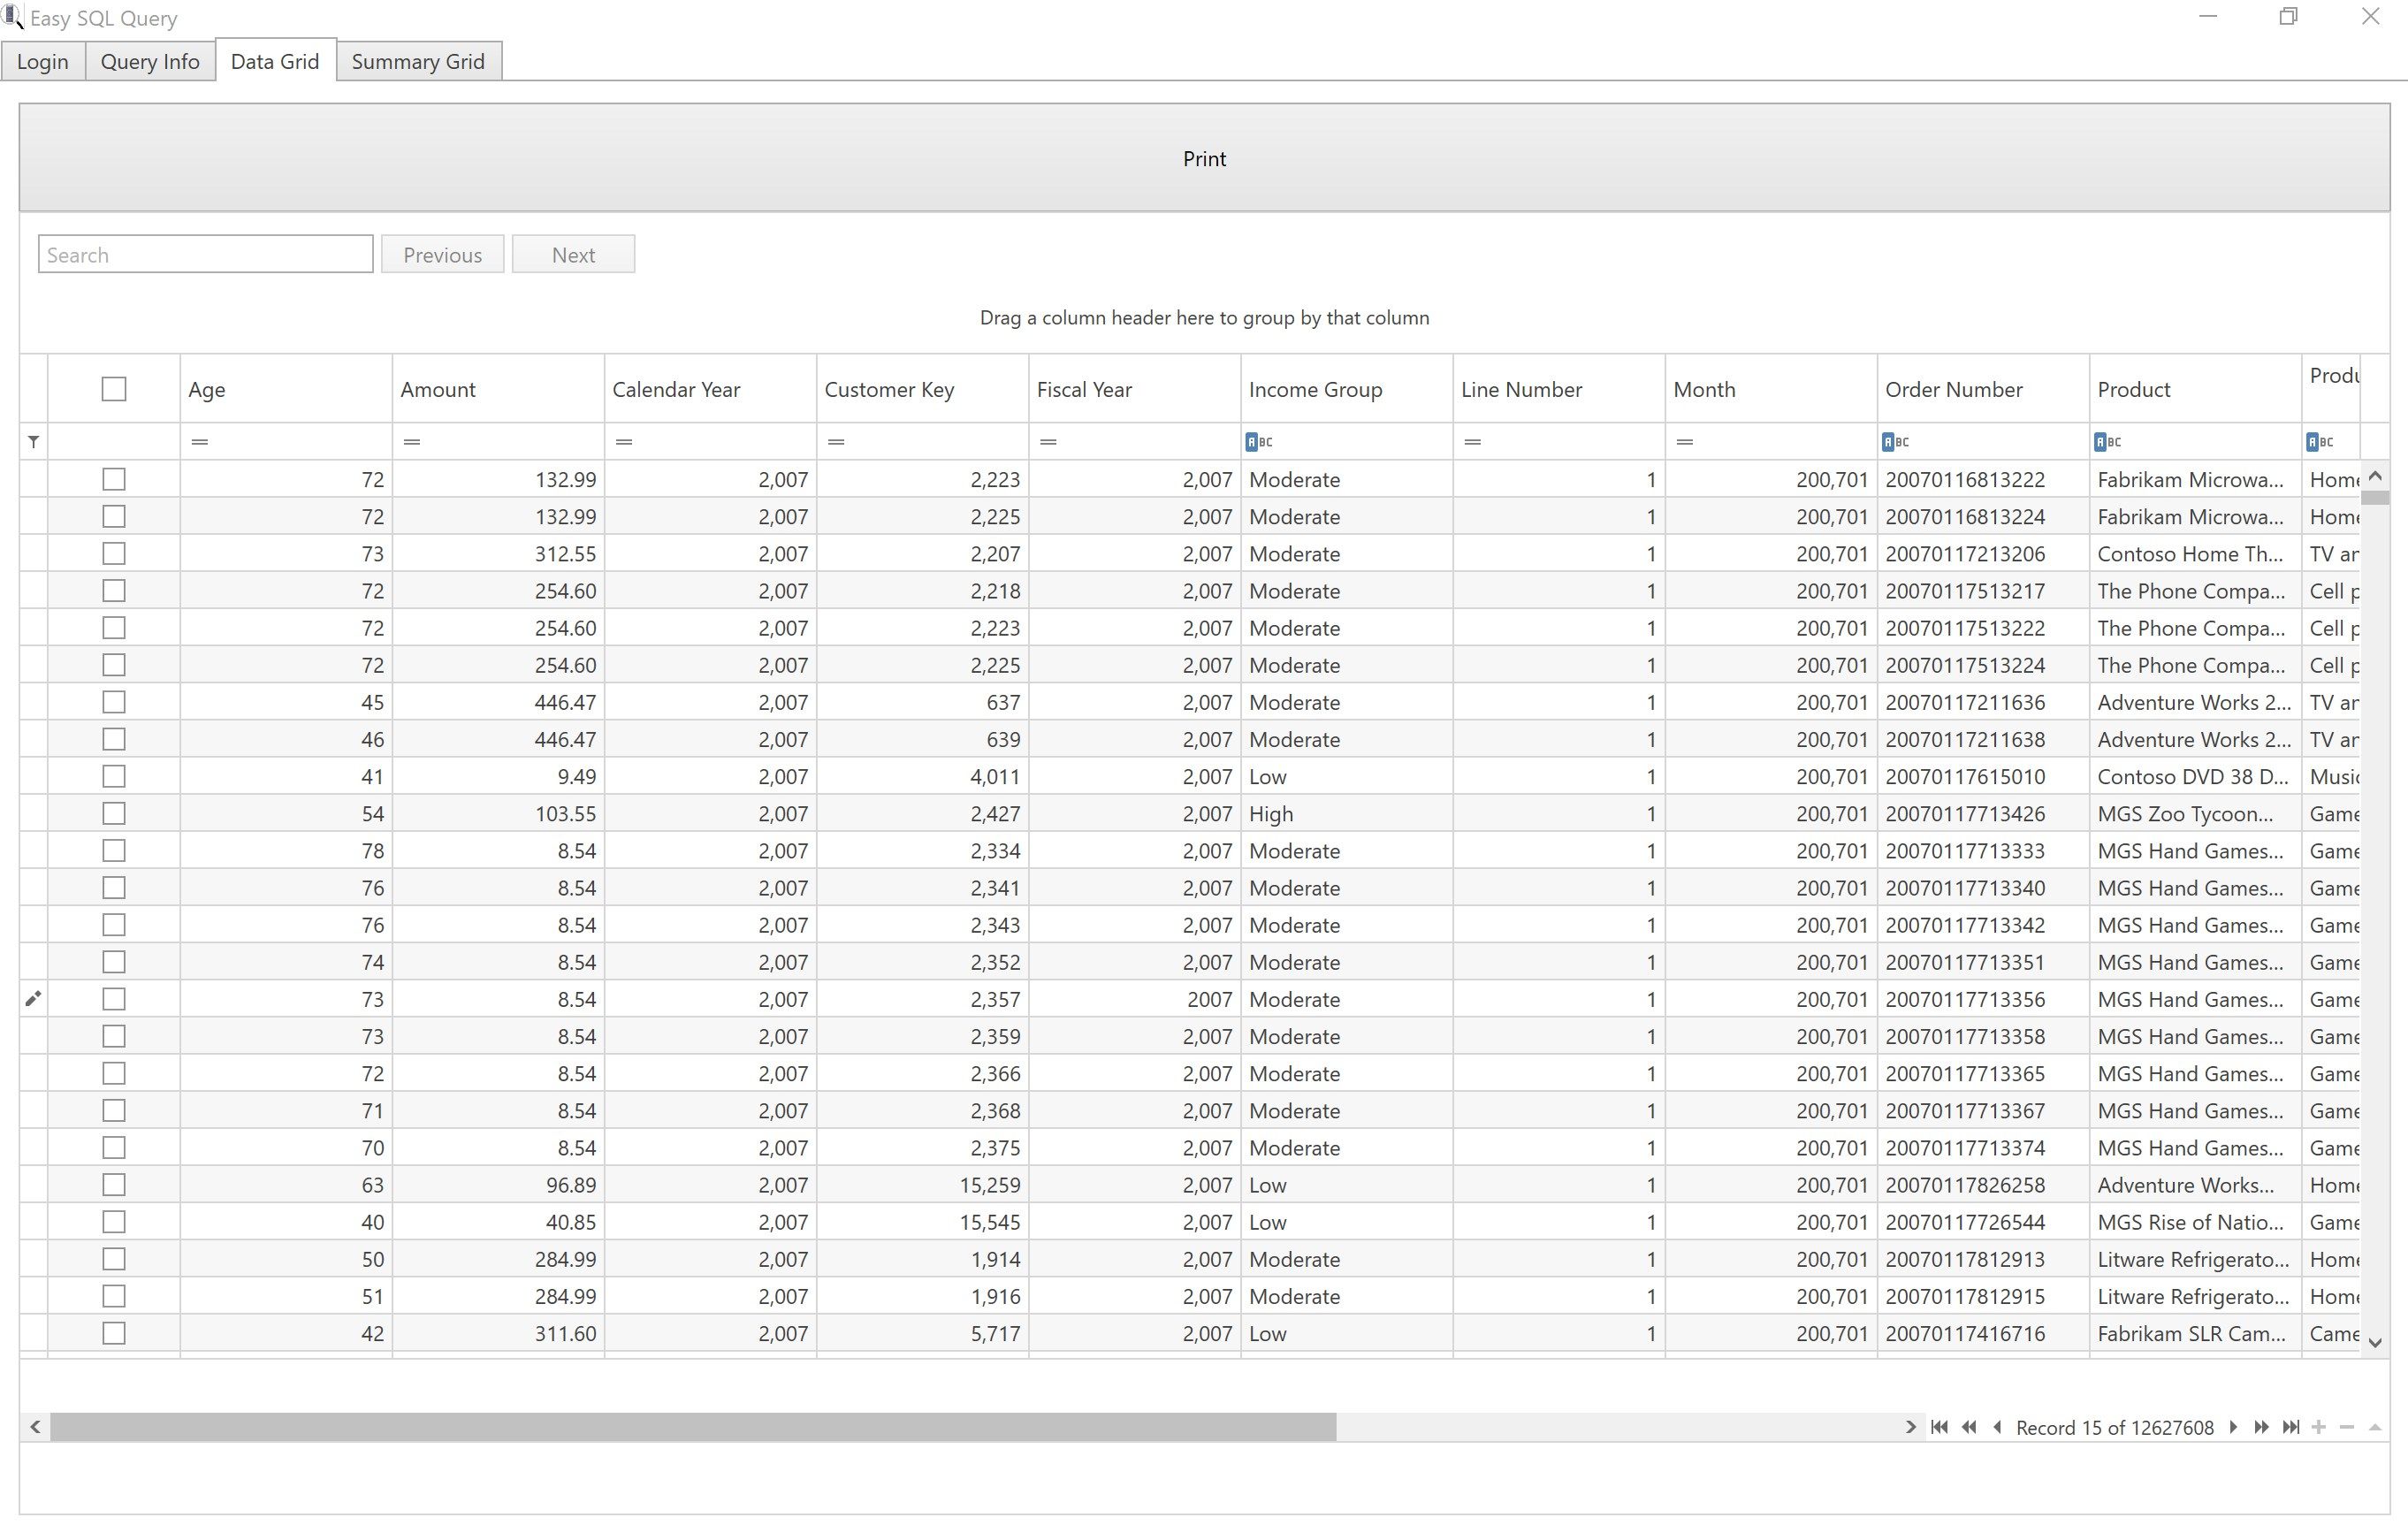
The first is the data table. The data table allows additional grouping, filtering, sorting and aggregation functions. Columns may be rearranged by dragging the column to the position desired. Columns that are not wanted can be hidden. Conditional formmatting can be applied to any column based on user defined rules. Global searches can be performed over the entire table simultaneoulsy, which will return only rows that contain the search value no matter which column contains the value.
Reports can be printed or exported to Excel, PDF, Word and other formats. Reports can be emailed directly from the application for easy distribution
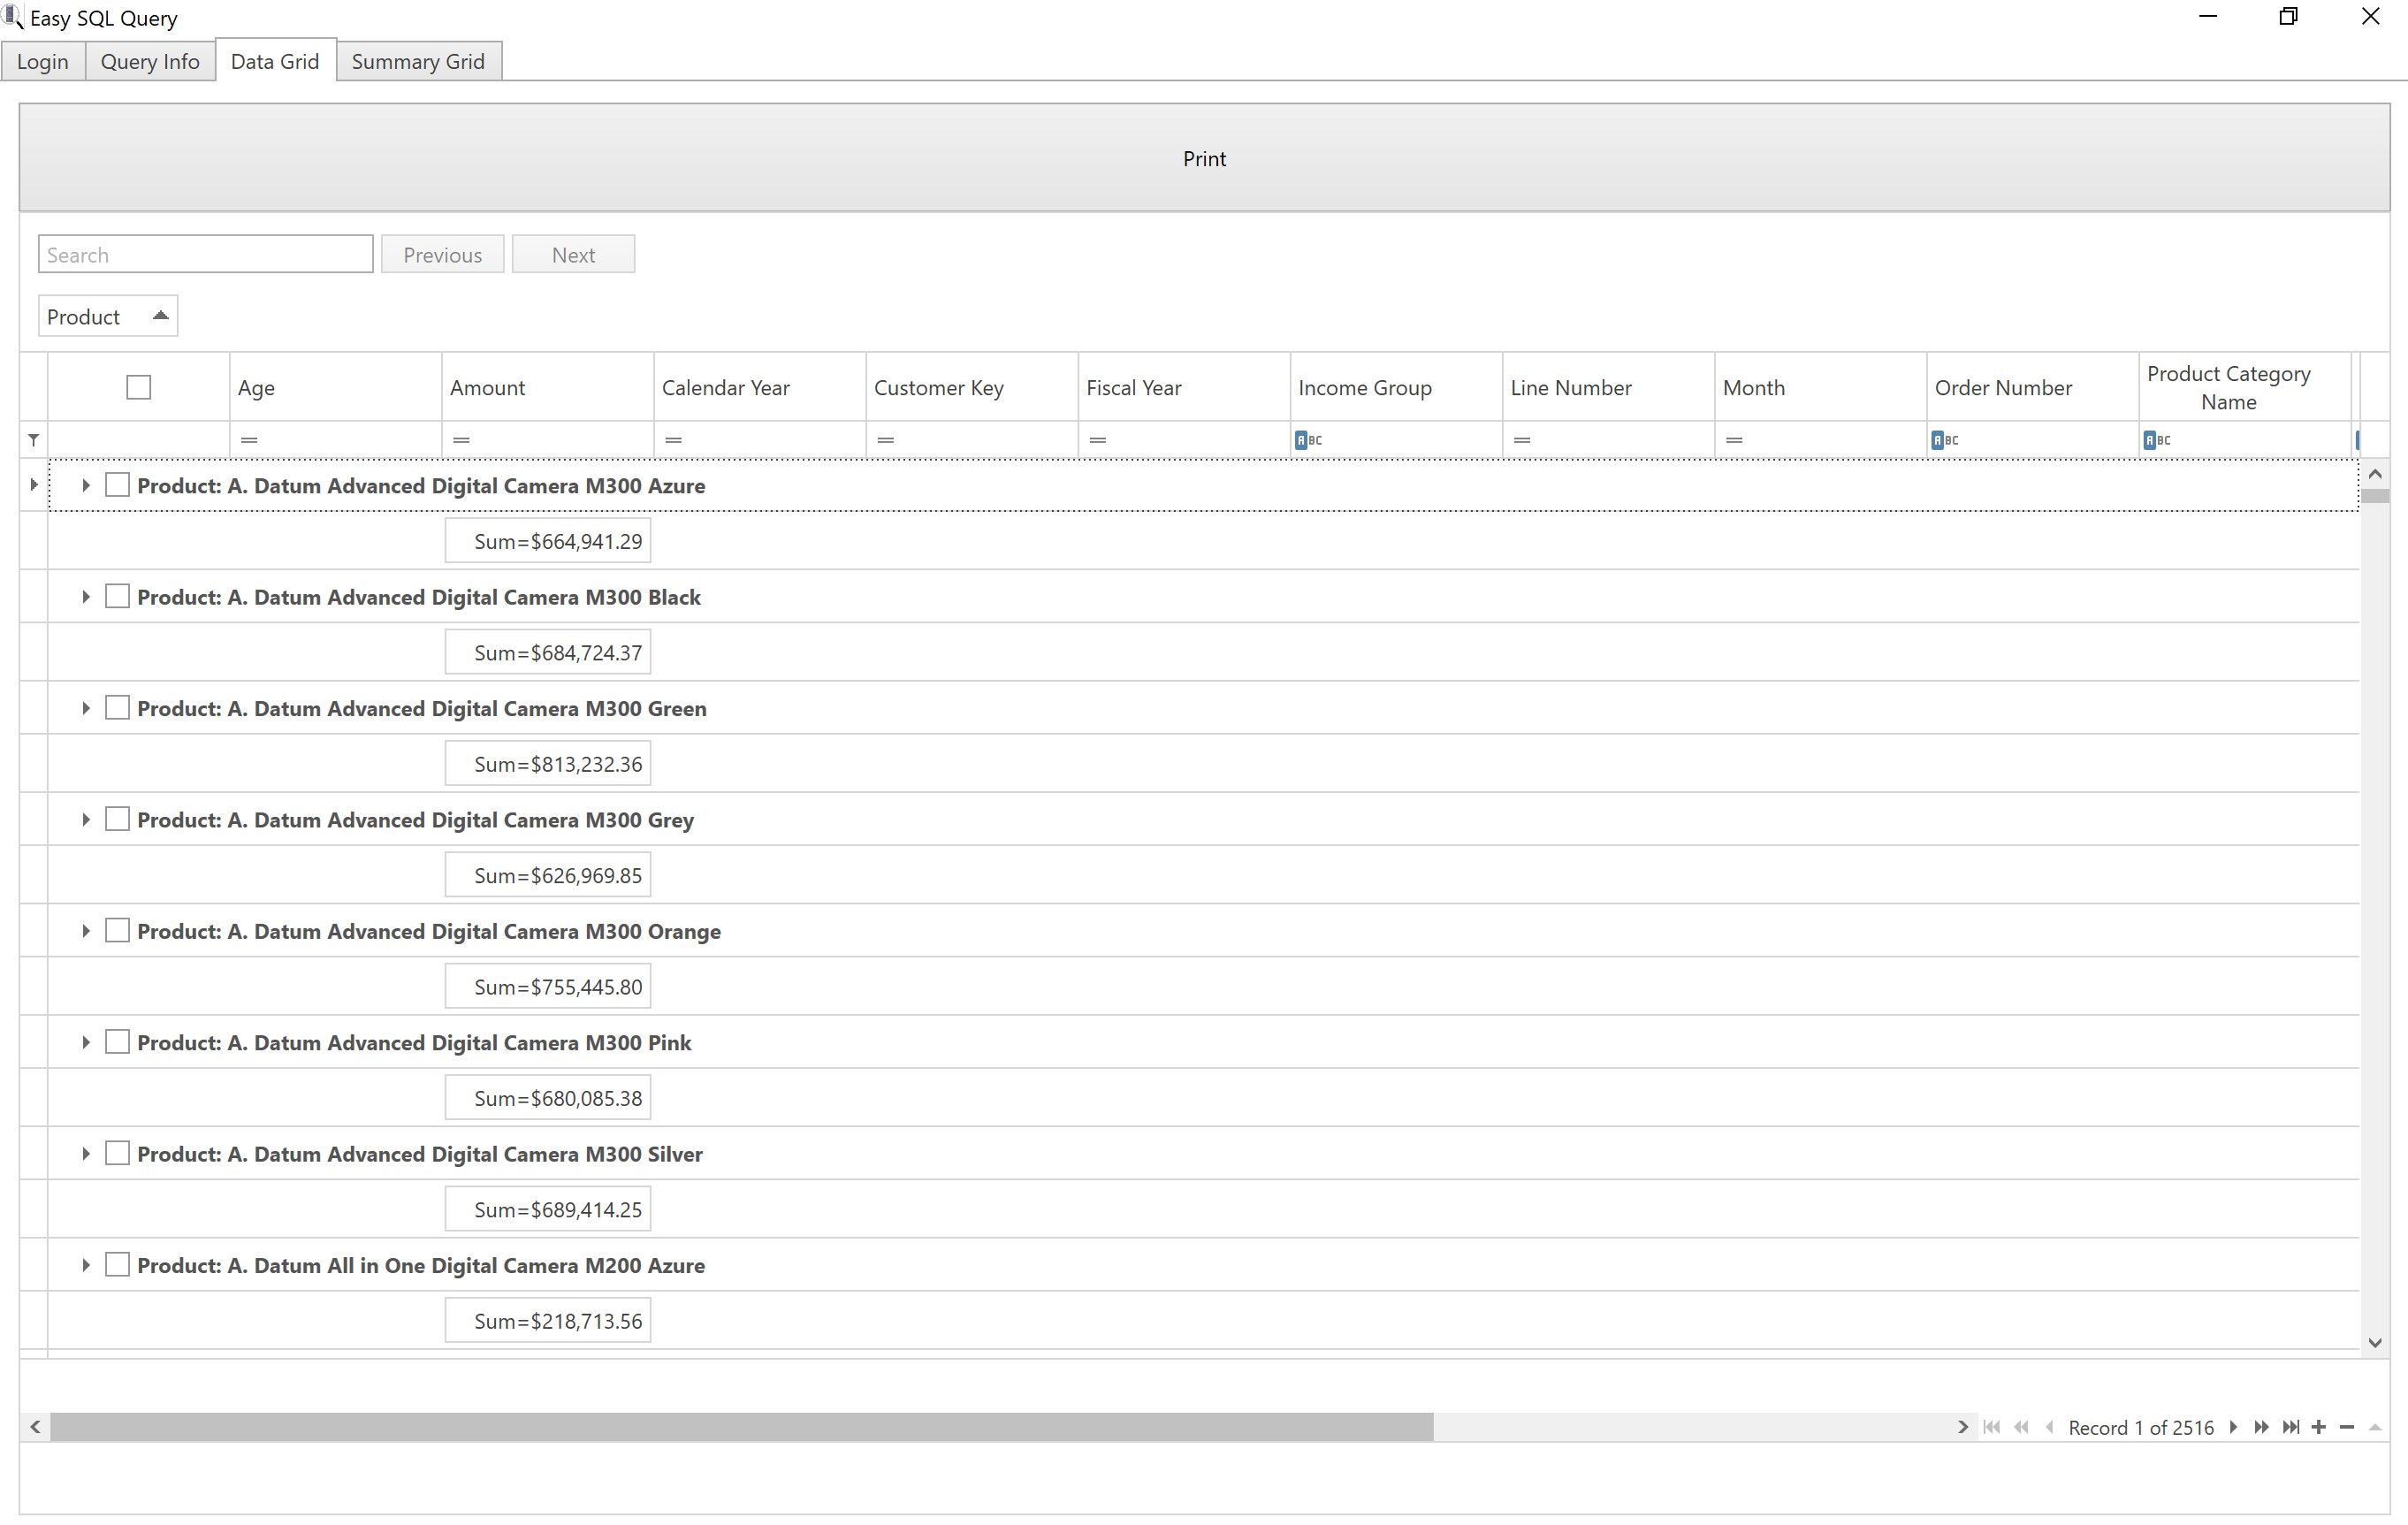
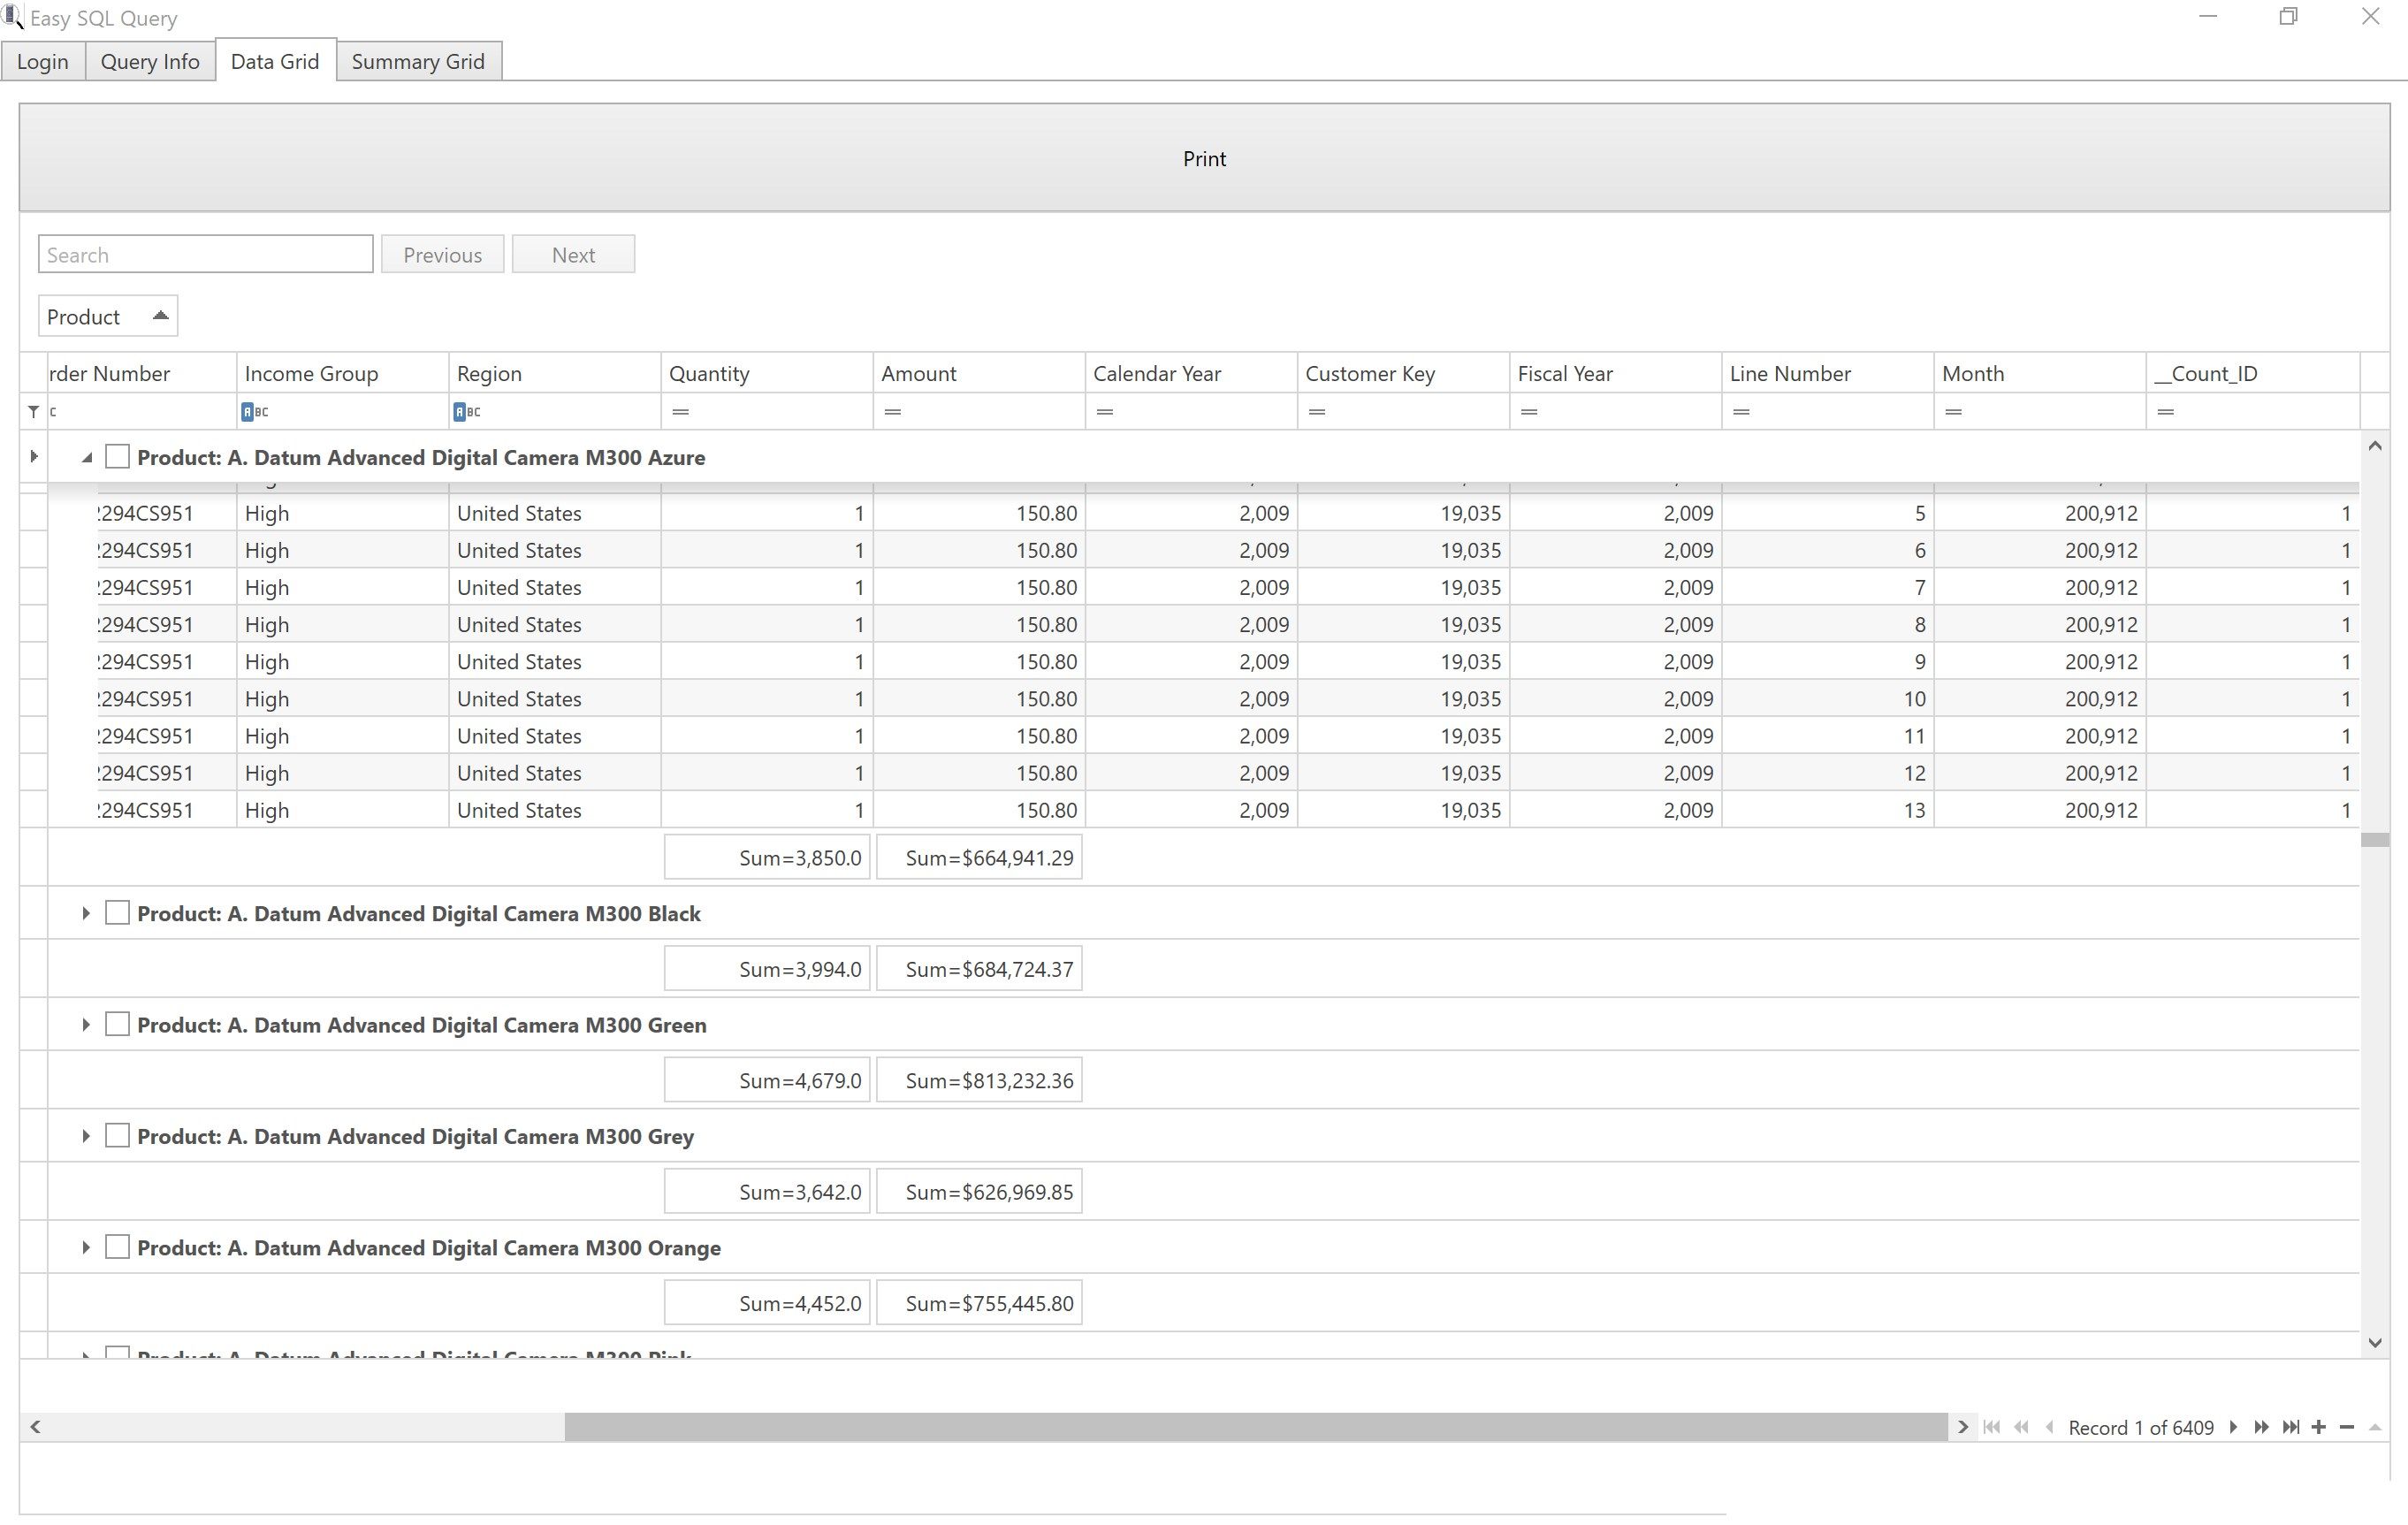
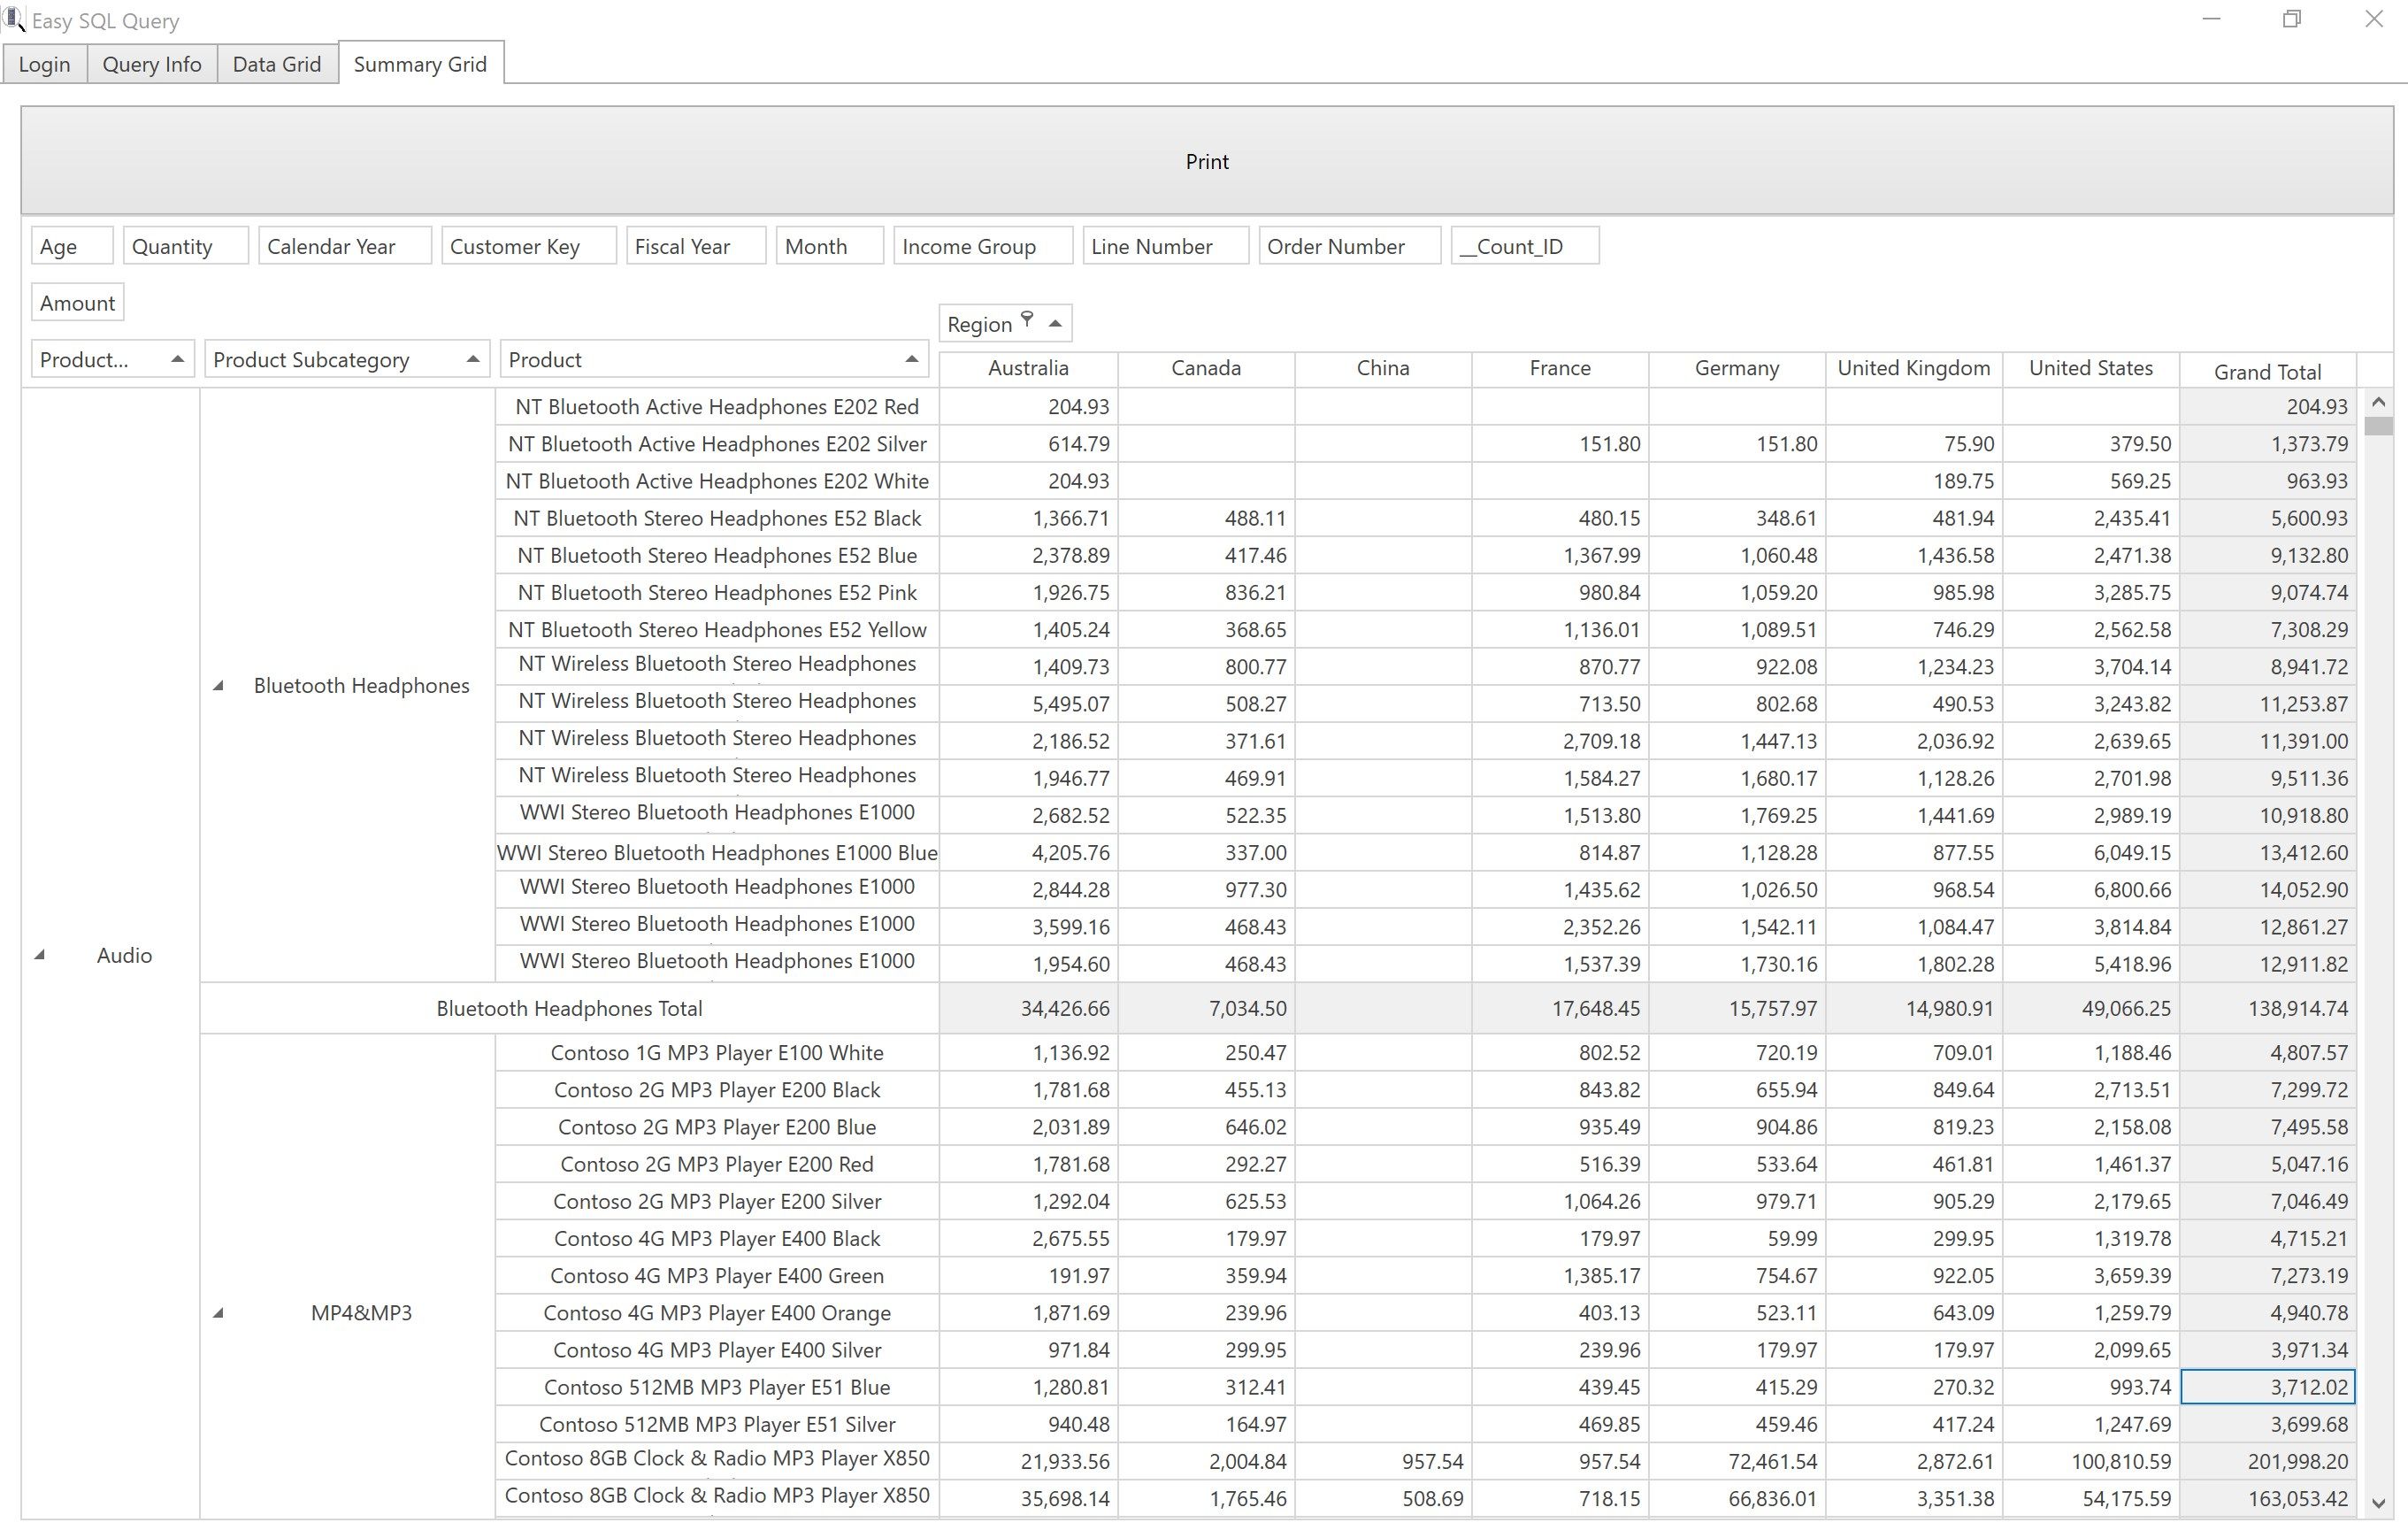
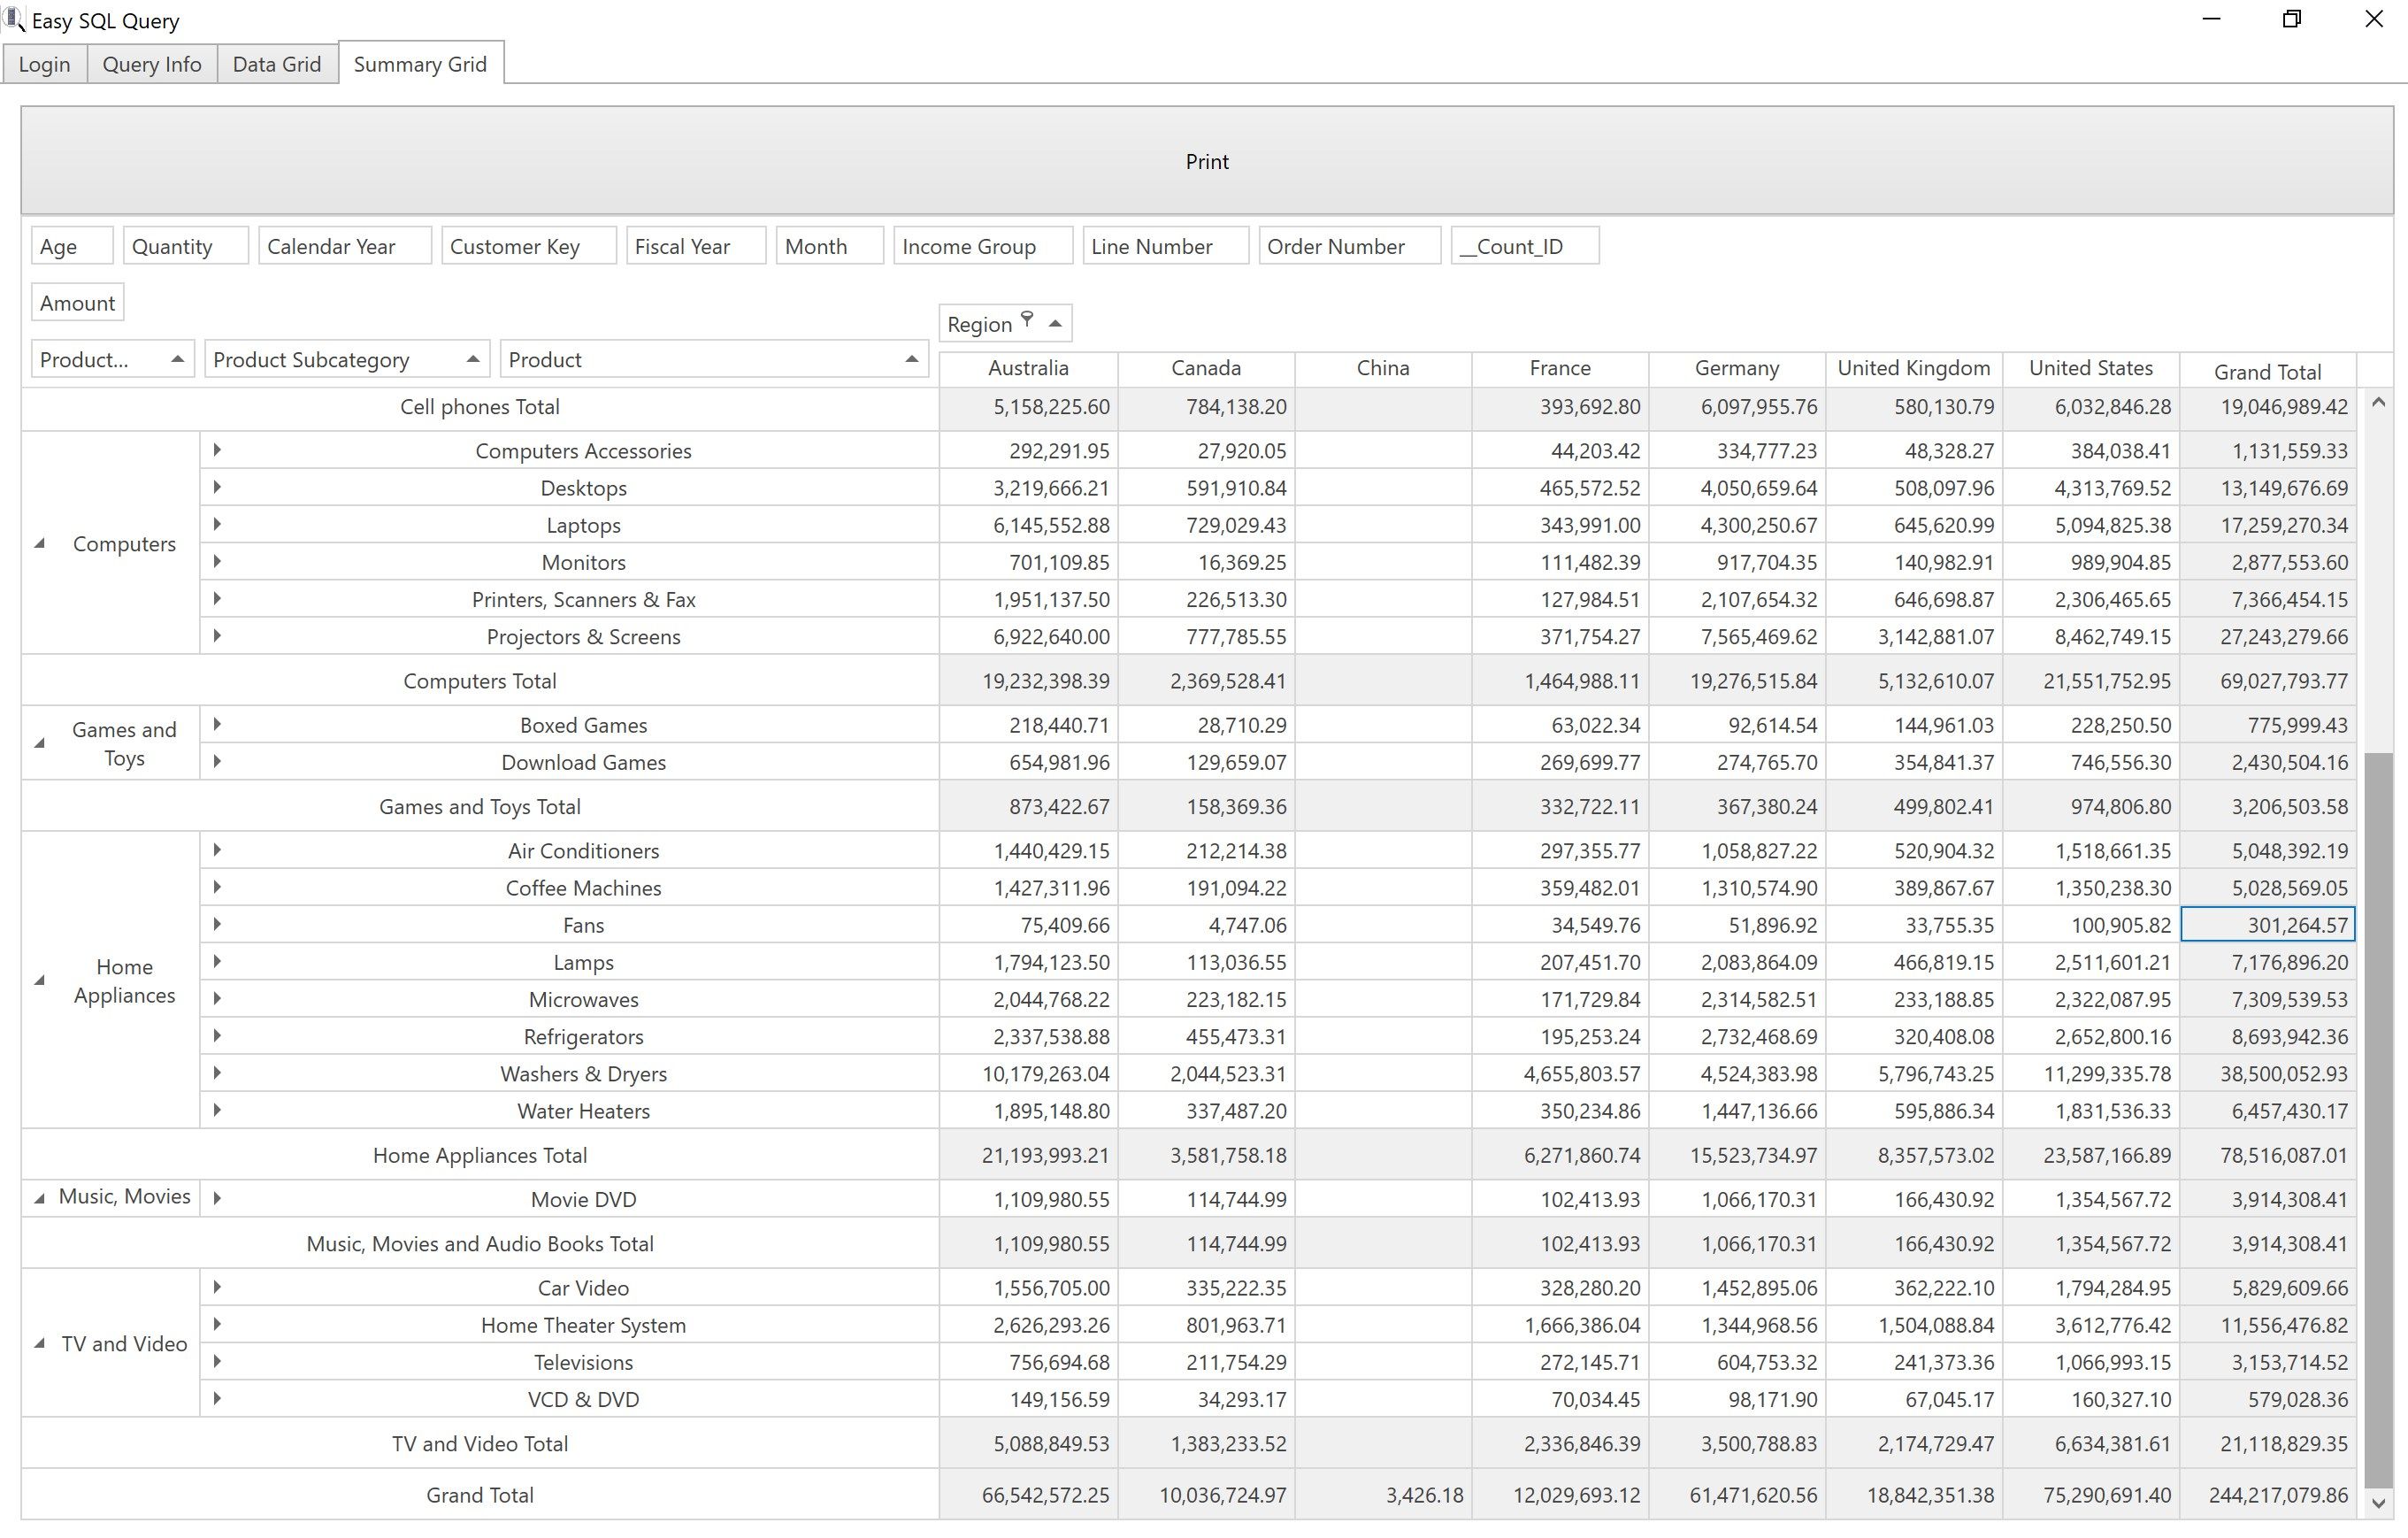
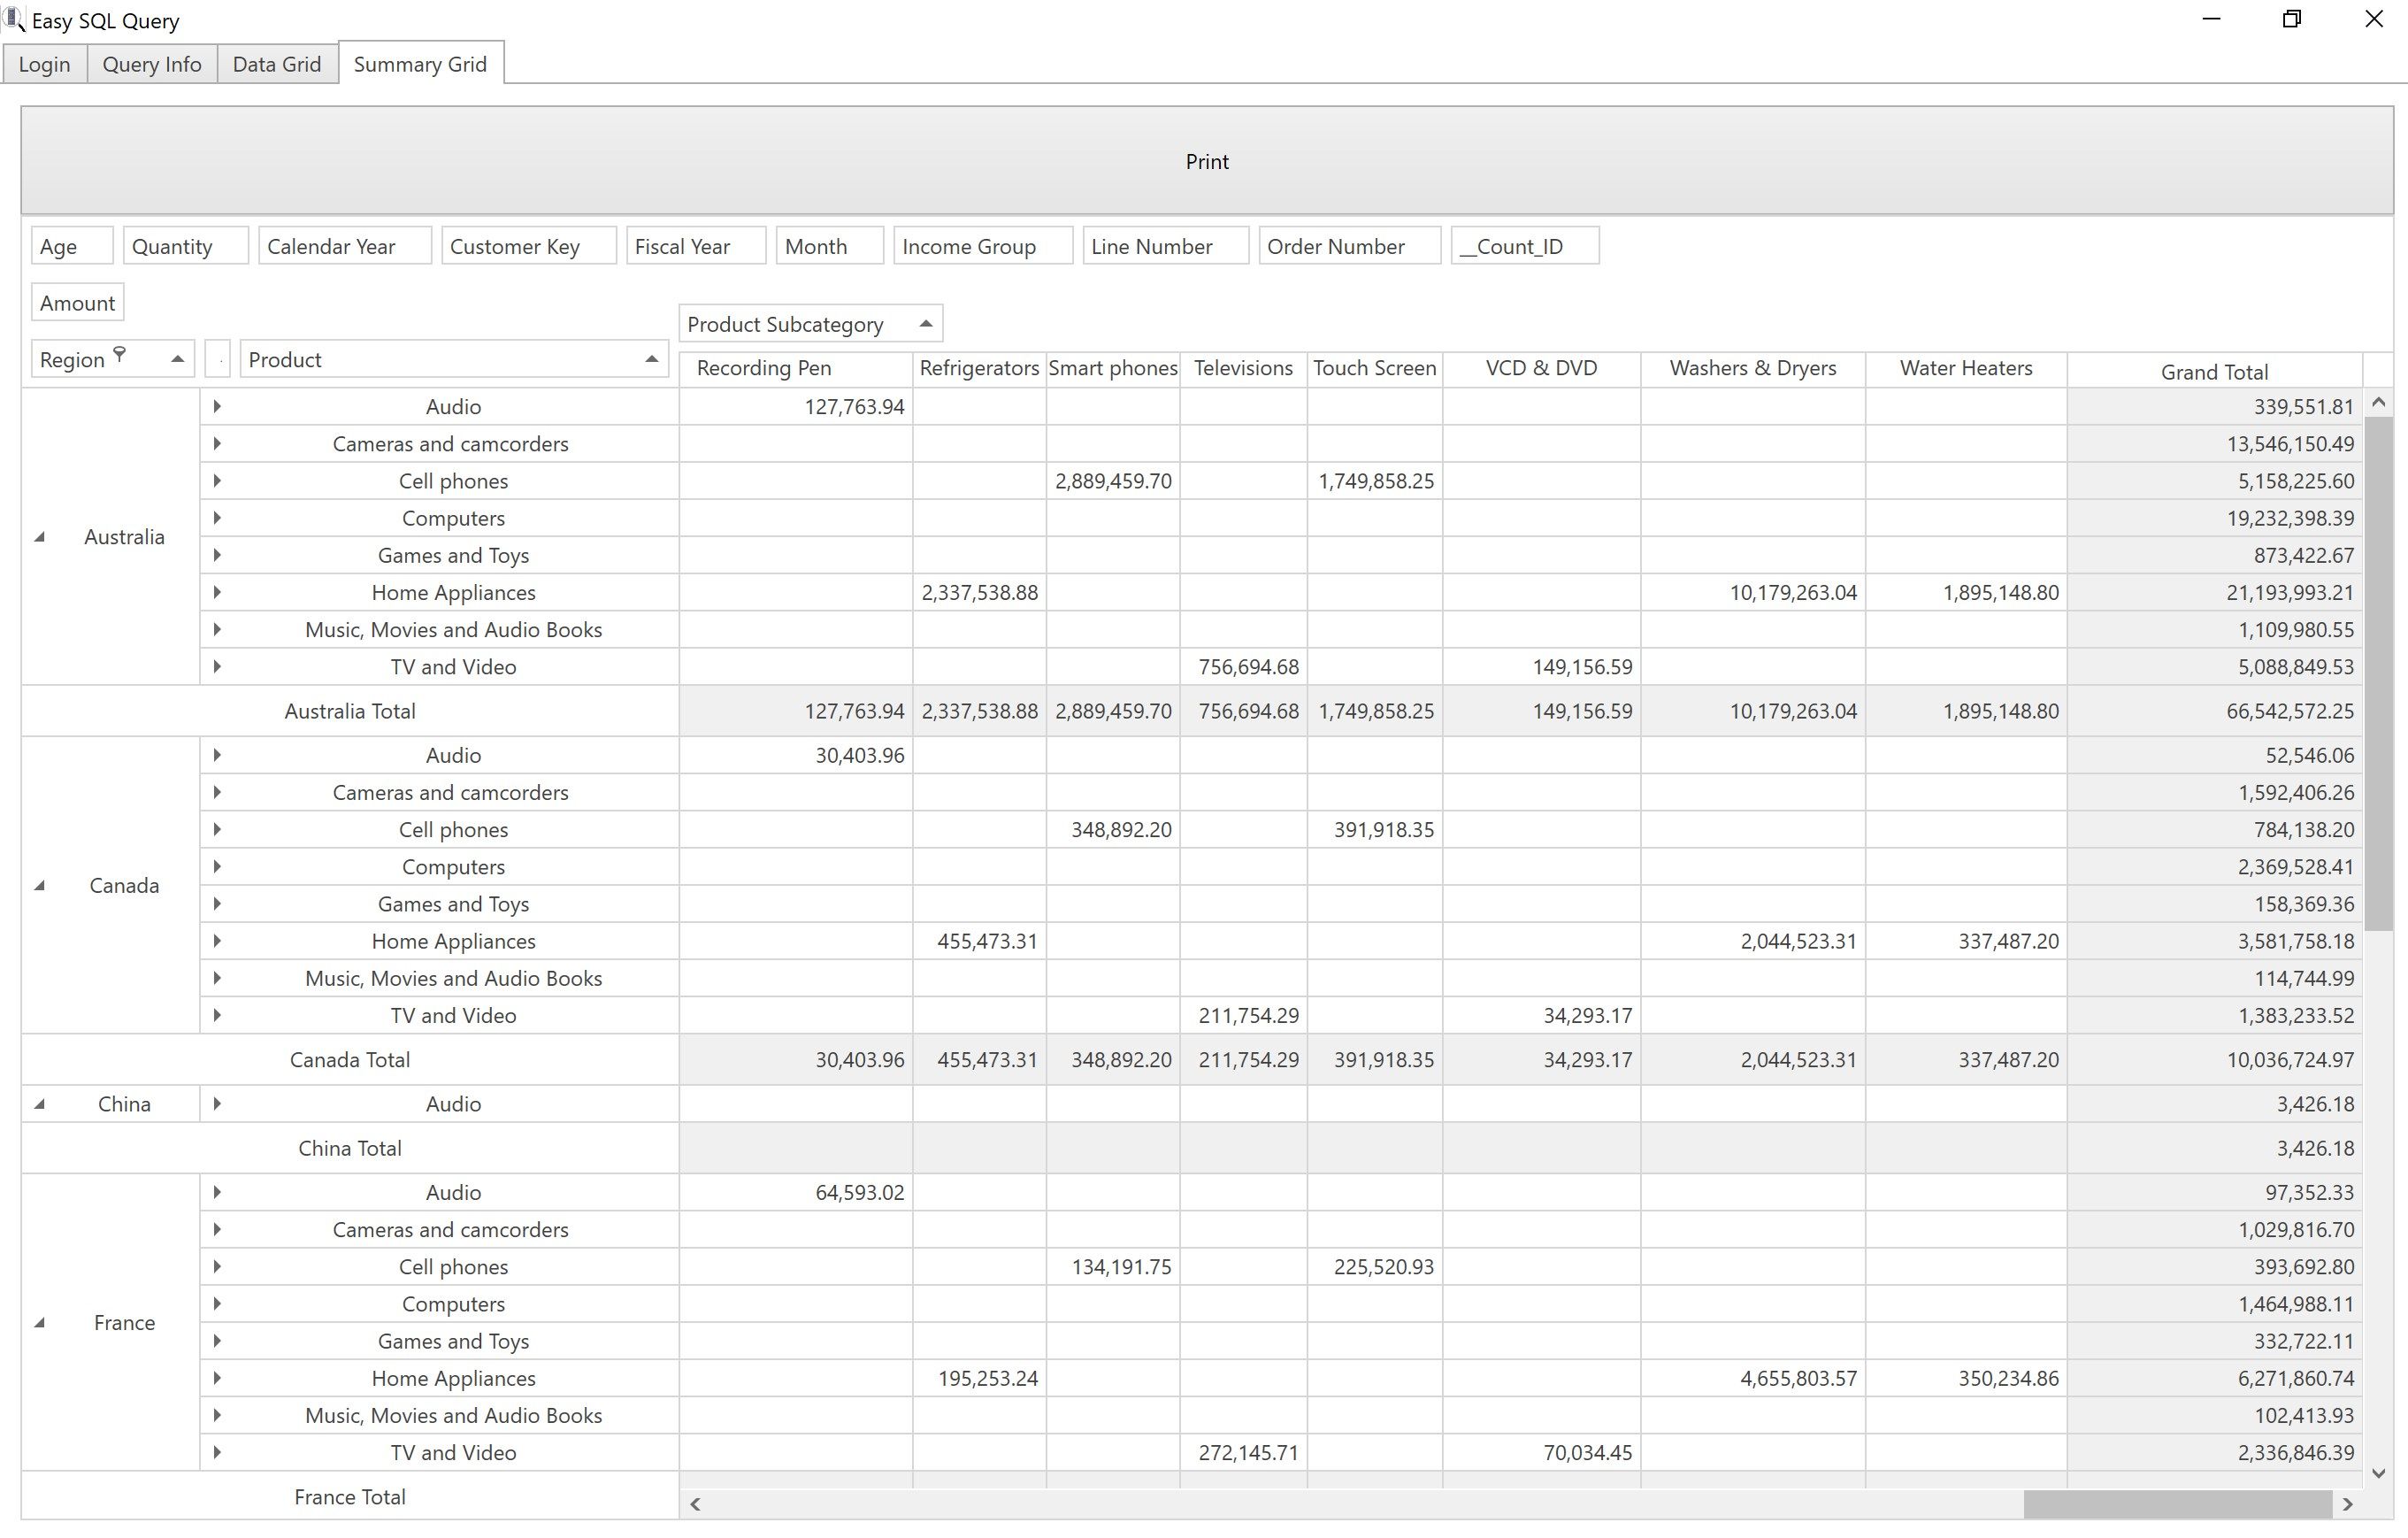
The second module is the pivot grid. The database in formation can be summarized by dragging and dropping fields into one of three areas, row or column hearders , or into the data sumation area. Grouping items is as easy as placing two or maore items in the row or column area. The grouping can be modified simply by reordering the placement of items. Totals are calculated for groups, column and row. Groups can expanded or collasped to show a high level view or expanded to a very detailed view of the items making up a group.
Reports can be printed or exported to Excel, PDF, Word and other formats. Reports can be emailed directly from the application for easy distribution.
The strength of this application is providing the user the ability to run multiple senerios with same data with out have to write a new query. The data grid and pivot table allow on the fly free form ad hoc analysis.
New queries can be run by reseting the existing contection the current servr/database connection or a new connection to a different sever/database can be established.
-
Provides a GUI to retrivieve SQL Server database data
-
Millions of rows of data can be analyzed quickly
-
Grouping, sorting, filtering and summaries can be performed easily by clicking and dragging data grid objects
-
The user can perform multiple queries from one SQL query with out any additional coding.