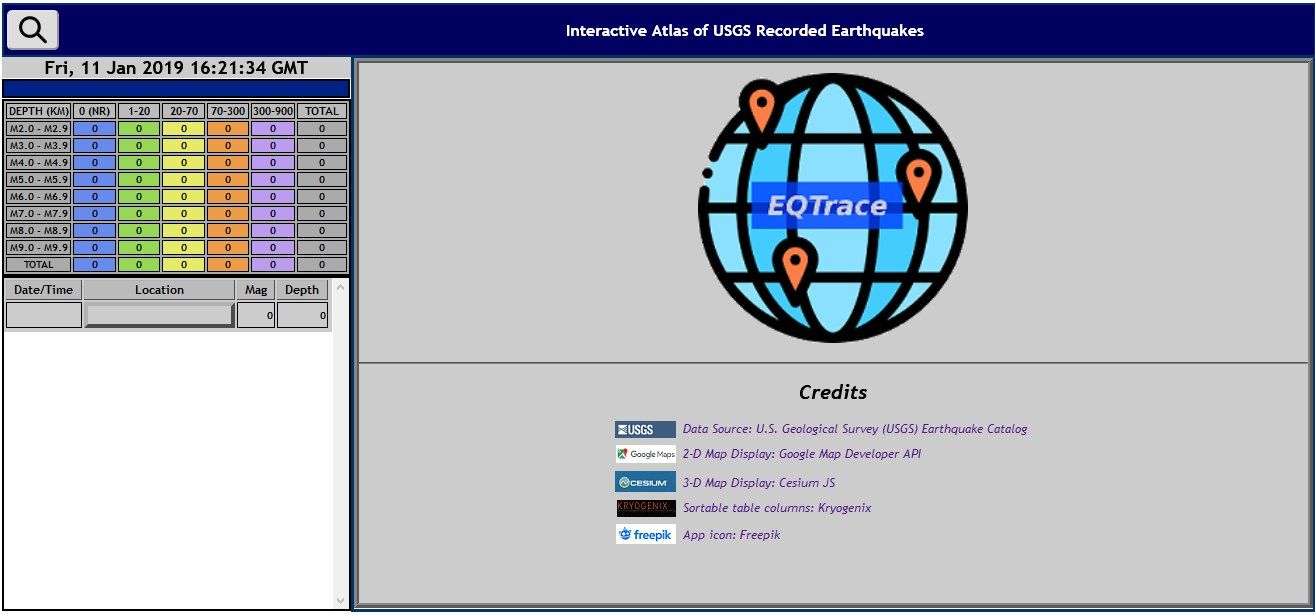
EQTrace
EQTrace
Rating (5)
Reviews: 1
Category: Books & reference
Initial EQTrace desktop display. Query Summary bar at the top will display the Query date/time range, magnitude and depth range. Left panel top to bottom: Initial Date/time or date/time of query, Geographic Region band, Earthquake Table, Earthquake List (scrollable). Right panel: initial splash screen, 2D map or 3D globe as specified in the query.
Results portrayed on a 2-dimensional Google Map (Mercator). Click or tap a marker to highlight it in the Earthquake List in the left panel. Click or tap a location button in the Earthquake List to identify its marker on the map.
Zoom in 3D view of the Island of Hawaii, showing a number of near- and on-surface volcano-induced quakes occurring in a four month period during 2018.
This example shows six magnitude 8+ earthquakes that occurred within a 15-month interval between July 1905 and September 1906. Note that the "Great" San Francisco quake of April 18, 1906 is not included in this result, it was officially recorded at 'only' magnitude 7.8!
Simulation run underway. This example focuses on the great magnitude 9.1 magnitude quake off of the northwest coast of Sumatra on December 26, 2004. The initial quake (shown in red) has just occurred; over the next 24 hours an additional 138 after-shocks of magnitude 5 or greater will occur.
Zoom in to the Sumatra simulation run after it's completed for a closer inspection. Observe on the earthquake list that the initial quake, and most of the follow-on shocks, all occur around 30 km below the surface, indicating that the fault scarp was relatively level.
Results portrayed on a 3-dimensional Cesium Globe. You can zoom, pan, and rotate the globe as desired, or change the overlay tiles (this example shows a Bing overlay with labeled locales).
Example of an in-process query. In this example, all quakes between magnitude 2 and 10 occurring over a six month interval, and located within a custom-defined geographic region, will be retrieved. The first Geographic Parameters button toggles 2D/3D display. The second button toggles pre-defined geographic region selection or custom region identification.
This example of an in-process query shows how to specify a custom geographic region, using the Region Identifier map and a region rectangle to define an area of the western United States. Pan the rectangle to the desired region on the map, and drag any of the eight resize handles to refine the area of choice (Use the Full Screen toggle button in the upper right corner if necessary).

Description

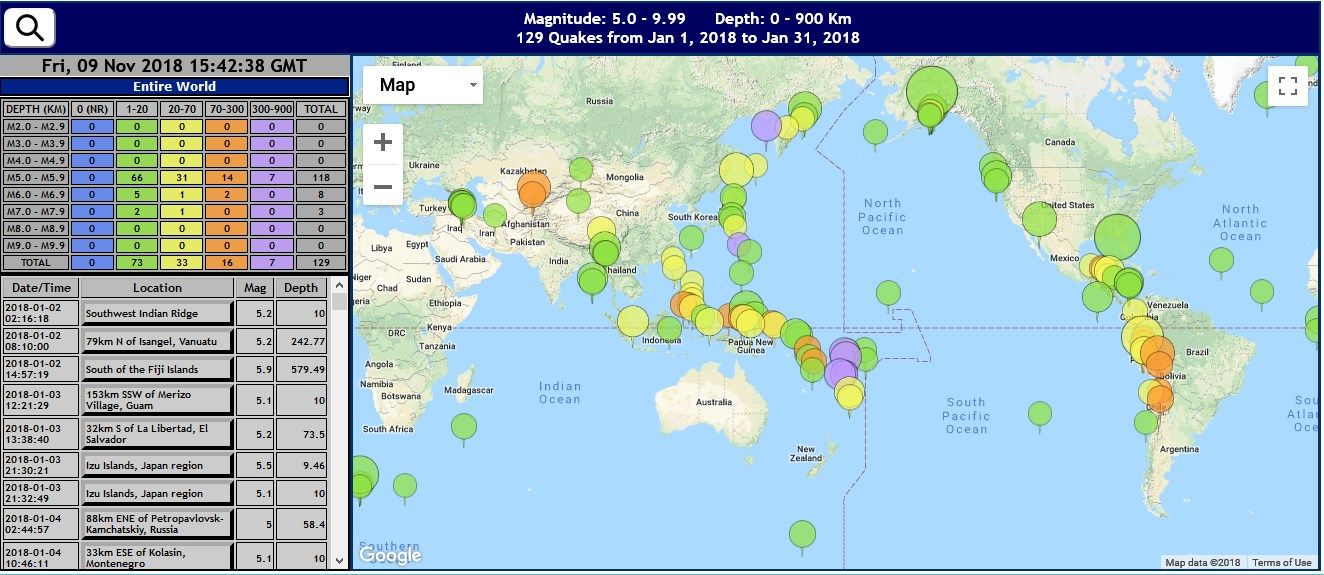
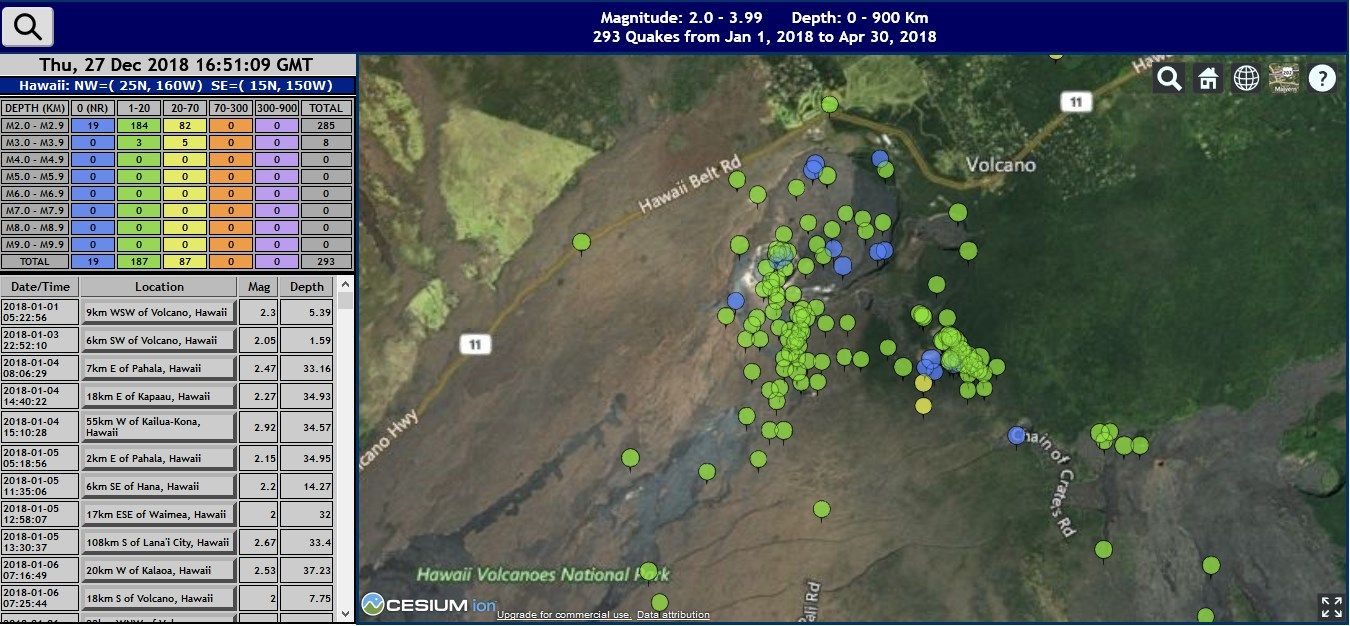
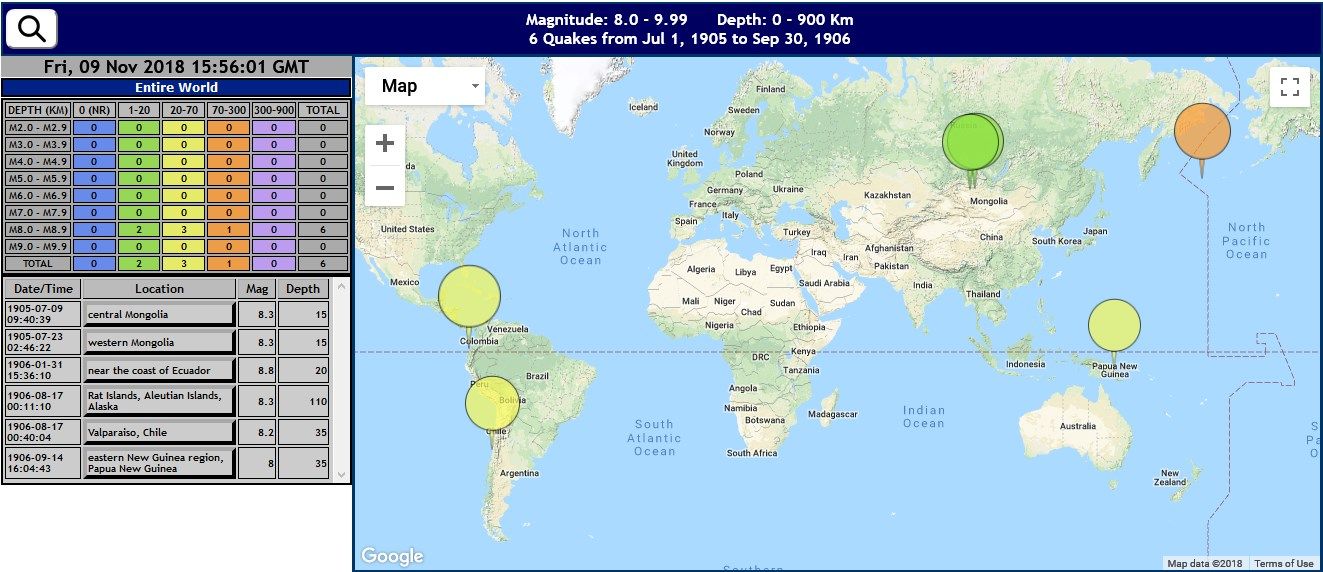
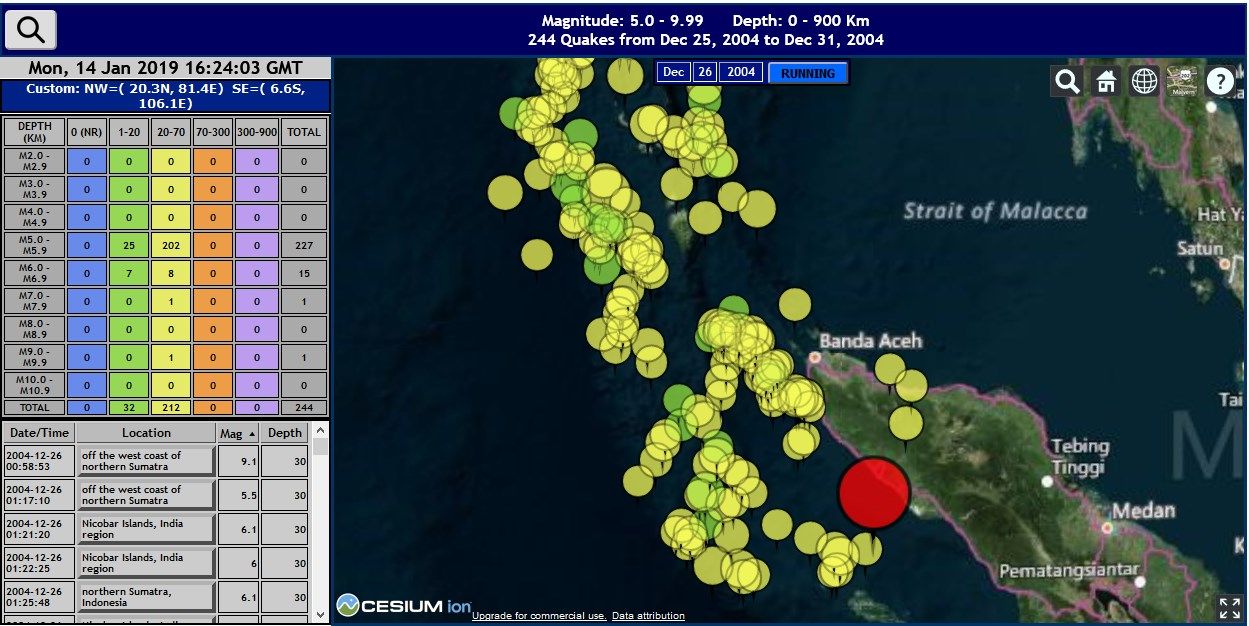
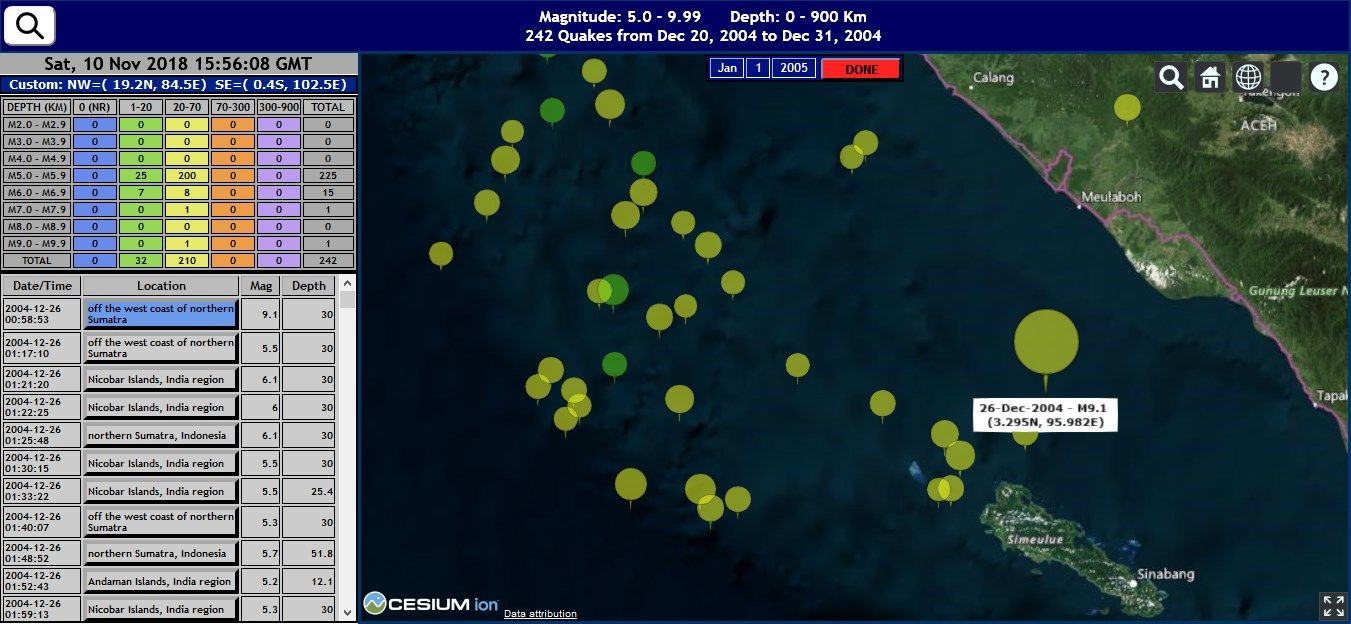
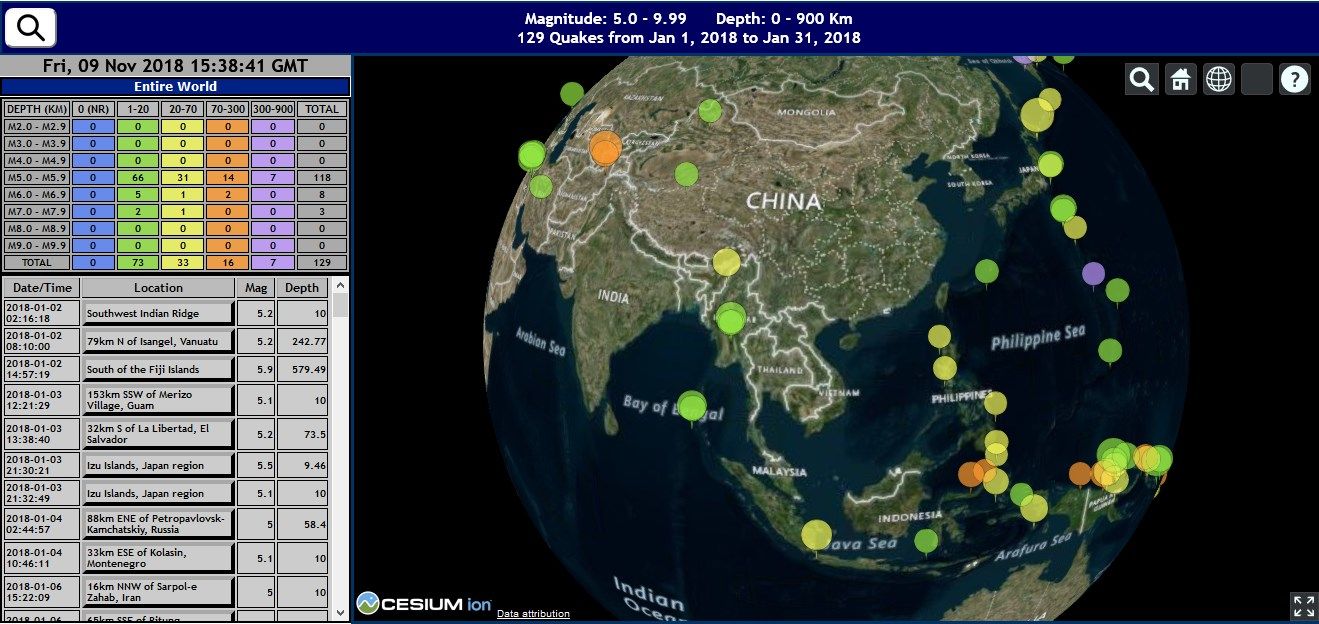
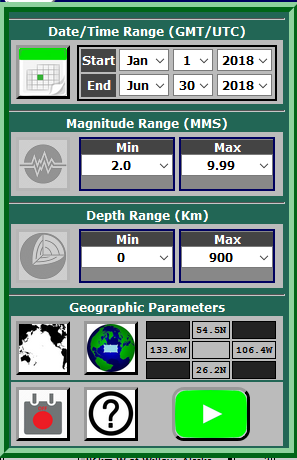
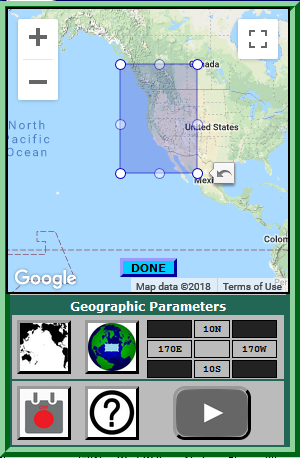
The EQTrace Earthquake Atlas is an interactive web app that displays selected earthquake events from the publicly-available United States Geological Survey (USGS) on-line repository. You enter search criteria, optionally including a designated geographic area, and the events are presented on a 3-dimensional globe or a 2-dimensional map. EQTrace provides both a static display and a simulation capability; the simulator displays the selected events in time order.

The data source is the USGS Earthquake Catalog portal, which provides access to all Earthquakes maintained in the USGS database, dating from January, 1900 to the present.

  • Retrieve USGS-recorded earthquakes by date and time, magnitude, depth, and geographic location
  • Display results on a 2-D Google map or 3-D Cesium globe
  • Select from a list of pre-defined geographic regions (for example, U.S. West Coast, Java/Sumatra, Alaska, etc) or define a custom region
  • Run a time-based simulation of quakes as they occurred over a specified date/time and location
  • Customize 2D or 3D displays using built-in GoogleMap and Cesium Globe tiles and overlays
Product ID: 9NV9TV0VGKL9
Release date: 2019-02-01
Last update: 2022-03-13