
Description
Save time when creating high-level Gantt charts in PowerPoint. Transfer your MS Project schedule data to PowerPoint at the click of a button. Choose and preview the formatting for bars, milestones, baselines before you send data to PowerPoint. Your project data never leaves your system, keeping it secure and confidential.
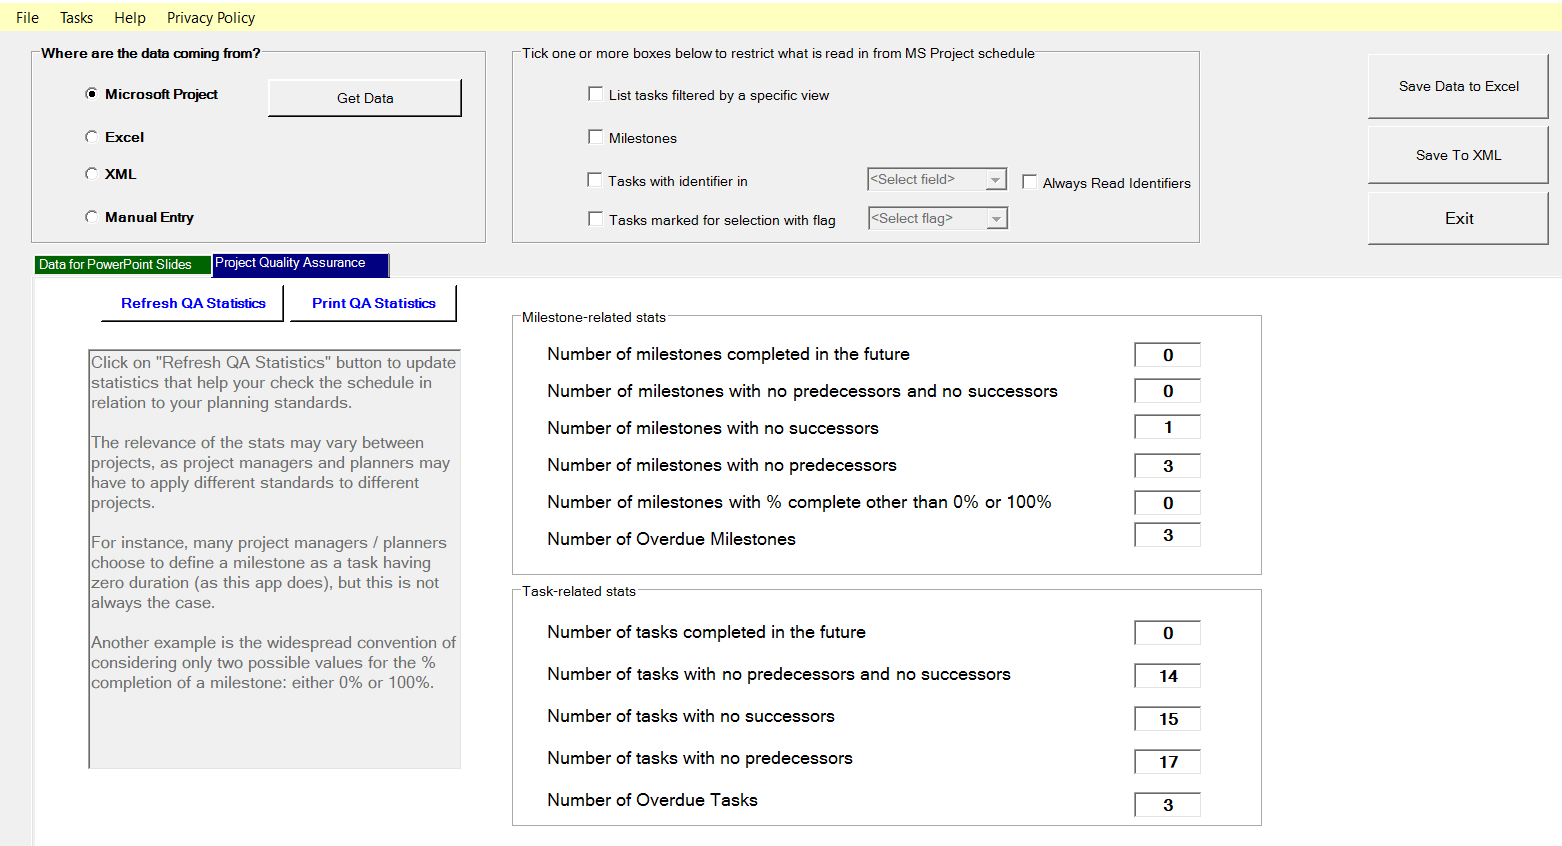
You can now run checks on your MS Project schedules to detect if you have tasks or milestones completed in the future (it happens!), tasks or milestones without predecessors or successors, etc. Have a look at the new tab on the main screen.
Try it free for 7 days and see for yourself.
App requires MS Project, Excel, PowerPoint to be installed in order to offer its full range of capabilities. However, users without MS Project can enter data manually (and save it) or can process data saved by the app (or other apps) in XML or Excel for sending to PowerPoint.
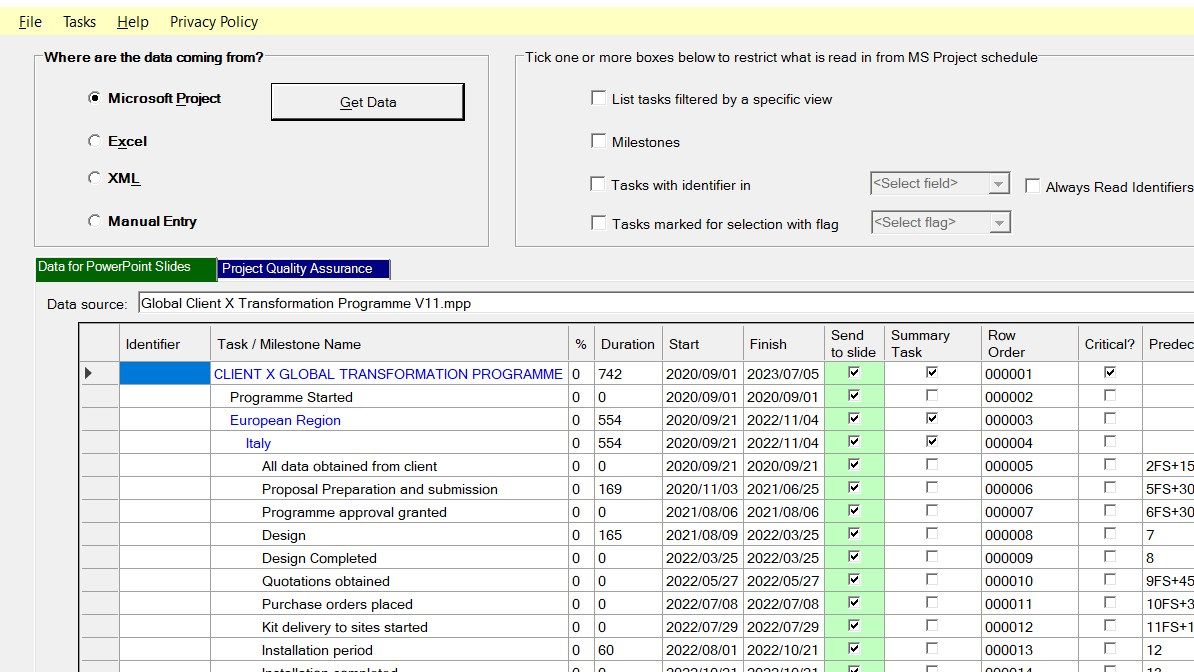
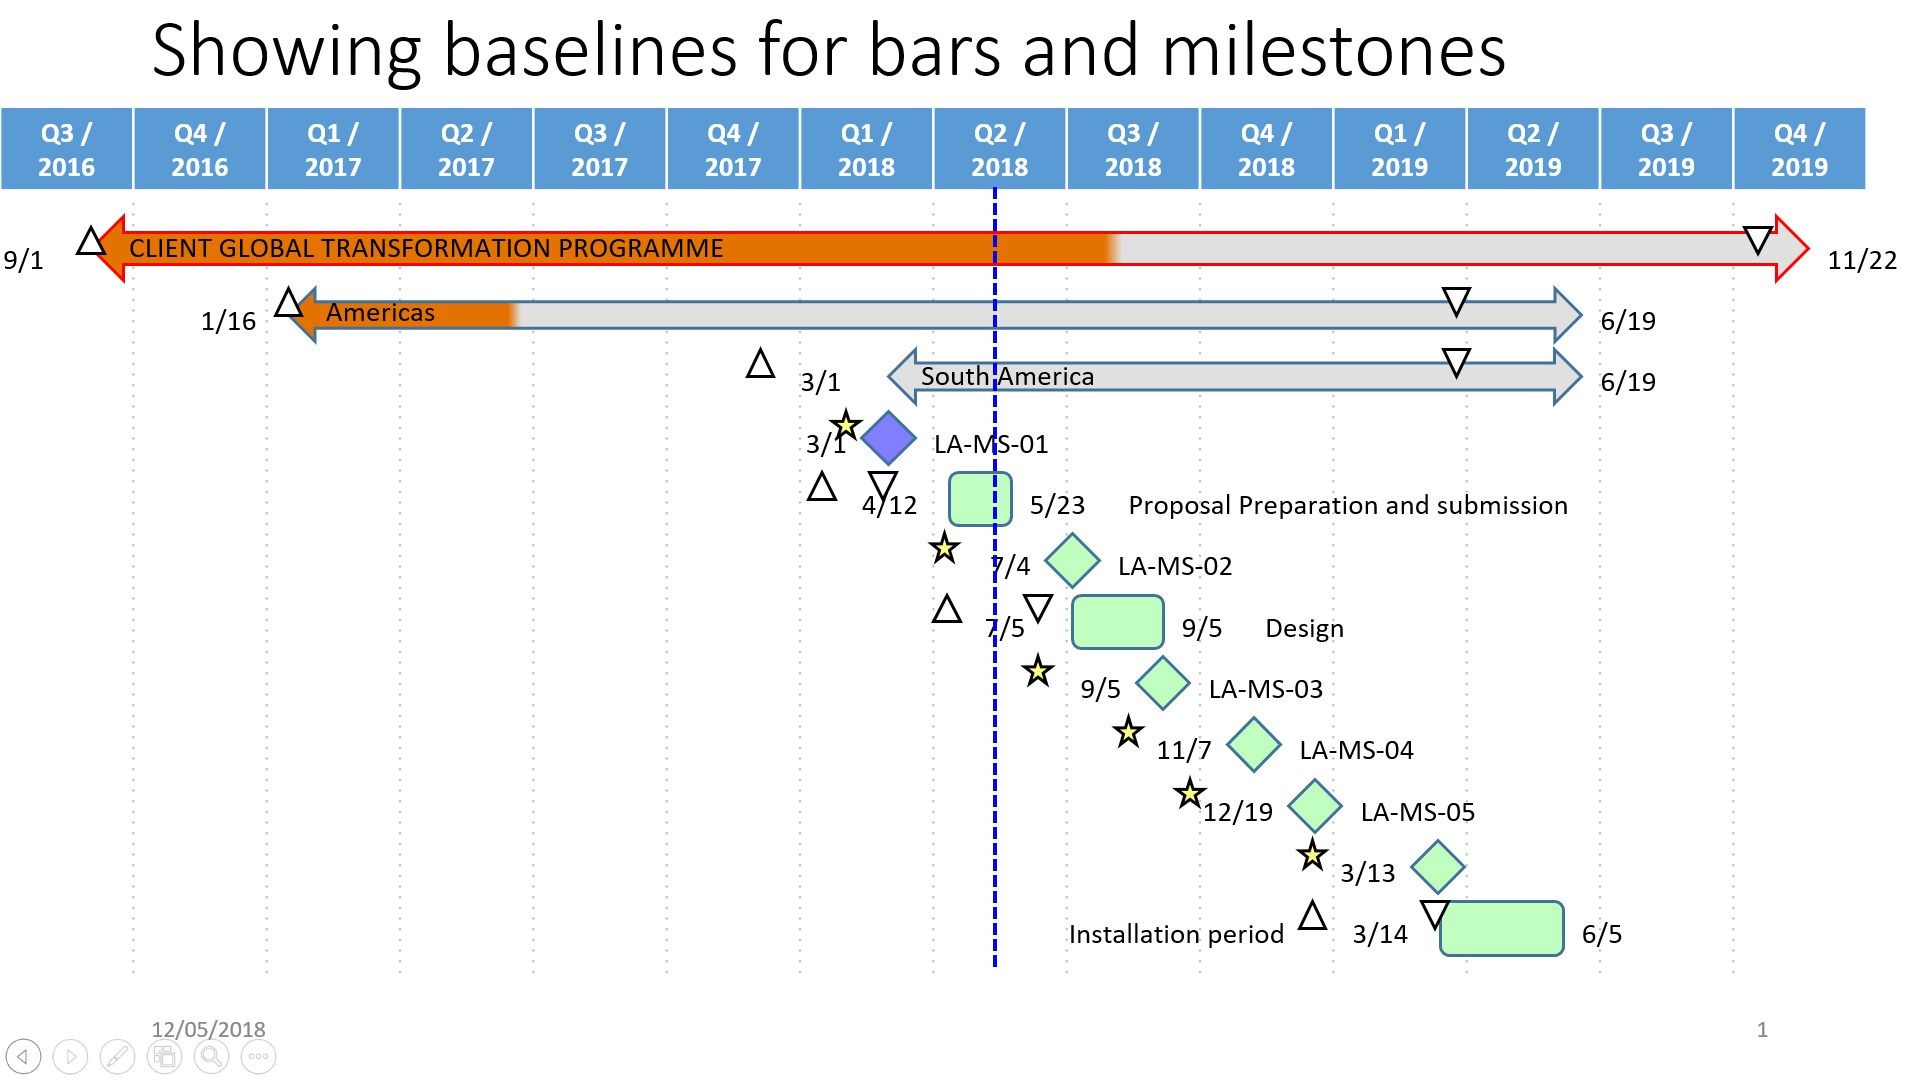
Plot project task bars and milestones (with baselines when you need) on native PowerPoint presentation directly from your MS Project schedule (or from Excel or XML files). Select the MS Project view for different reports or use the app to further select what you send to PowerPoint.
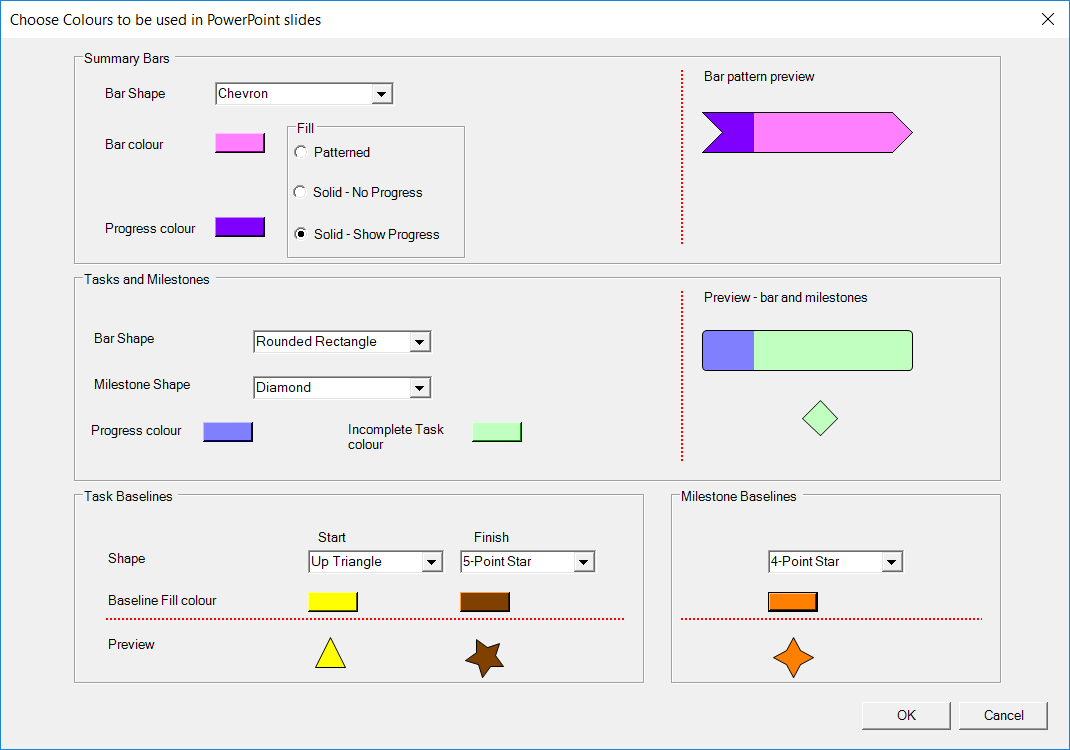
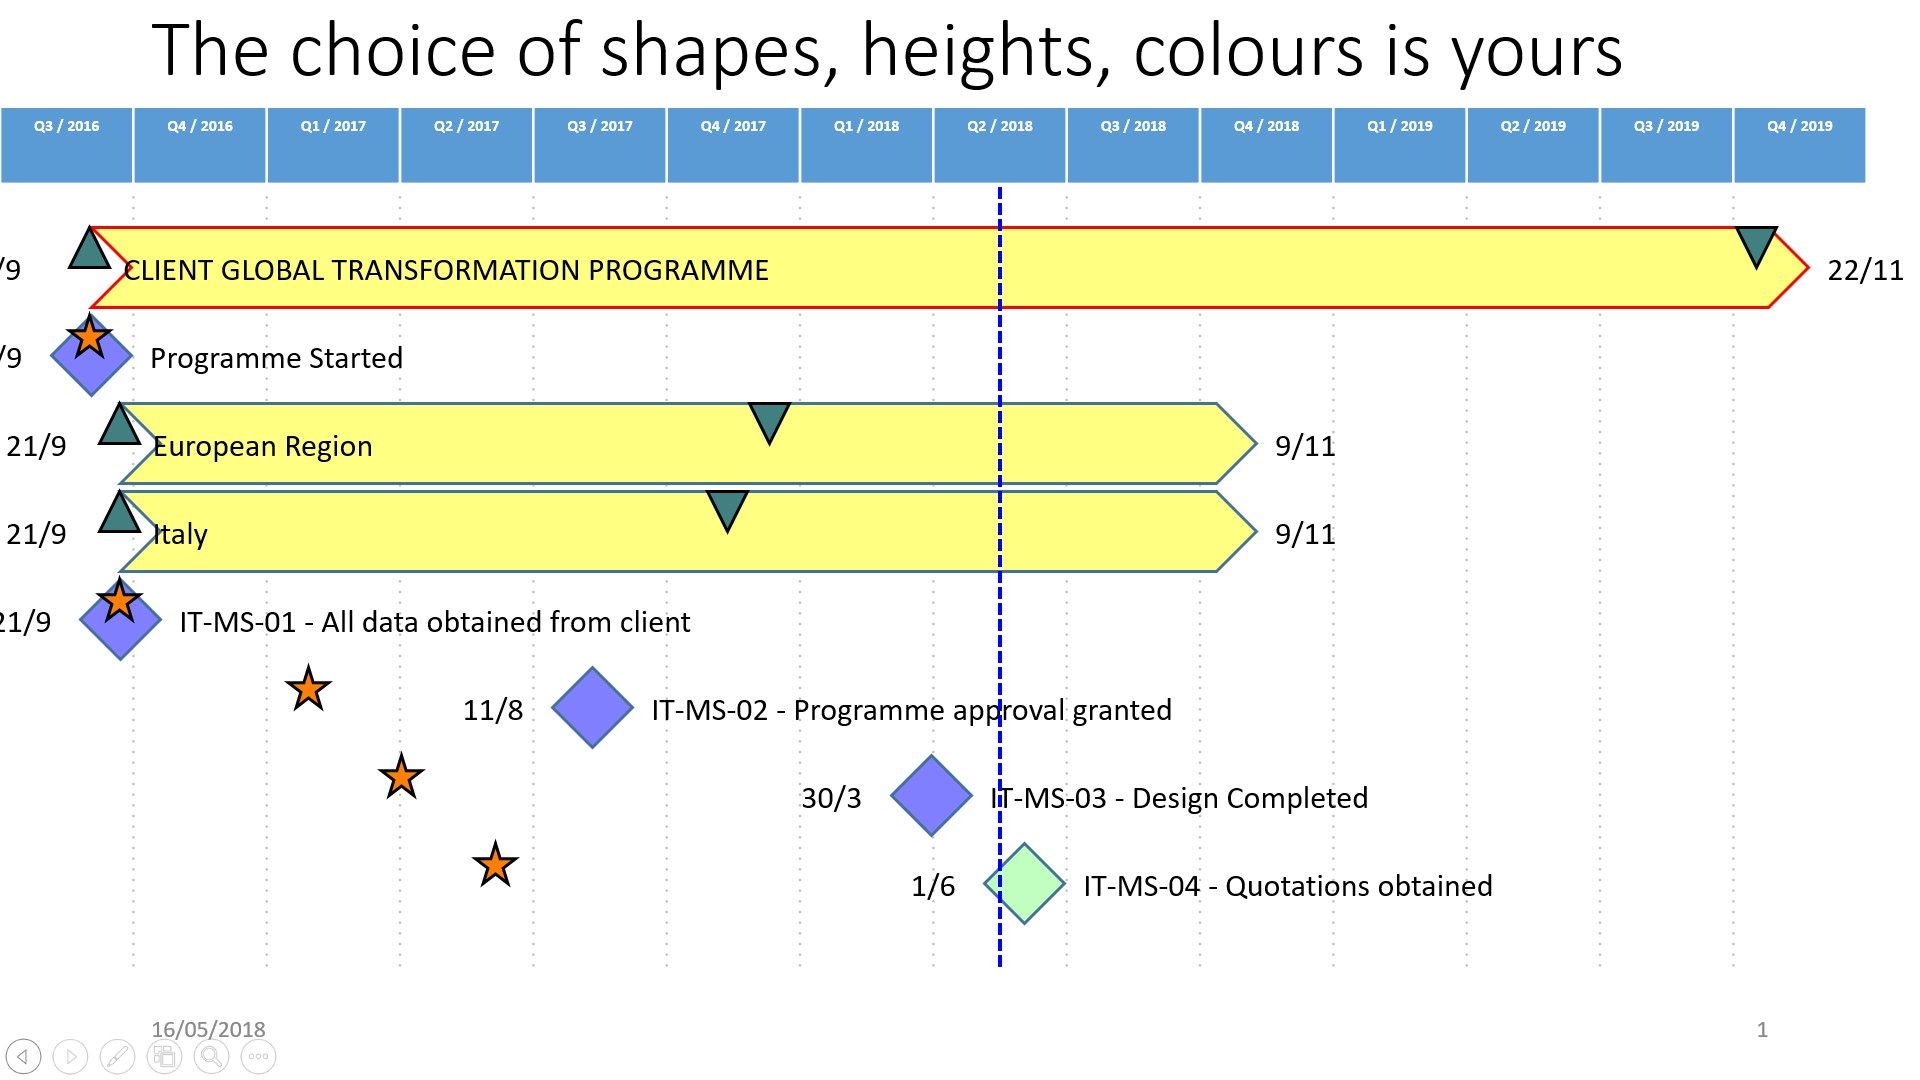
Full freedom to choose shapes and colours for summary bar, tasks, milestones and baselines. You can choose different shapes and colours for the start and finish baselines.
This is a great time-saver for Project Managers, Project Planners and Project Management Office personnel when generating reports.
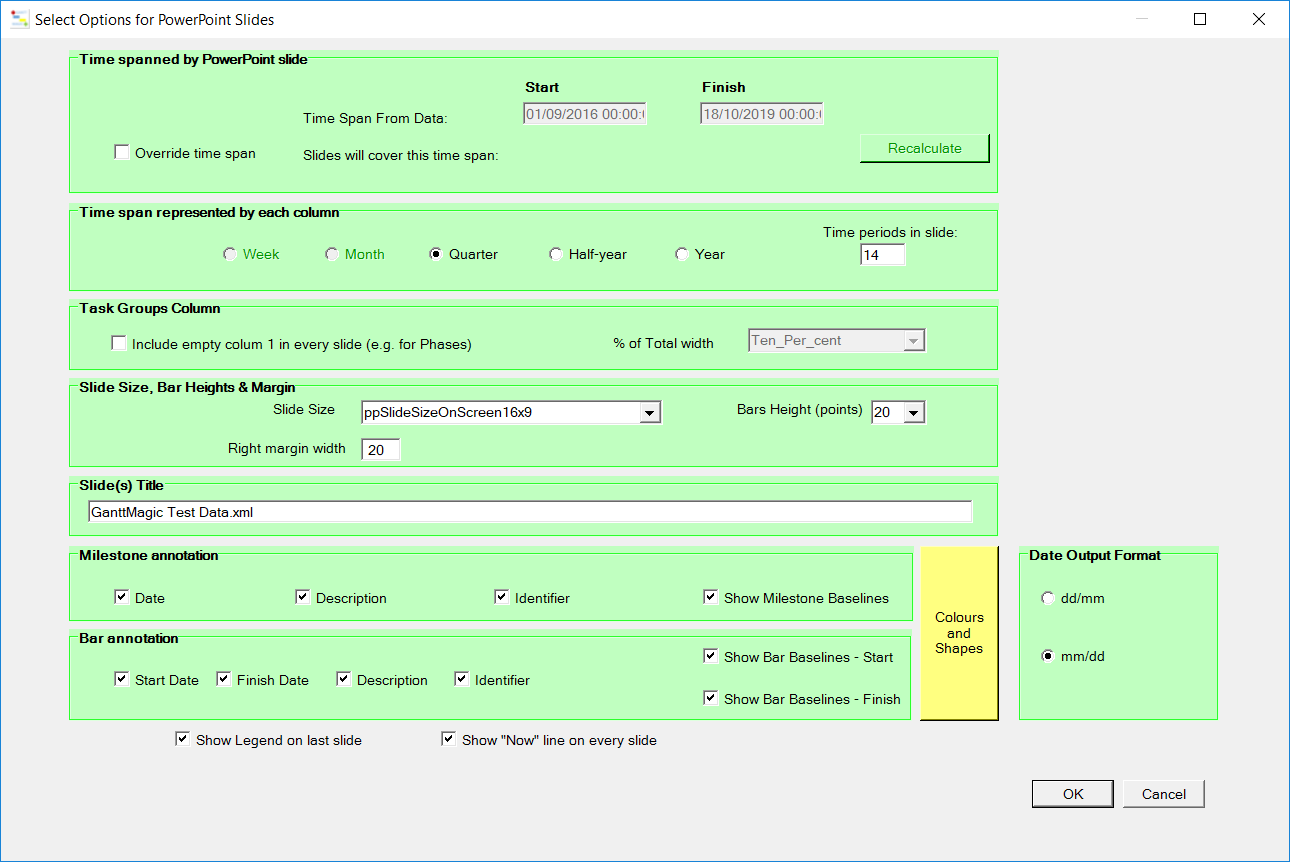
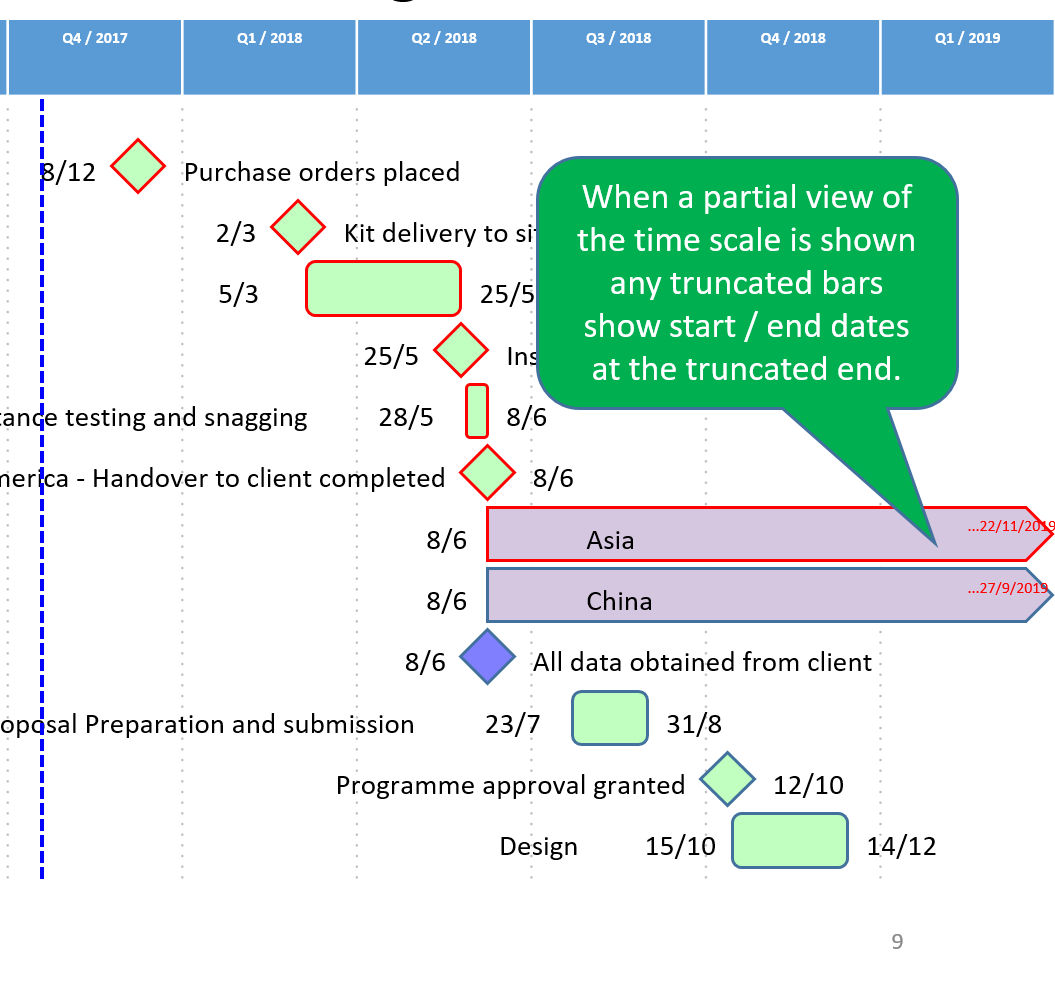
You enjoy full flexibility in choosing which lines will be sent to PowerPoint. You have complete control over what time period will be covered by the slides and over the annotation of bars and milestones, including choosing the colours to be used by PowerPoint.
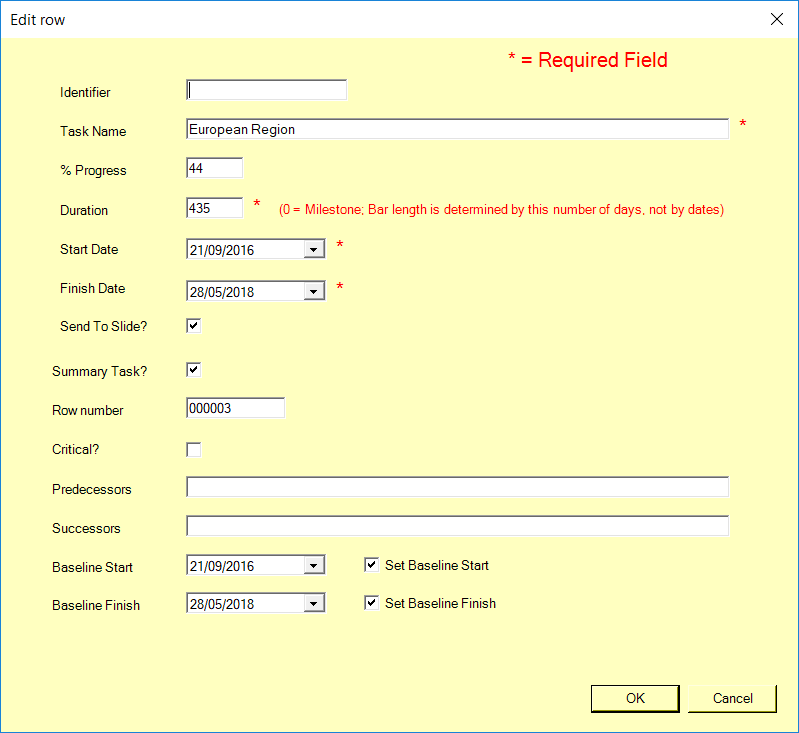
You can also manually add lines where they are needed, even after importing the data from MS Project or from Excel or XML files you have saved previously with the app.
-
Read data from MS Project, XML or Excel and create PowerPoint slides
-
Automated data transfer to PowerPoint
-
Can show baselines for summary bars, tasks and milestones
-
Can modify data and manually add lines
-
Complete control of what tasks are sent to PowerPoint slides
-
Full flexibility on annotation of milestones and bars (can include any combination of Identifier, Start, Finish, Description)
-
Support for MS Project views
-
Save data to XML or Excel. Keeps data secure within your own machine. No is ever transmitted outside your system.
-
Can select and preview colour and pattern to use in Summary bars
-
Can select what colours to use for tasks (including % progress), baselines and summary bars
-
Can format output data for bar annotation, irrespective of your regional settings.
-
Quality assure project schedules to detect common pitfalls.