

Description
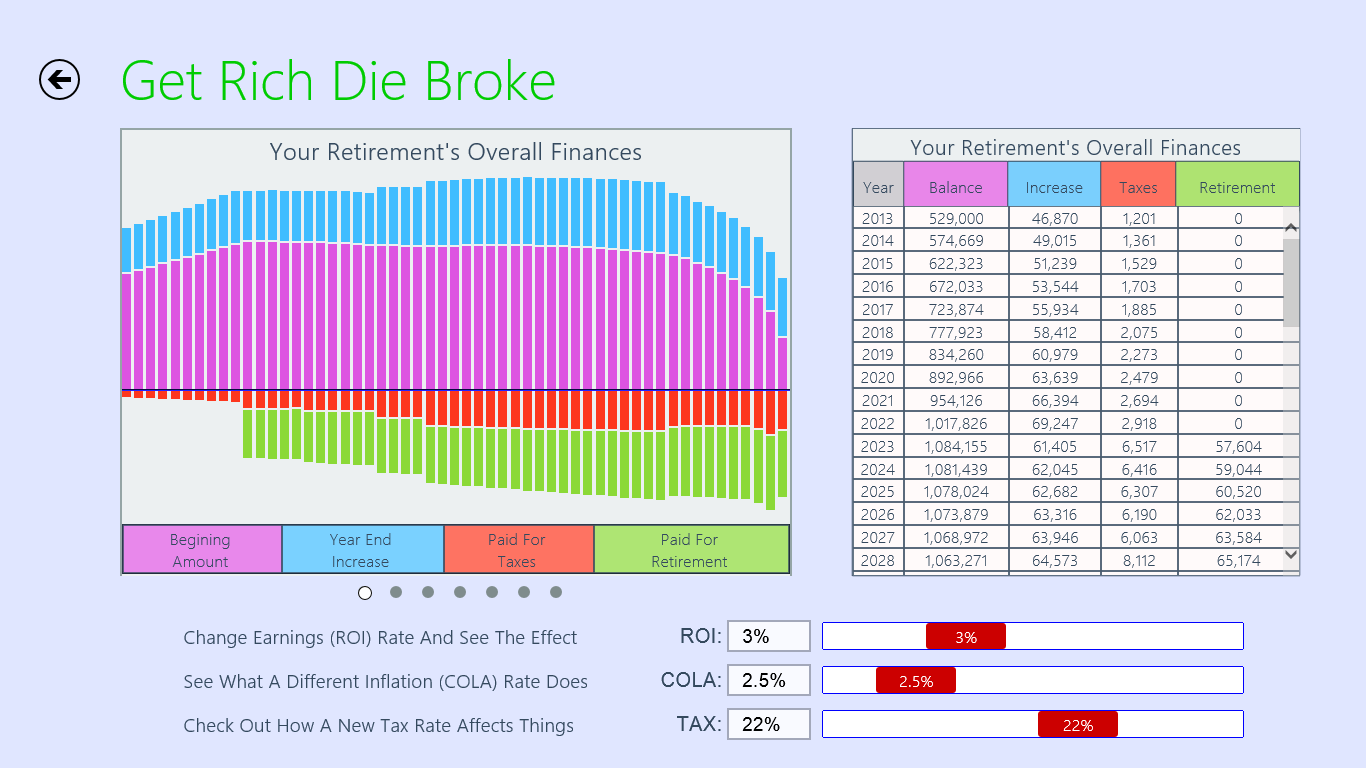
Shows how the compounding effects of earnings, taxes, and inflation will affect your retirement finances. Draws charts showing yearly cash flow transactions for each financial asset. Provides interactive sliders to quickly change the assumed rates and redraw the charts to show the result.
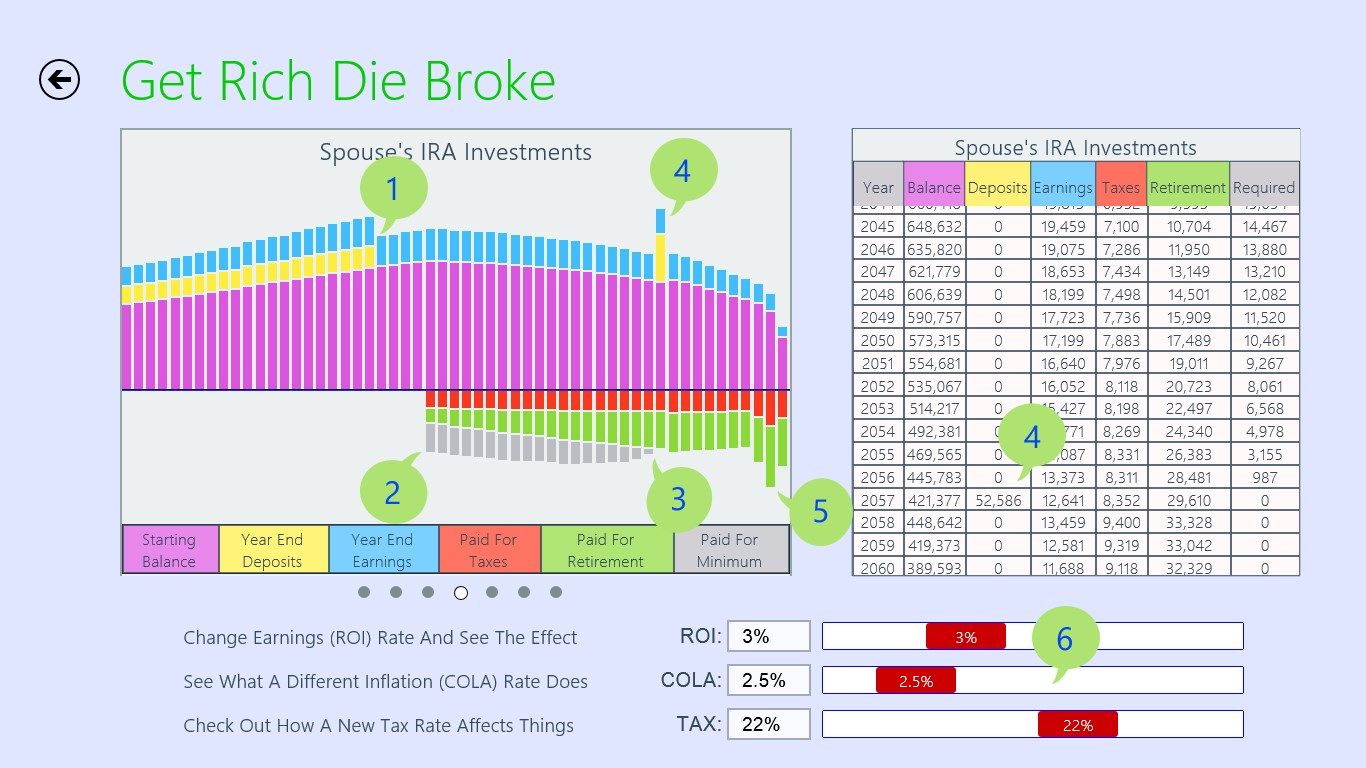
Featured are clearly noticeable yearly cash flow transactions as shown in the example chart above and noted below:
[1] Your spouse retires in year 2034 and stops making deposits into the IRA.
[2] Your spouse reaches age 70 1/2 in year 2038 and starts taking Required Minimum Distributions from the IRA. The distribution is more than enough to cover the balance of funds needed for retirement living expenses, so the excess (shown in grey) is deposited in the taxable account.
[3] The IRA account balance has been reduced so that the RMD from the account is not large enough to cover the balance of funds needed for retirement living expenses, so the taxable account begins to provide funds again.
[4] When you die in year 2057, your spouse inherits your IRA account balance, without tax consequences.
[5] The taxable account runs out of money in 2065, so in years 2065, 2066, and 2067, your spouse’s IRA solely supplements the pension and social security payments to cover the balance of funds needed for retirement living expenses. The IRA is depleted the year your spouse dies in 2067.
-
Charts of yearly cash flow transactions for each financial asset.
-
Quick interactive "what-if" experiments with different rates.
-
Allows for different financial assets for you and your spouse.
