

Graph Visualization for HoloLens
Description
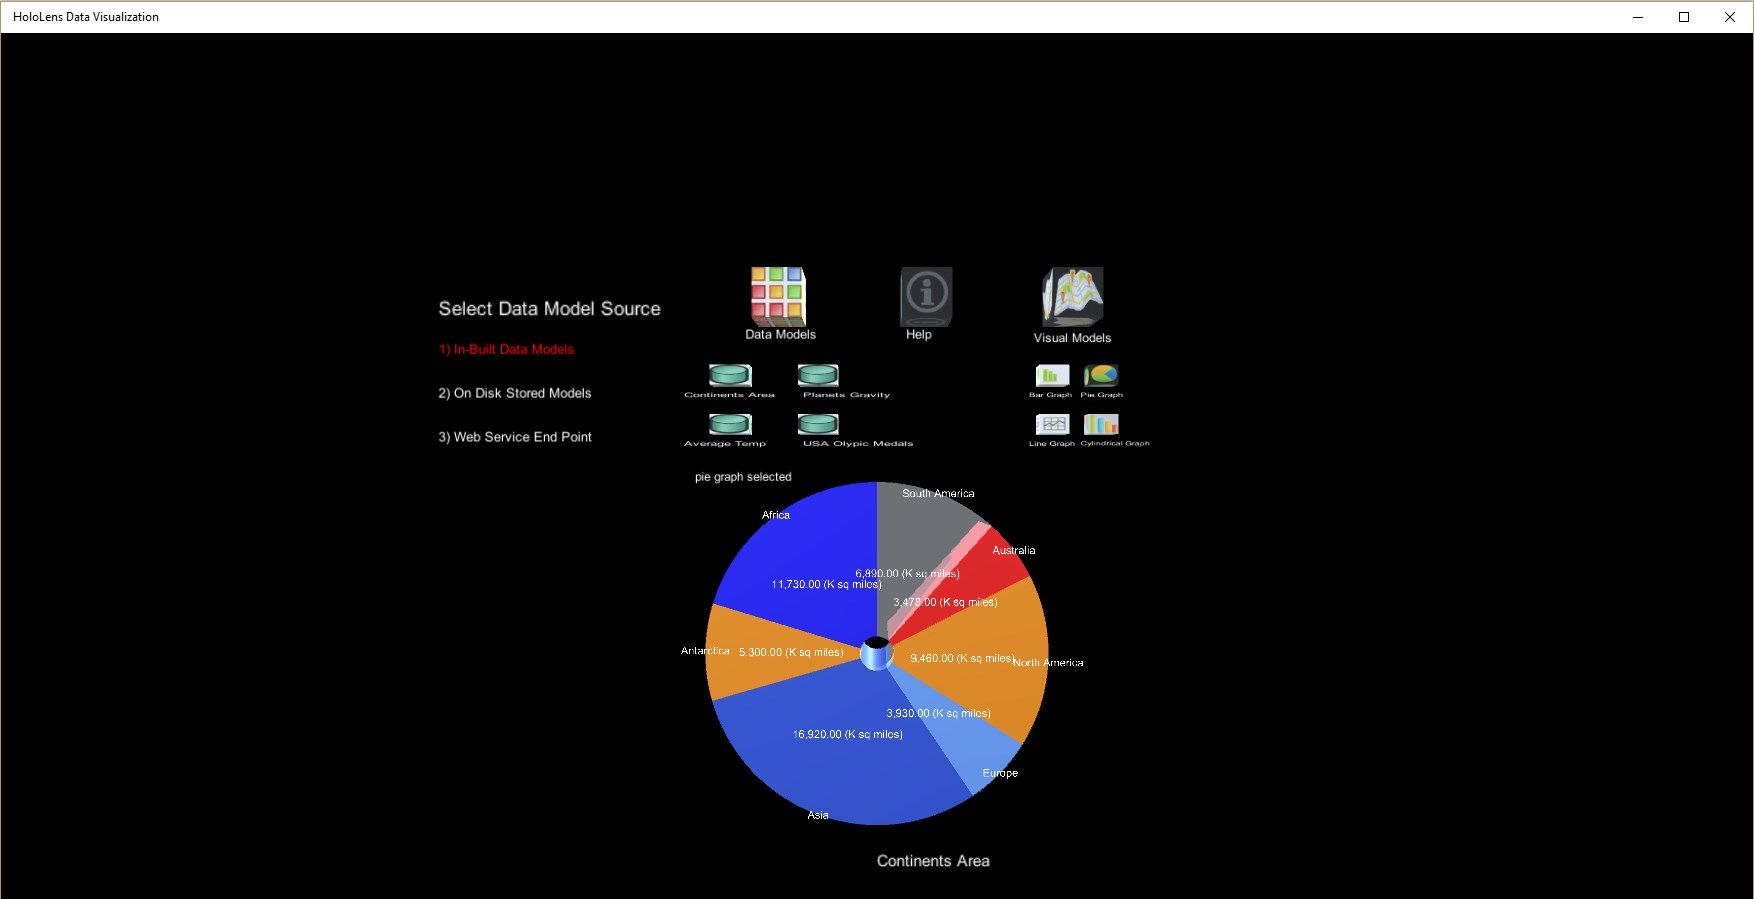
Graph Visualization for HoloLens application allow user to render the graphs in 3D.
Application works both for HoloLens and Desktop devices.
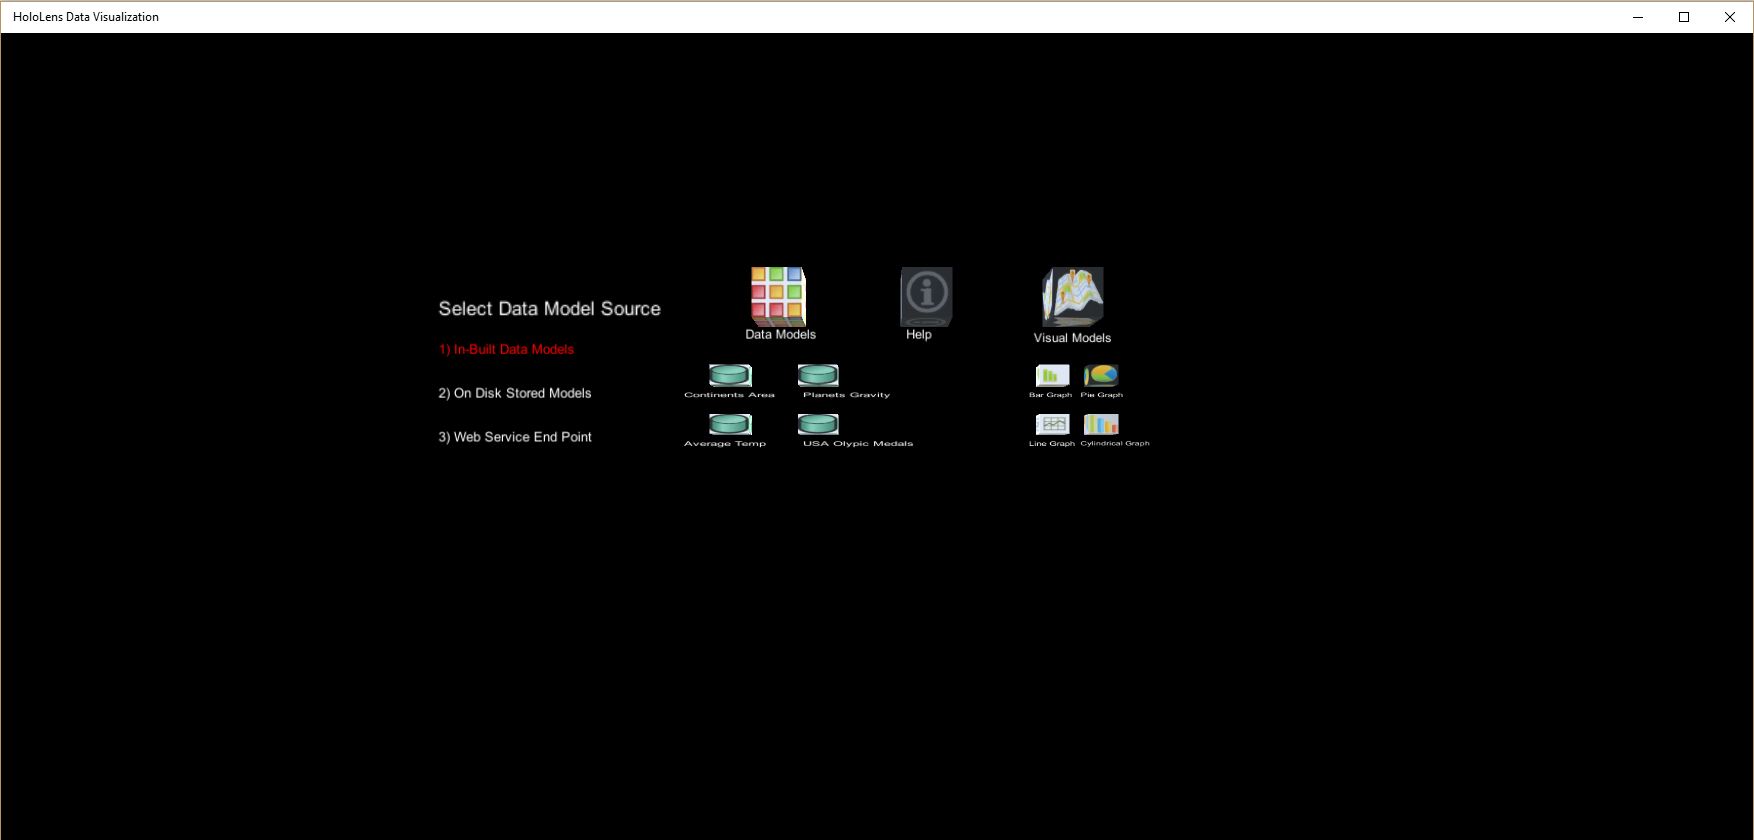
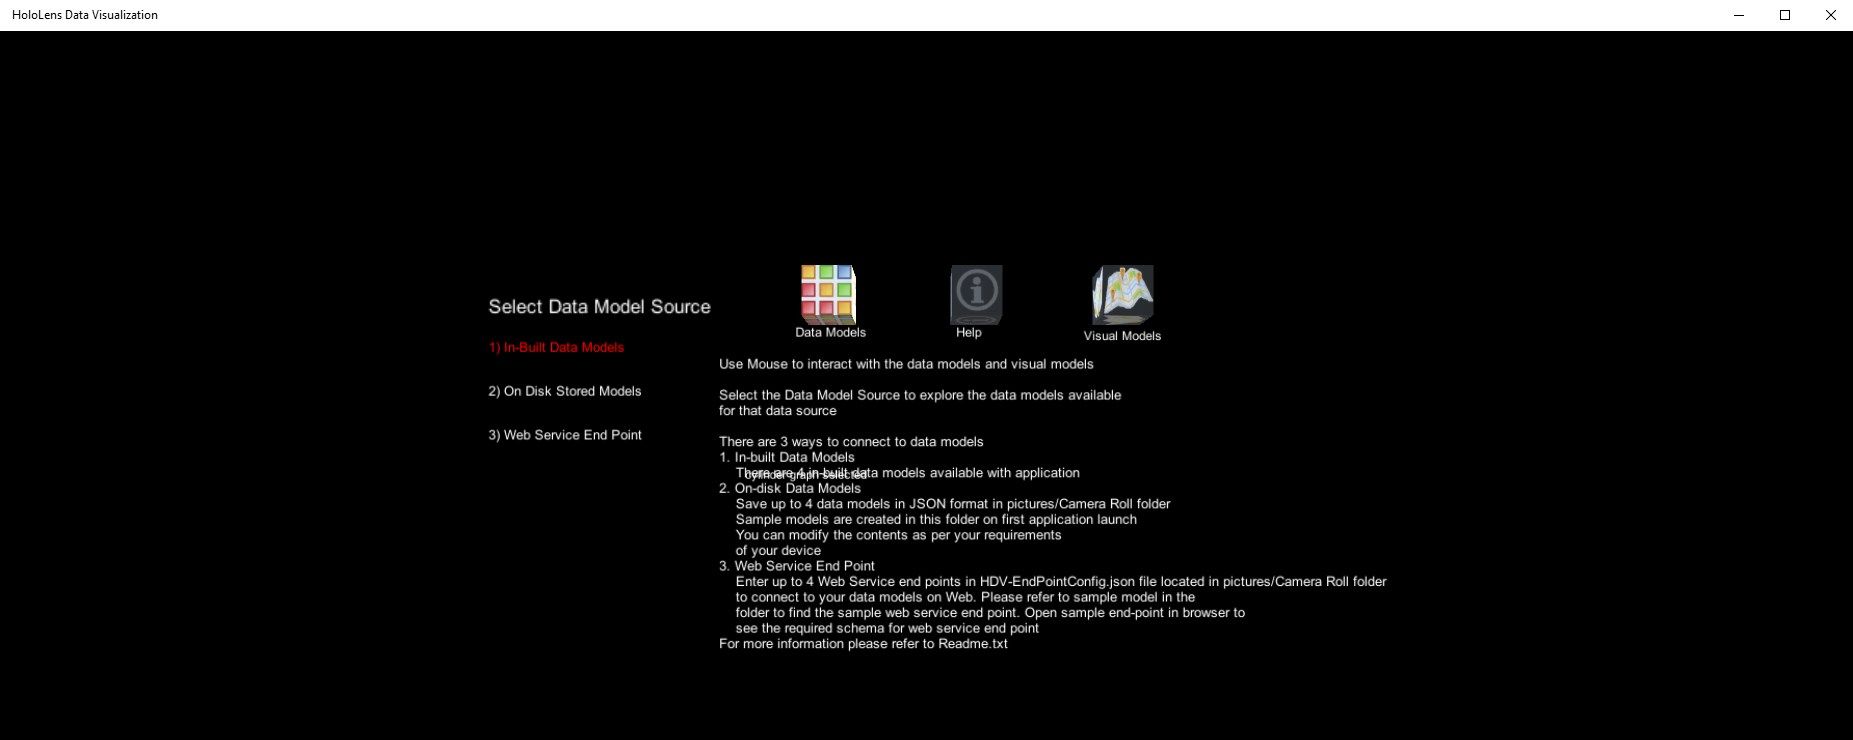
User can select data from 3 different data sources:
- Web Service End Point
- JASON file stored on disk
- Built-In Data Model
There are 4 built-in visualization models that can be used to visualize data
- Bar Graph
- Pie Graph
- Linear Graph
- Cylindrical Graph
Product ID:
9P546T747Q3B
Release date:
2017-04-27
Last update:
2022-03-12