
Description
HoloLens Data Visualization application helps in visualizing the data in 3D world. User can interact with data models using HoloLens gestures, voice commands and mouse (for desktop users).
HoloLens Mode
Use gaze to focus an object and use either air tap
or ‘Next’ voice command to interact with selected object
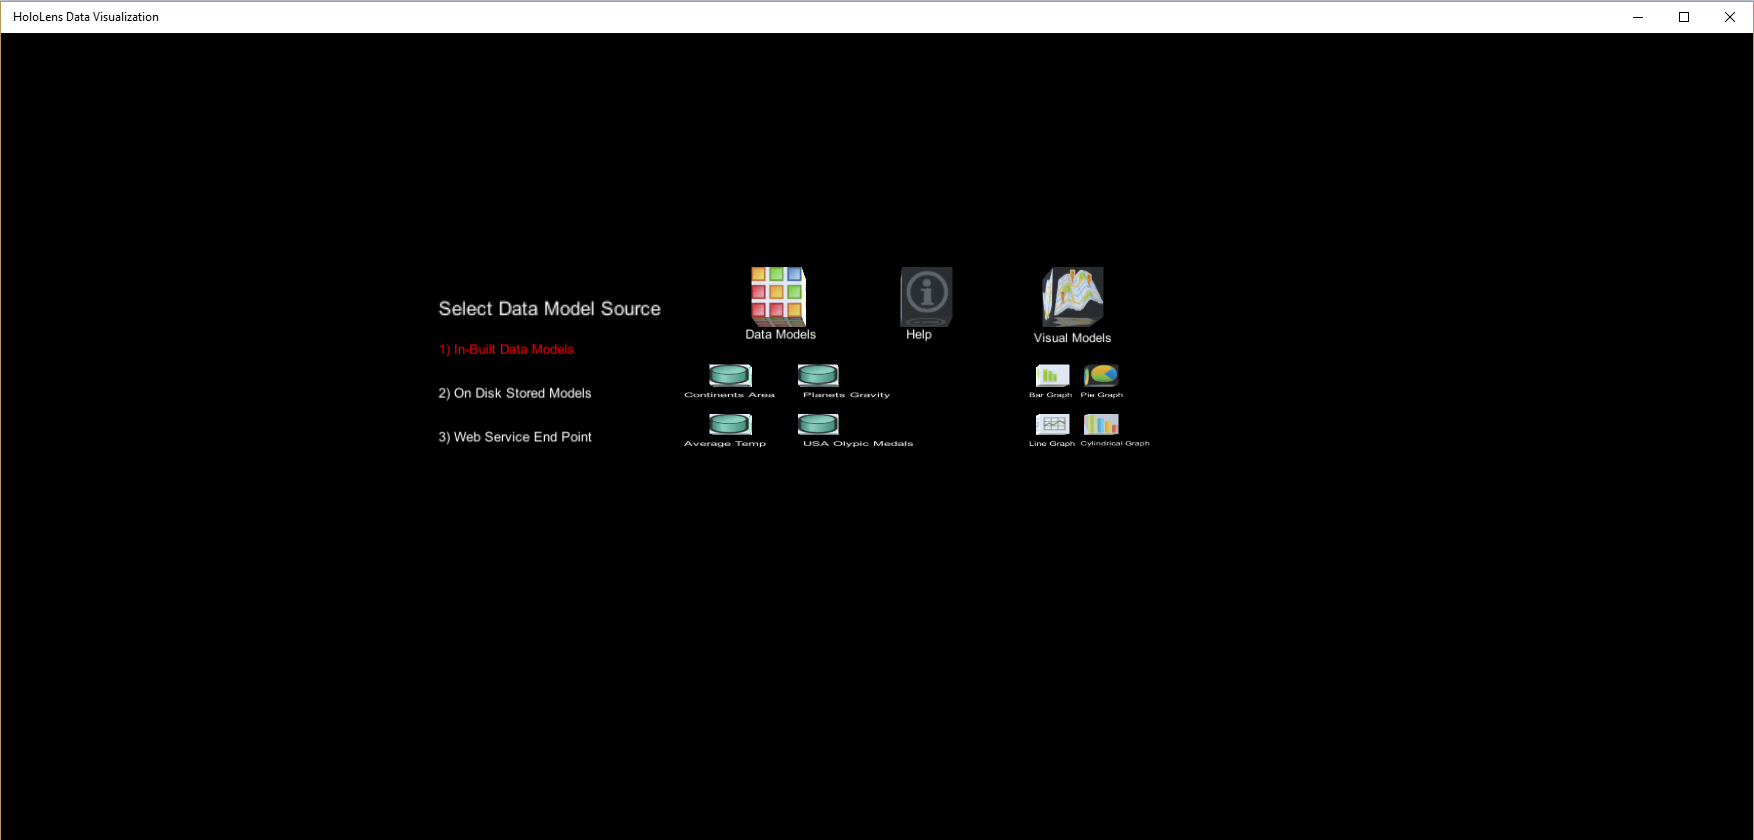
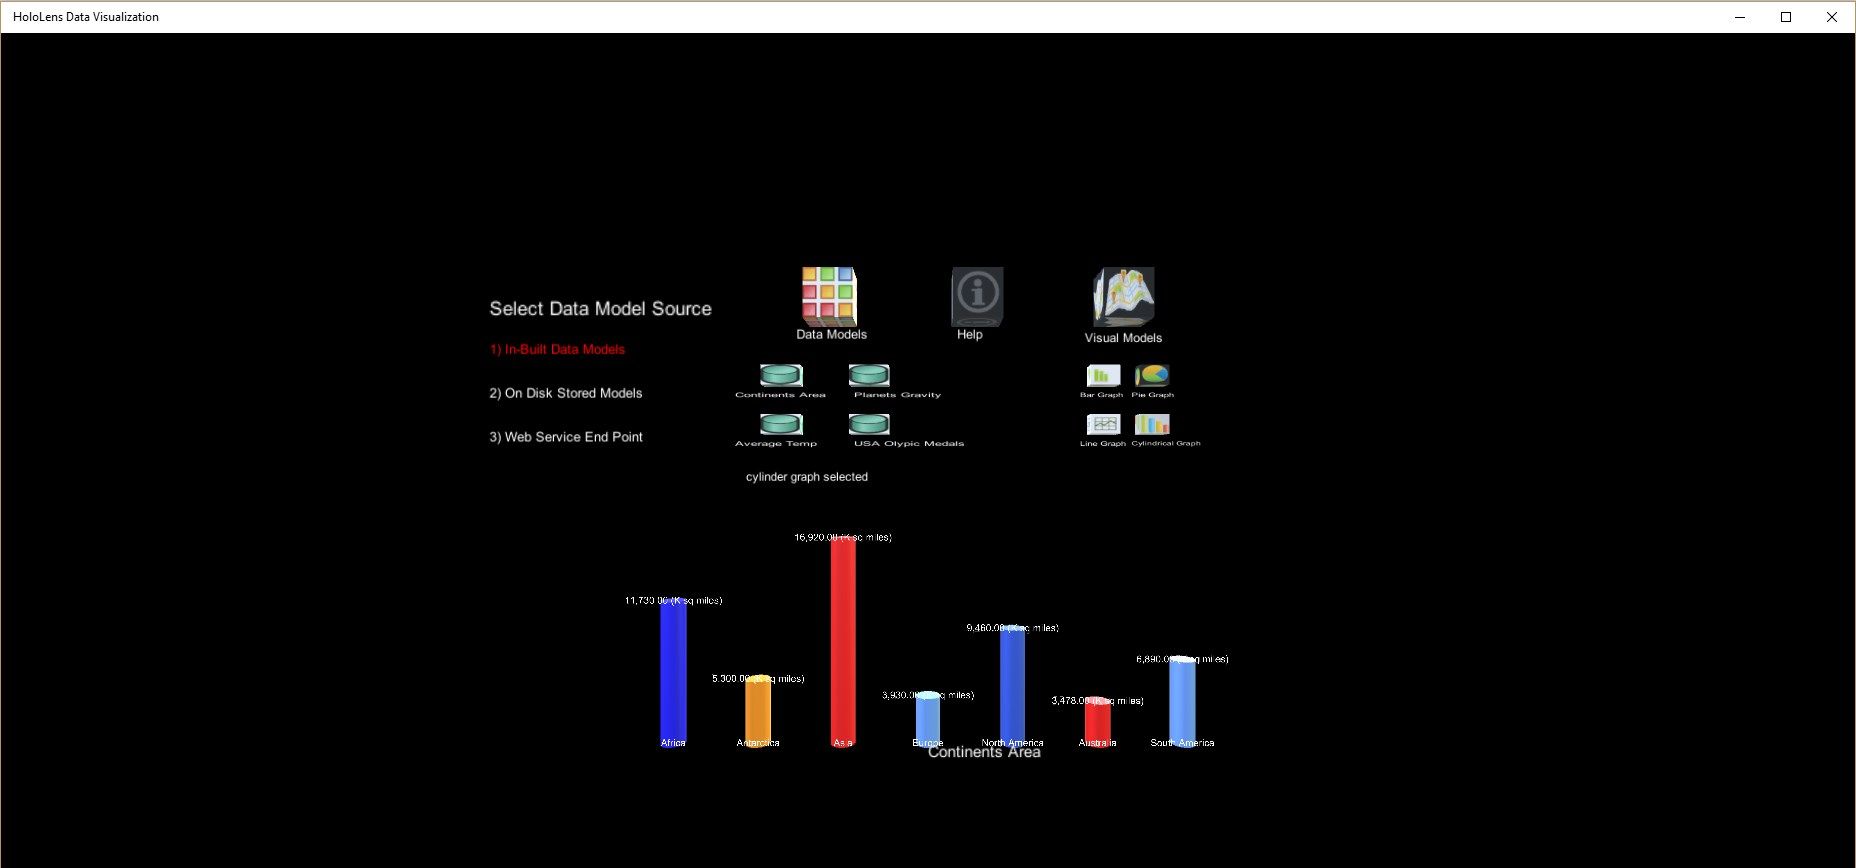
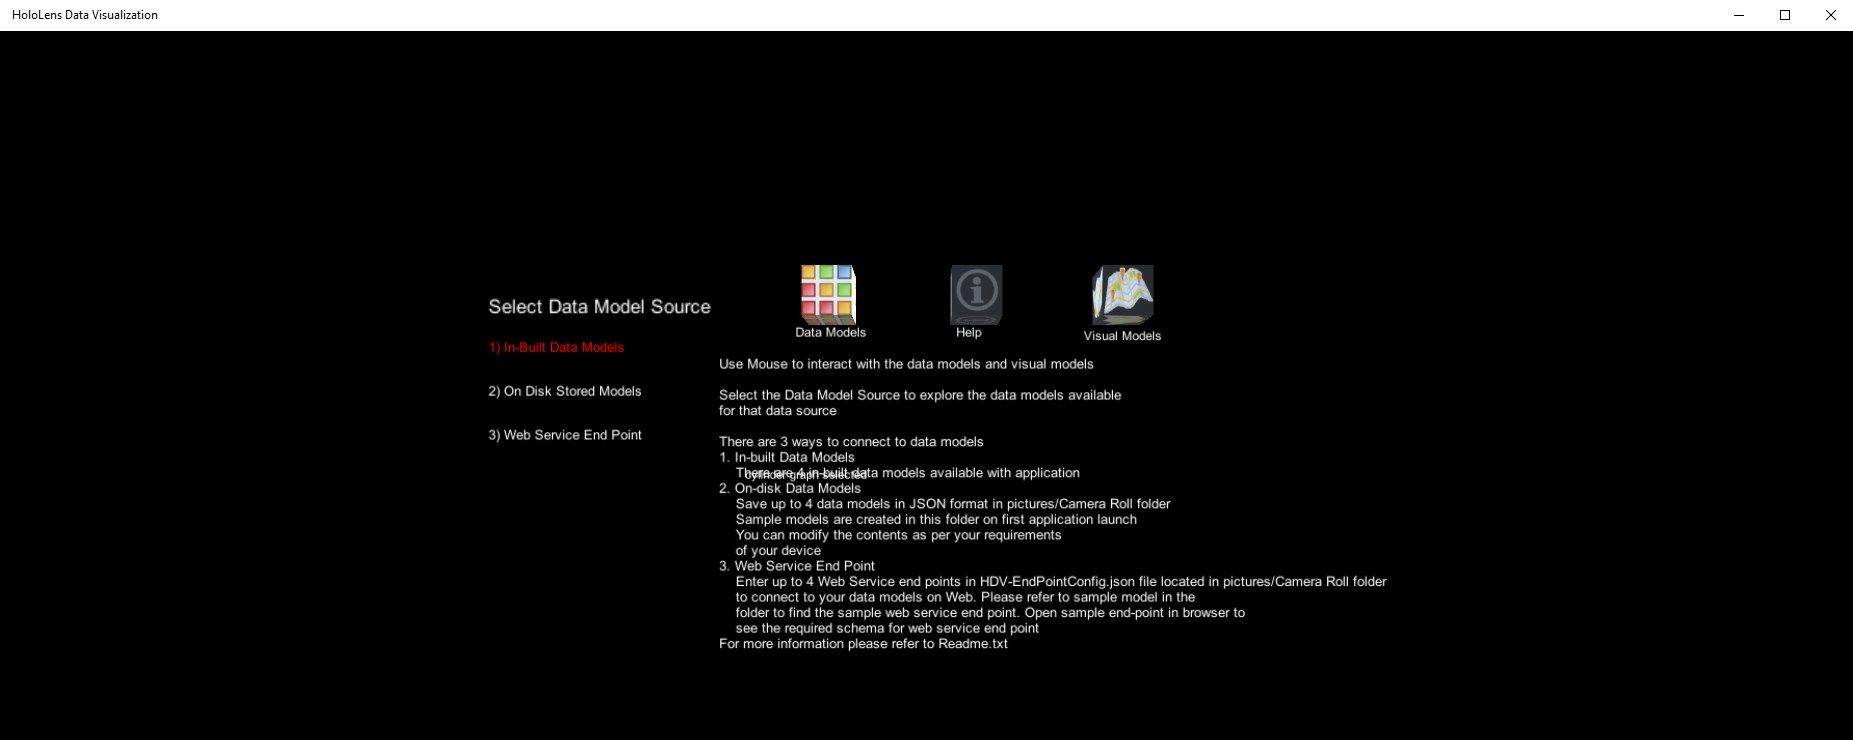
Select the Data Model Source to explore the data models available
for that data source
There are 3 ways to connect to data models
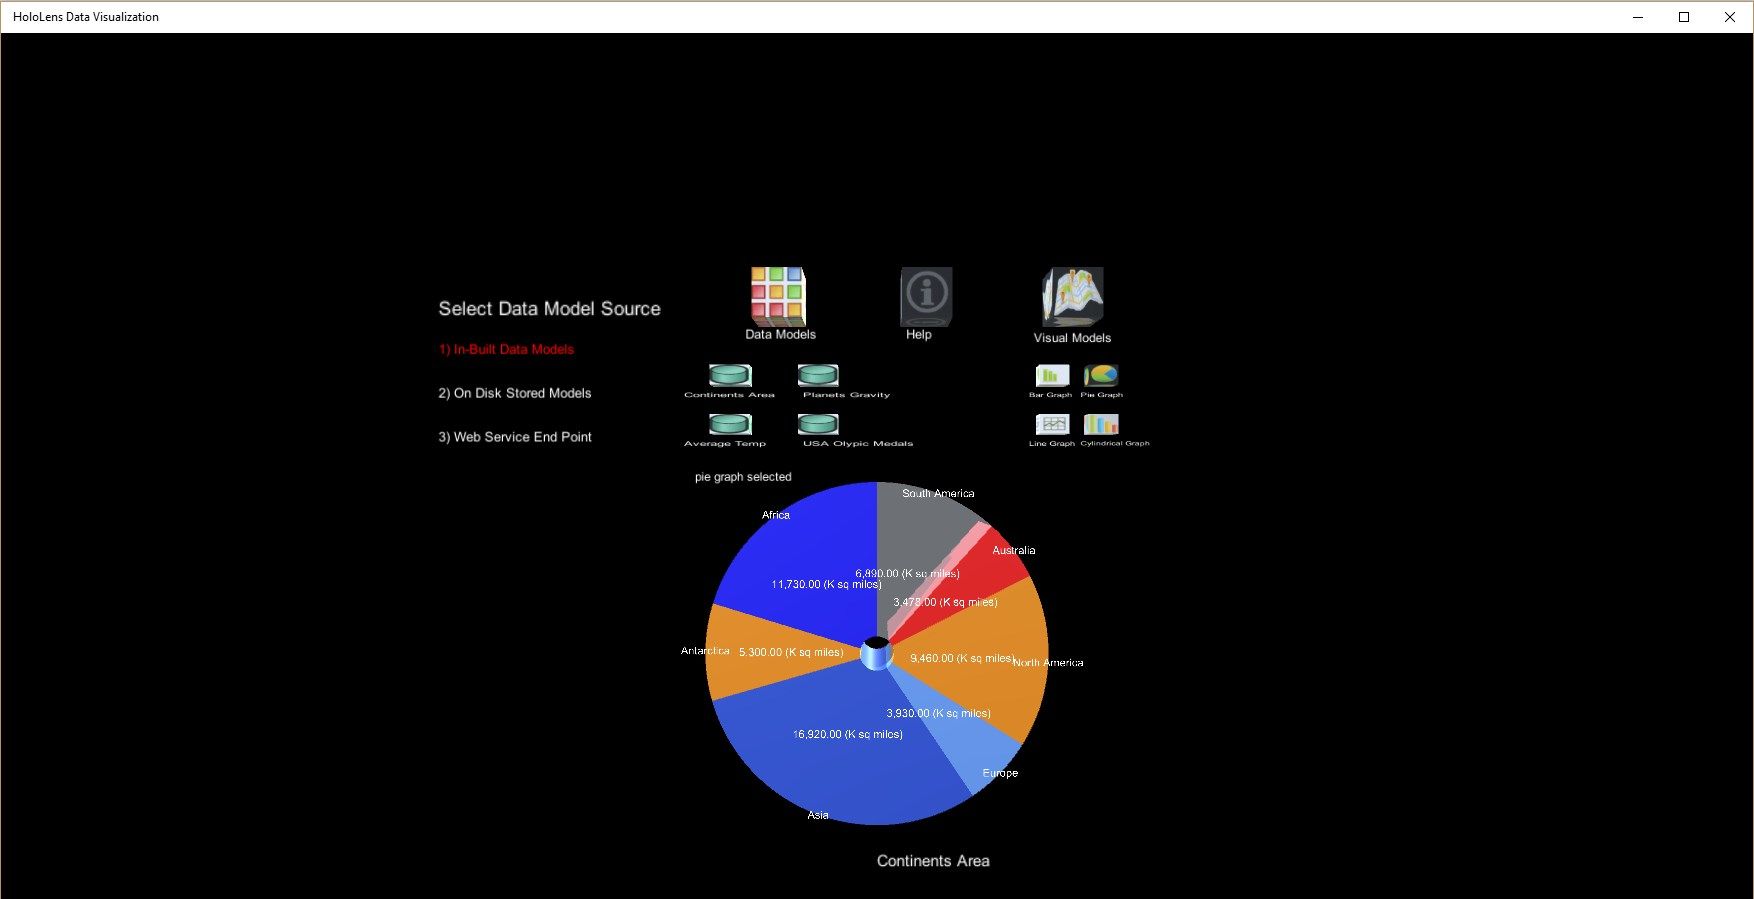
- In-built Data Models
There are 4 in-built data models available with application - On-disk Data Models
Save up to 4 data models in JSON format in pictures/Camera Roll folder
Sample models are created in this folder on first application launch
You can modify the contents as per your requirements of your device - Web Service End Point
Enter up to 4 Web Service end points in HDV-EndPointConfig.json file located in pictures/Camera Roll folder
to connect to your data models on Web. Please refer to sample model in the
folder to find the sample web service end point. Open sample end-point in browser to
see the required schema for web service end point
Desktop Mode
Use Mouse to interact with the data models and visual models
Select the Data Model Source to explore the data models available
for that data source
There are 3 ways to connect to data models
- In-built Data Models
There are 4 in-built data models available with application - On-disk Data Models
Save up to 4 data models in JSON format in pictures/Camera Roll folder
Sample models are created in this folder on first application launch
You can modify the contents as per your requirements of your device - Web Service End Point
Enter up to 4 Web Service end points in HDV-EndPointConfig.json file located in pictures/Camera Roll folder
to connect to your data models on Web. Please refer to sample model in the
folder to find the sample web service end point. Open sample end-point in browser to
see the required schema for web service end point
GraphDefinition Schema
{
“DisplayName”:“”,
“XAxis”:“”,
“YAxis”:“”,
“ShowDataLabels”:“”,
“DefaultVisualModel”:“”,
“Names”:[],
“Values”:[]
}
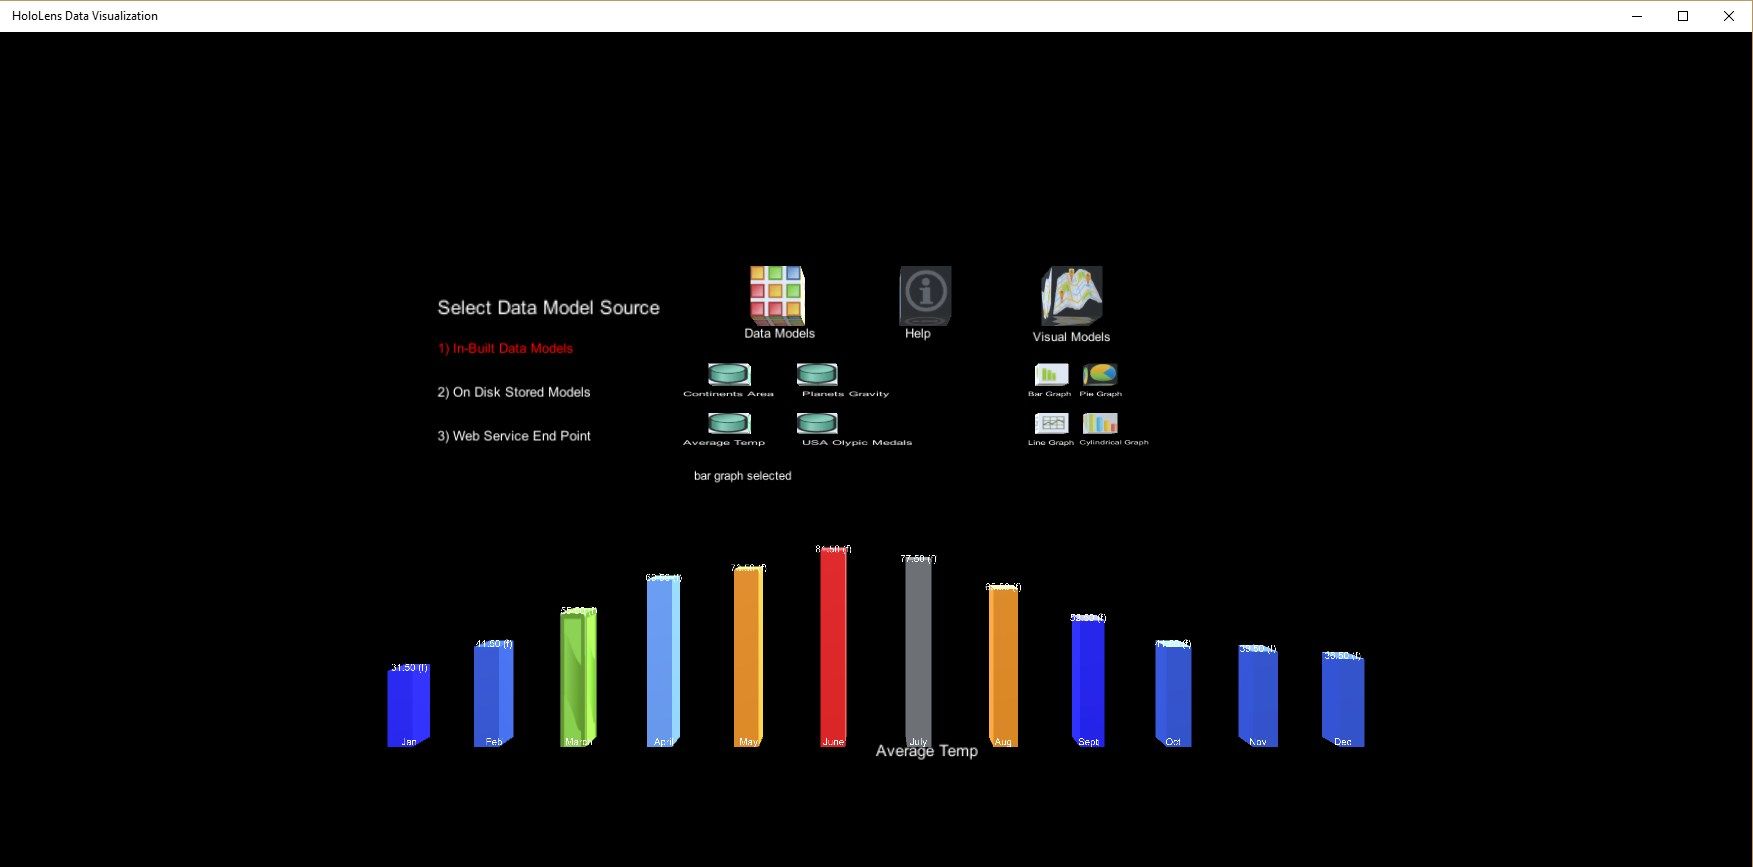
GraphDefinition Schema Example
{
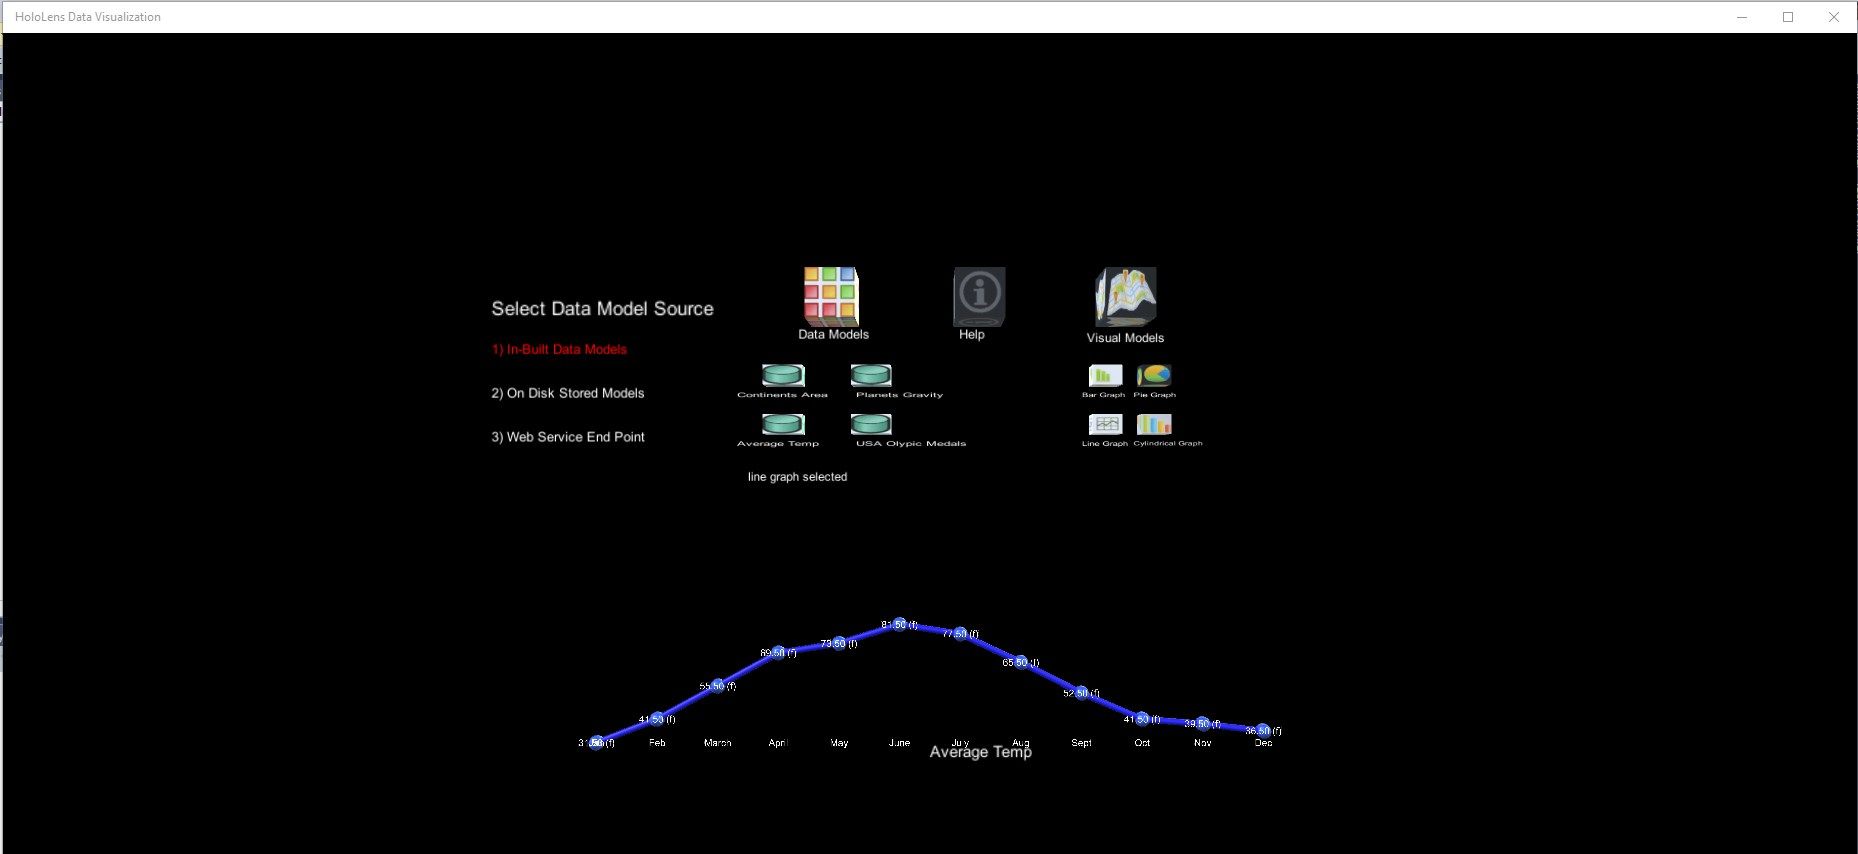
“DisplayName”:“Average Temp”,
“XAxis”:“month”,
“YAxis”:“tem(f)”,
“ShowDataLabels”:“true”,
“DefaultVisualModel”:“Cylinder”,
“Names”:[
“Jan”,
“Feb”,
“March”,
“April”,
“May”,
“June”,
“July”,
“Aug”,
“Sept”,
“Oct”,
“Nov”,
“Dec”
],
“Values”:[
“31.5”,
“41.5”,
“55.5”,
“69.5”,
“73.5”,
“81.5”,
“77.5”,
“65.5”,
“52.5”,
“41.5”,
“39.5”,
“36.5”
]
}