

LabPlot
Description
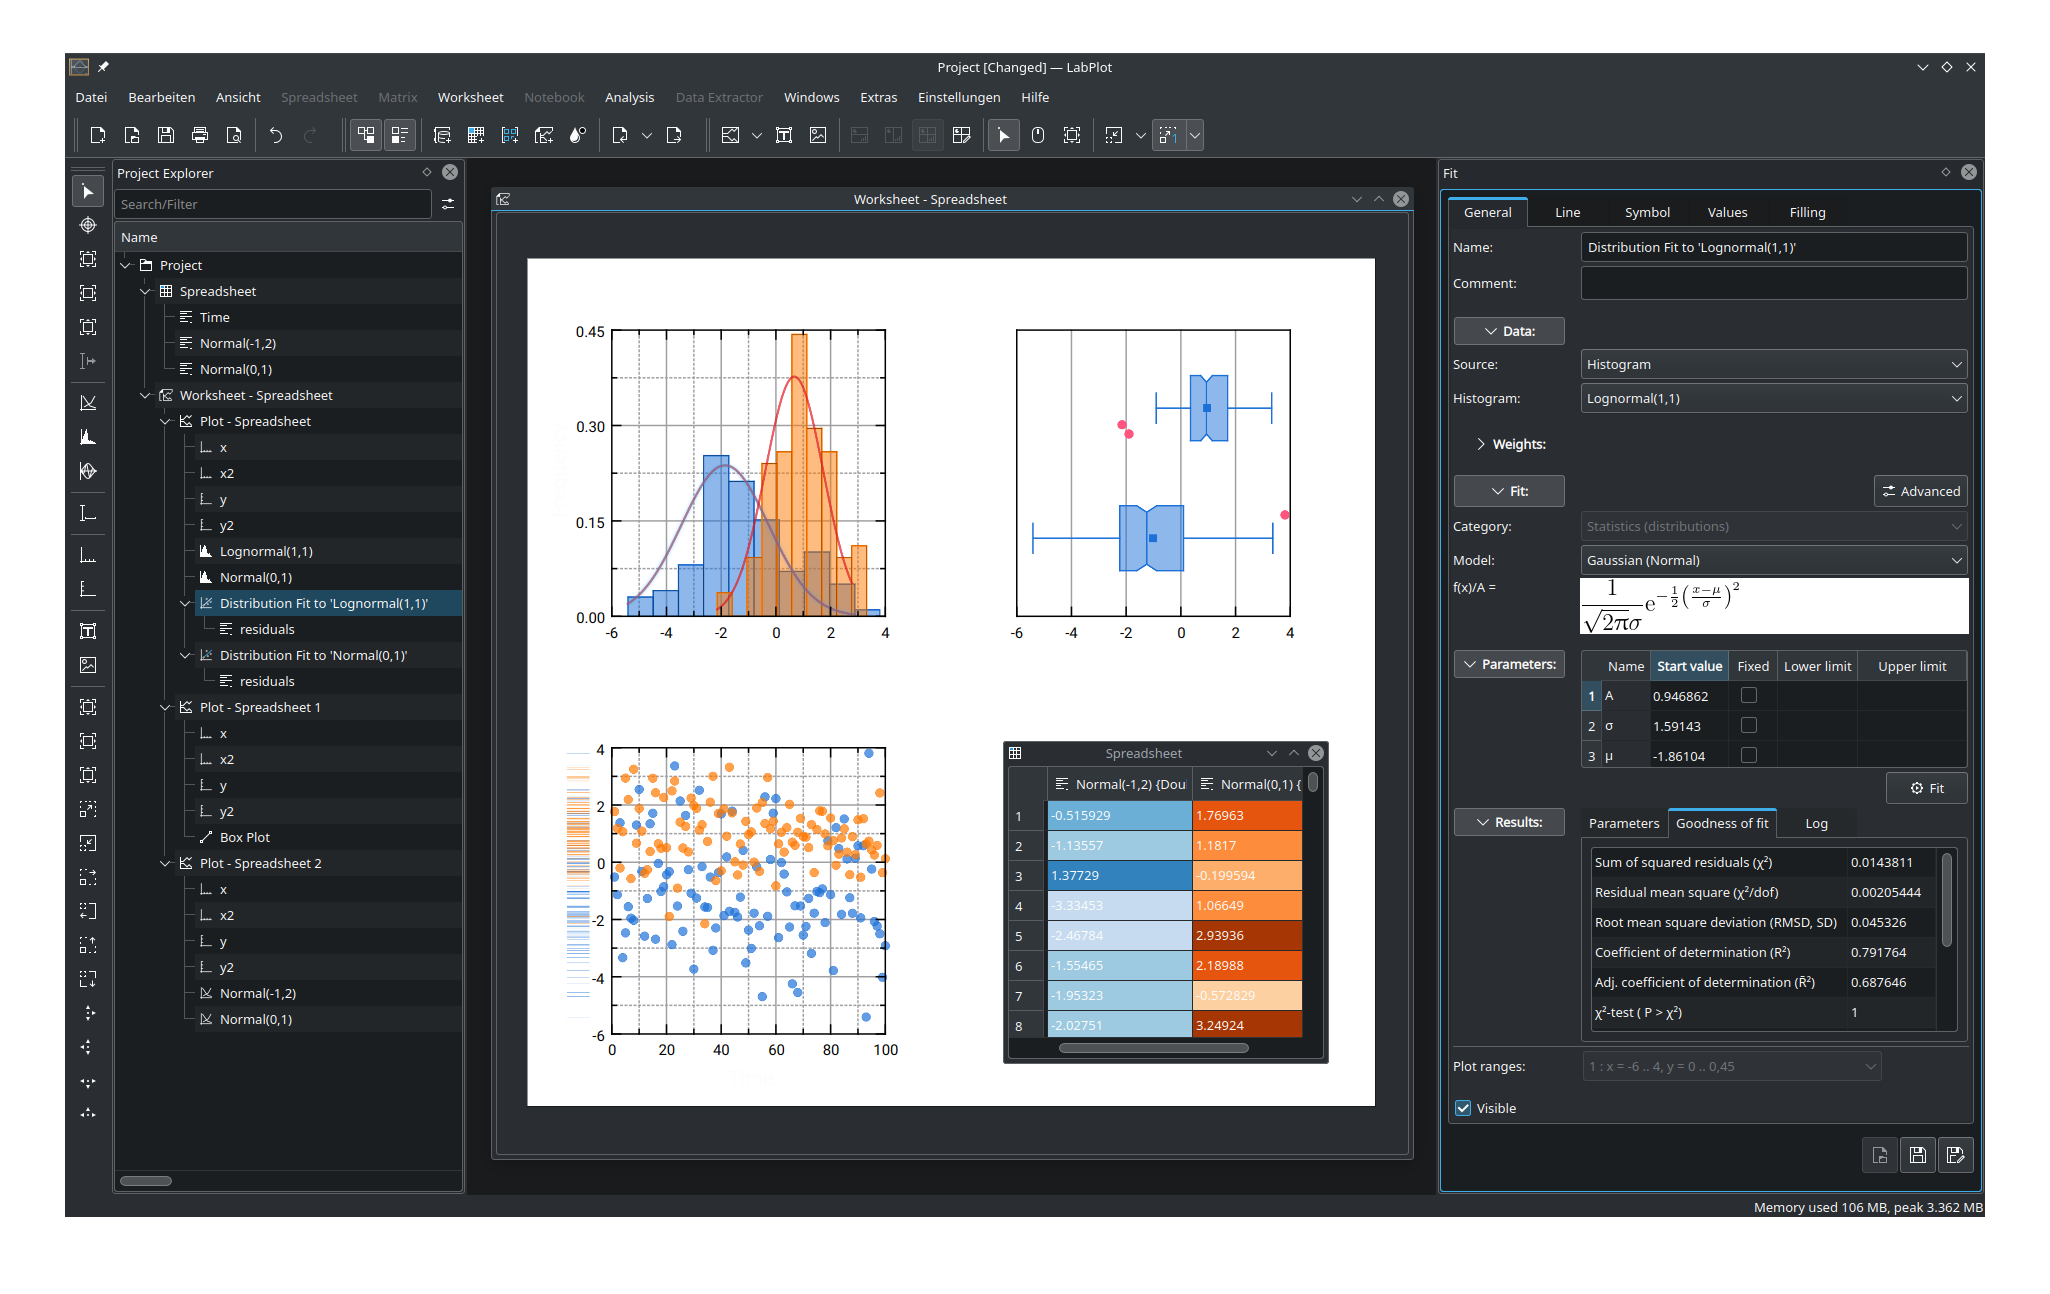
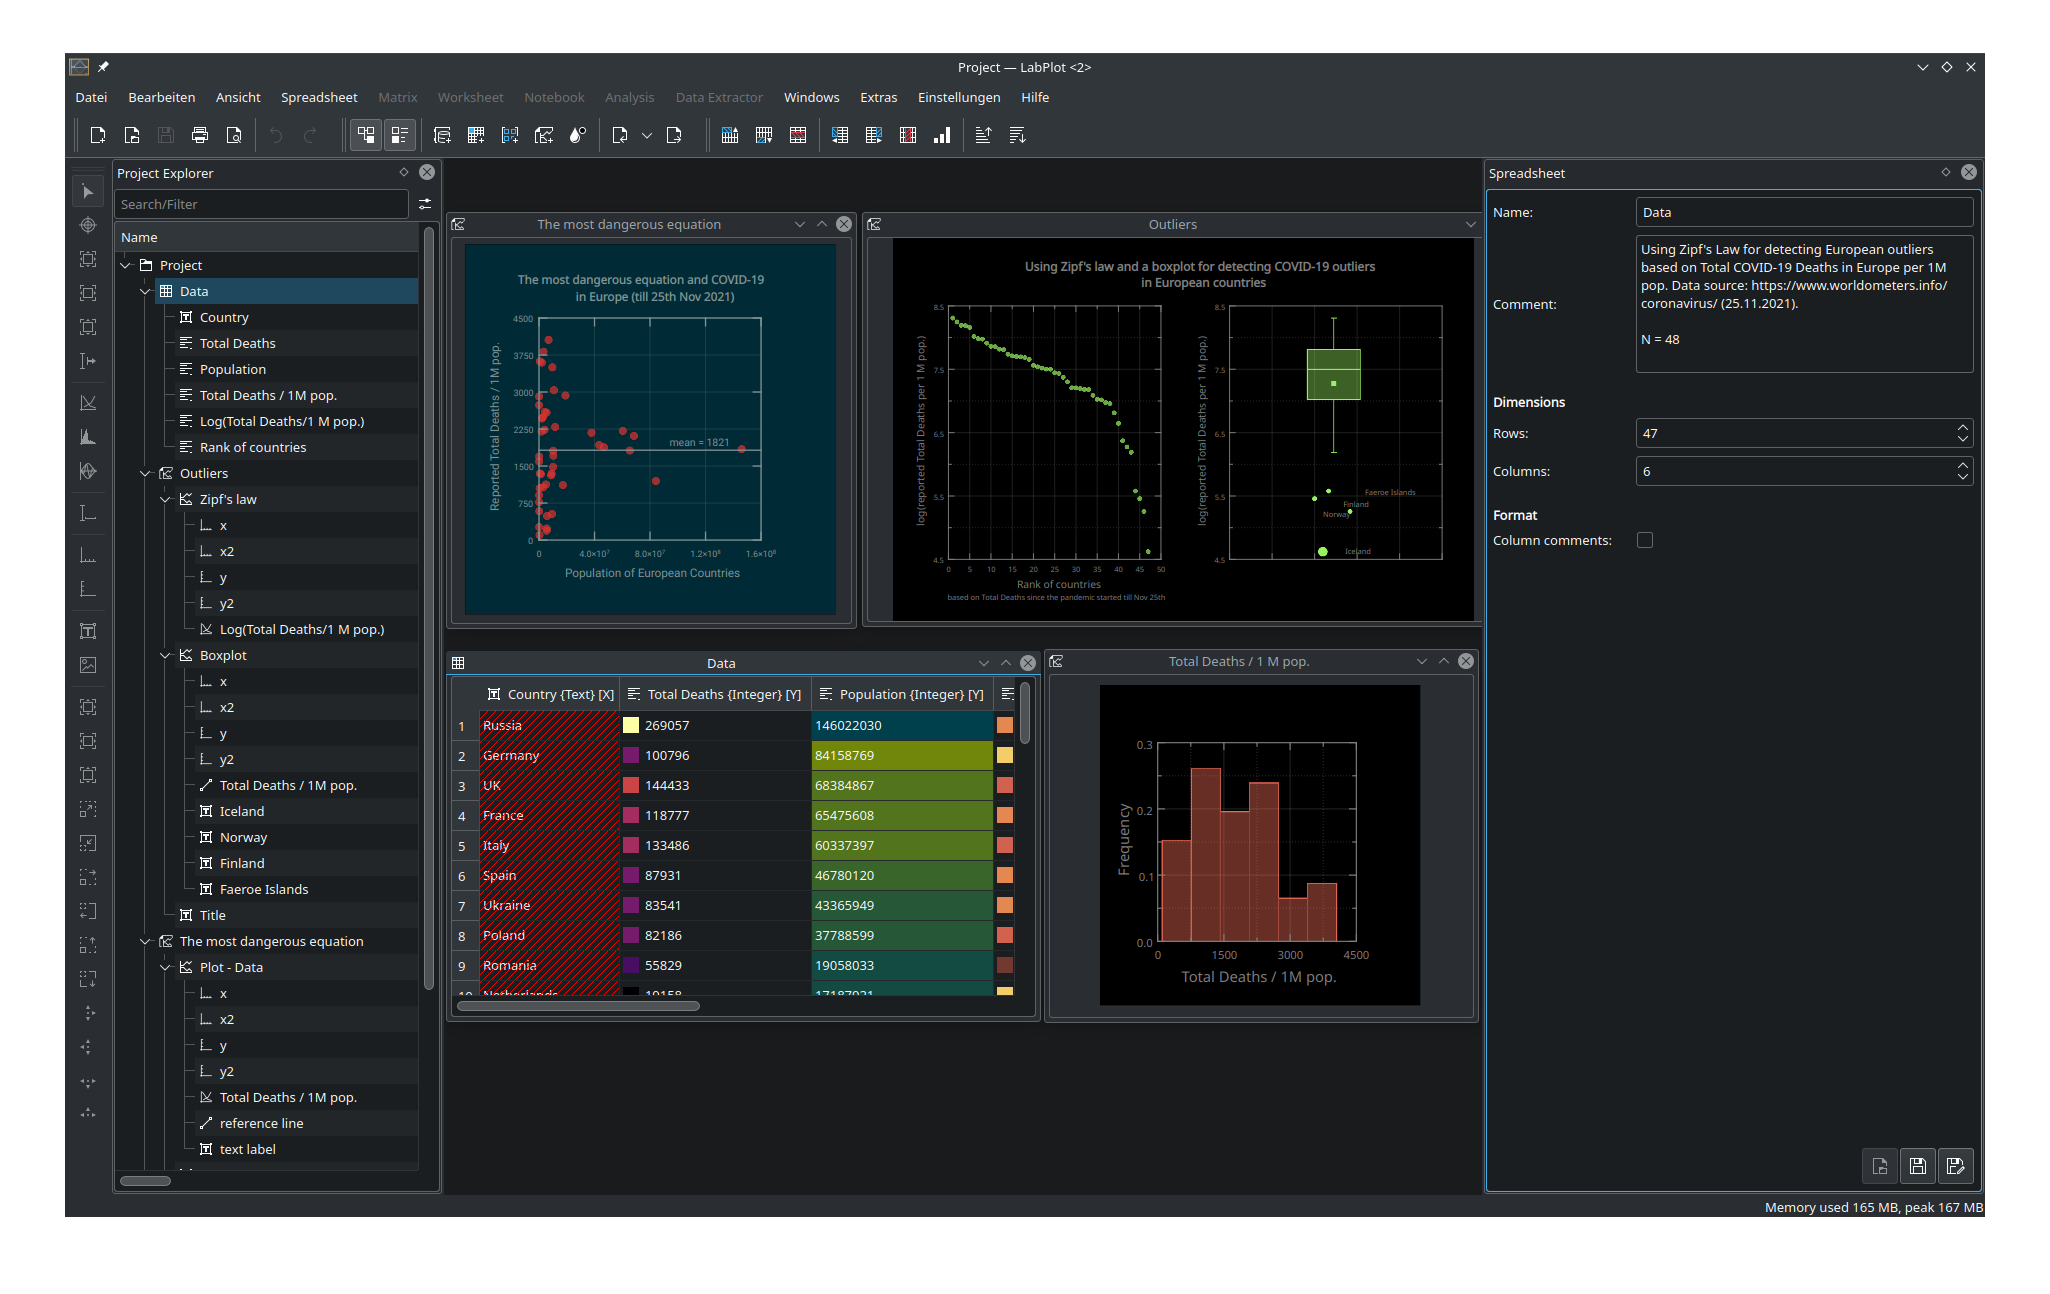
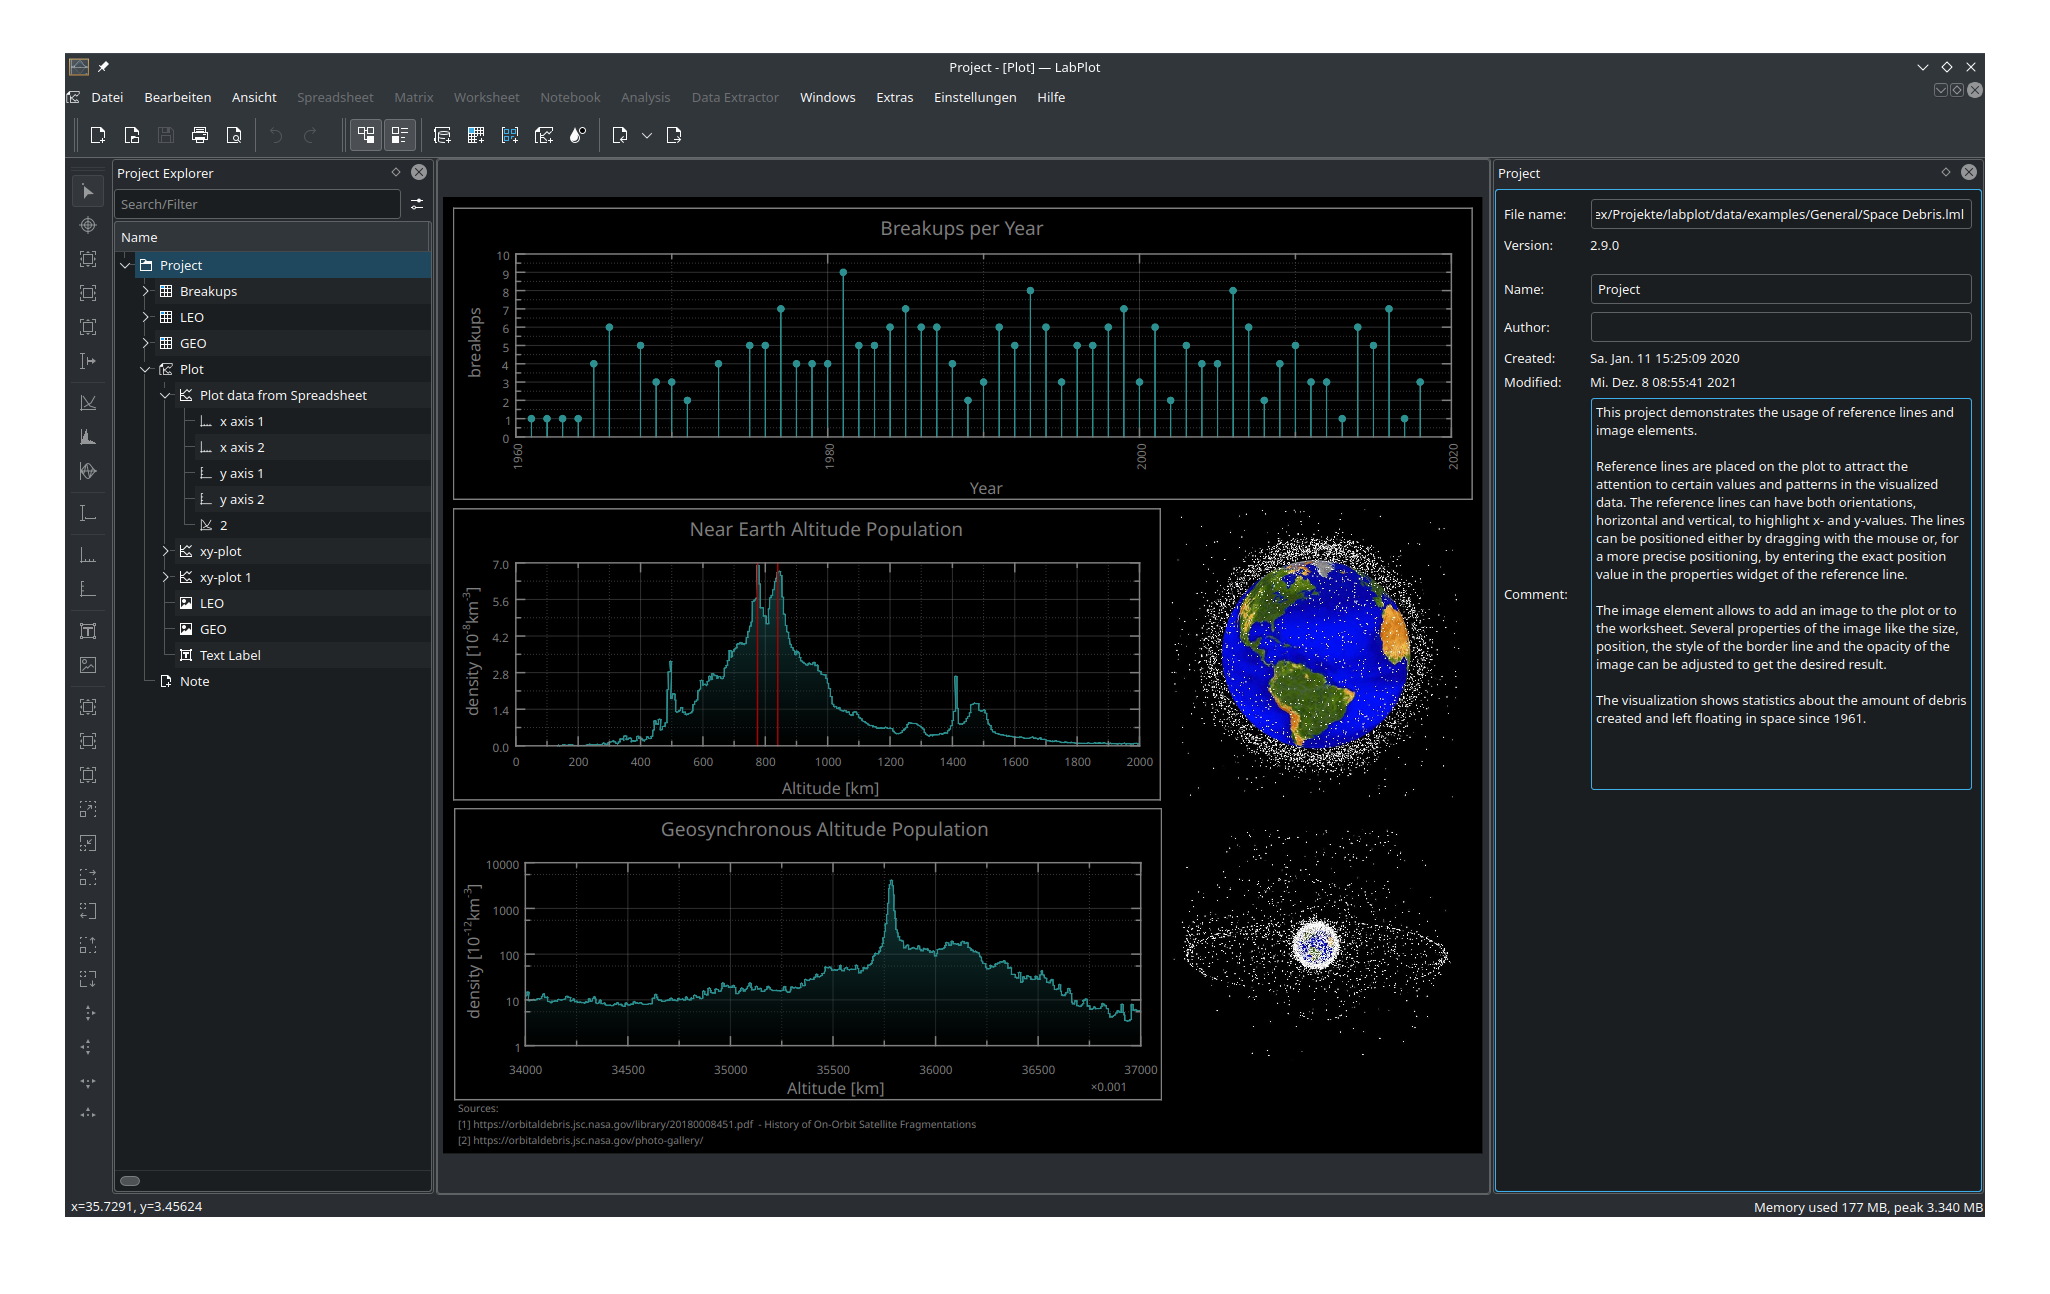
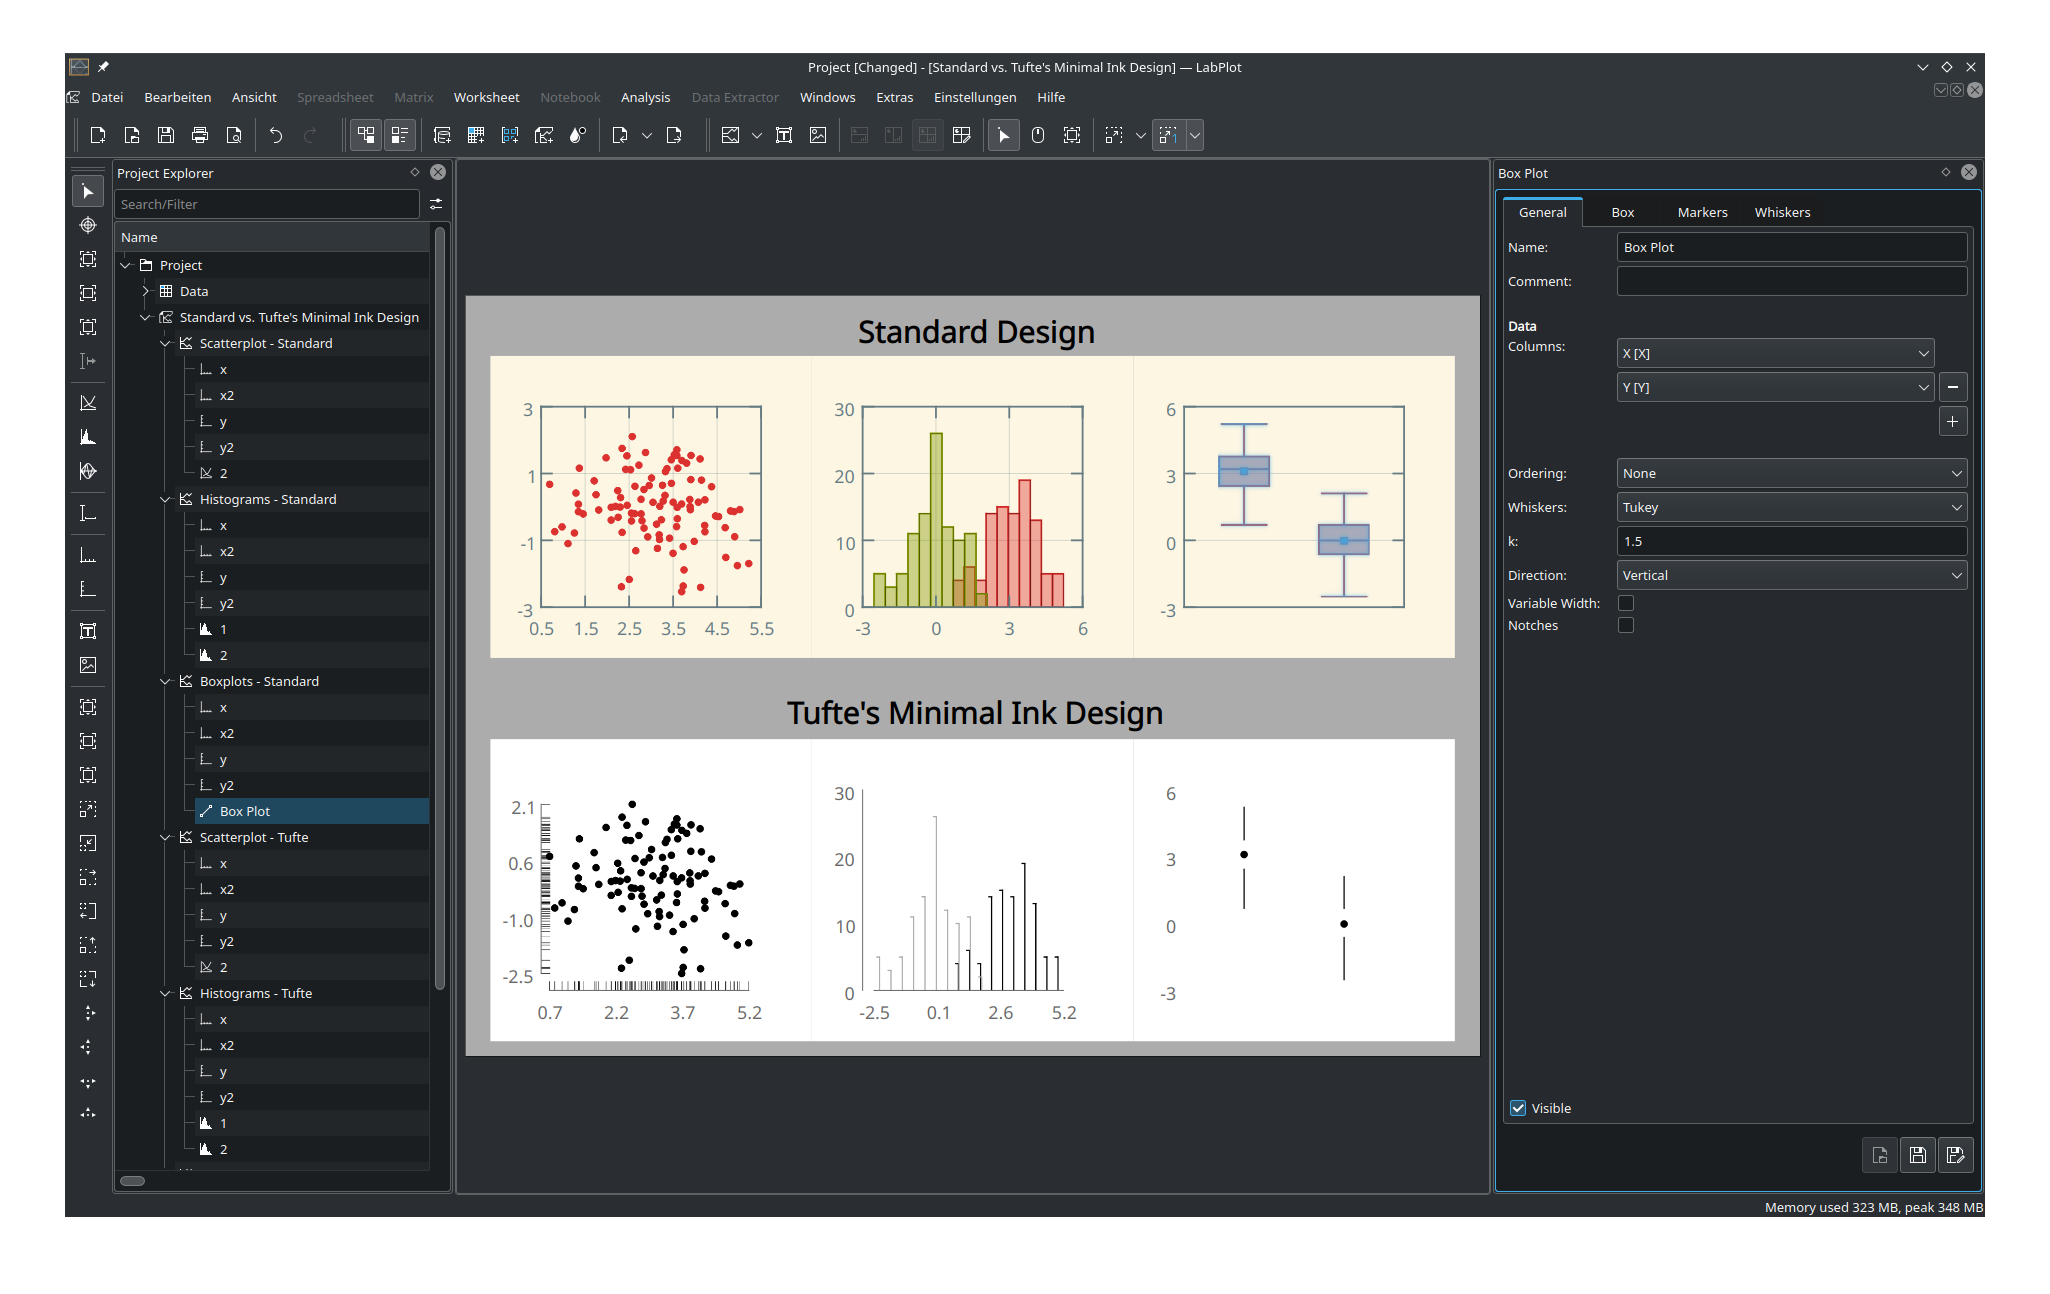
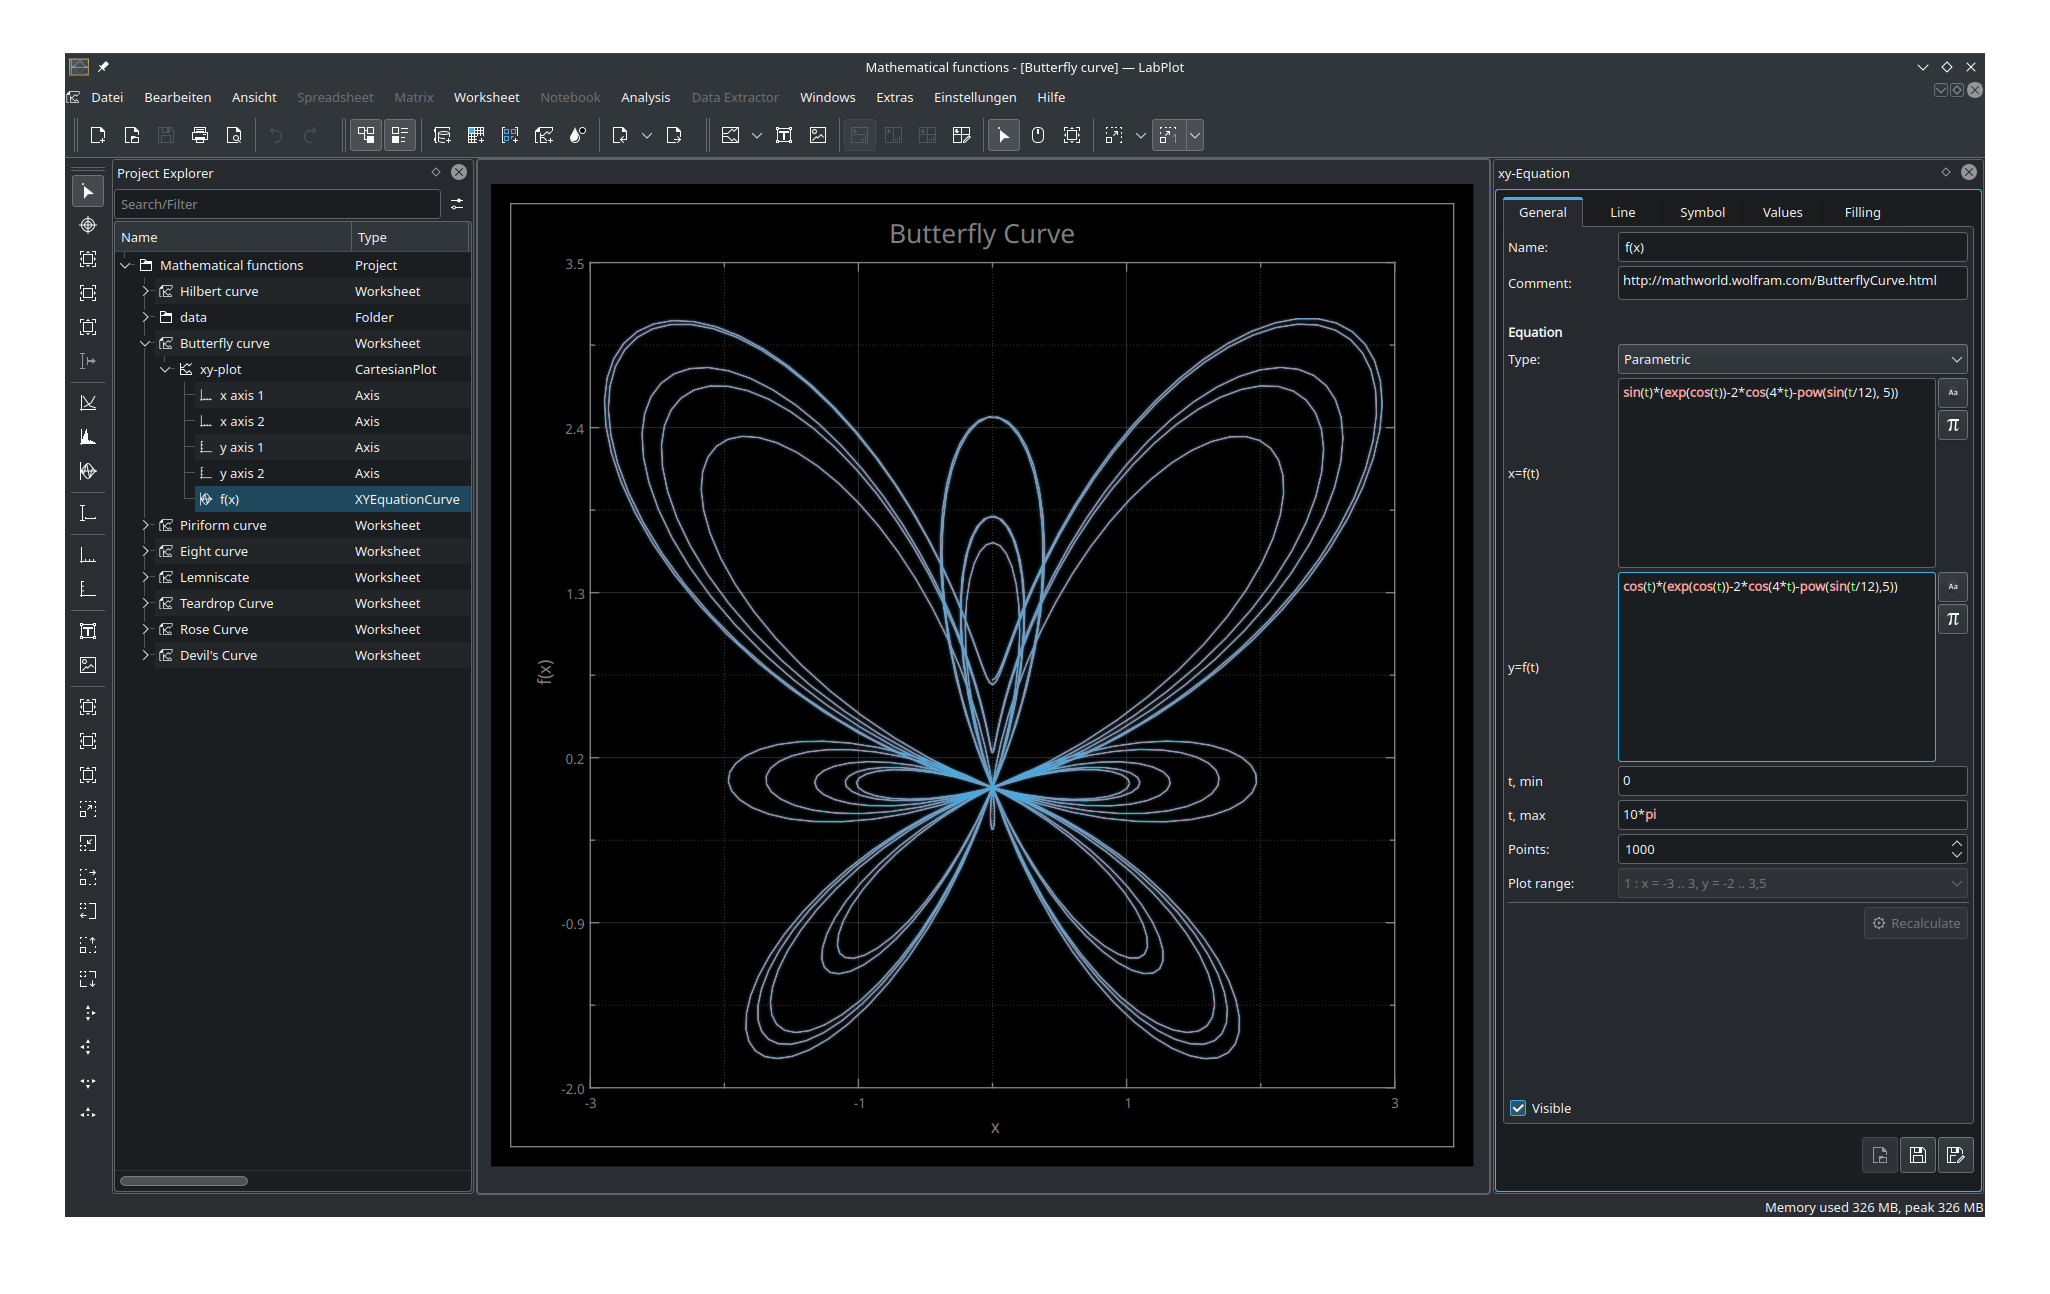
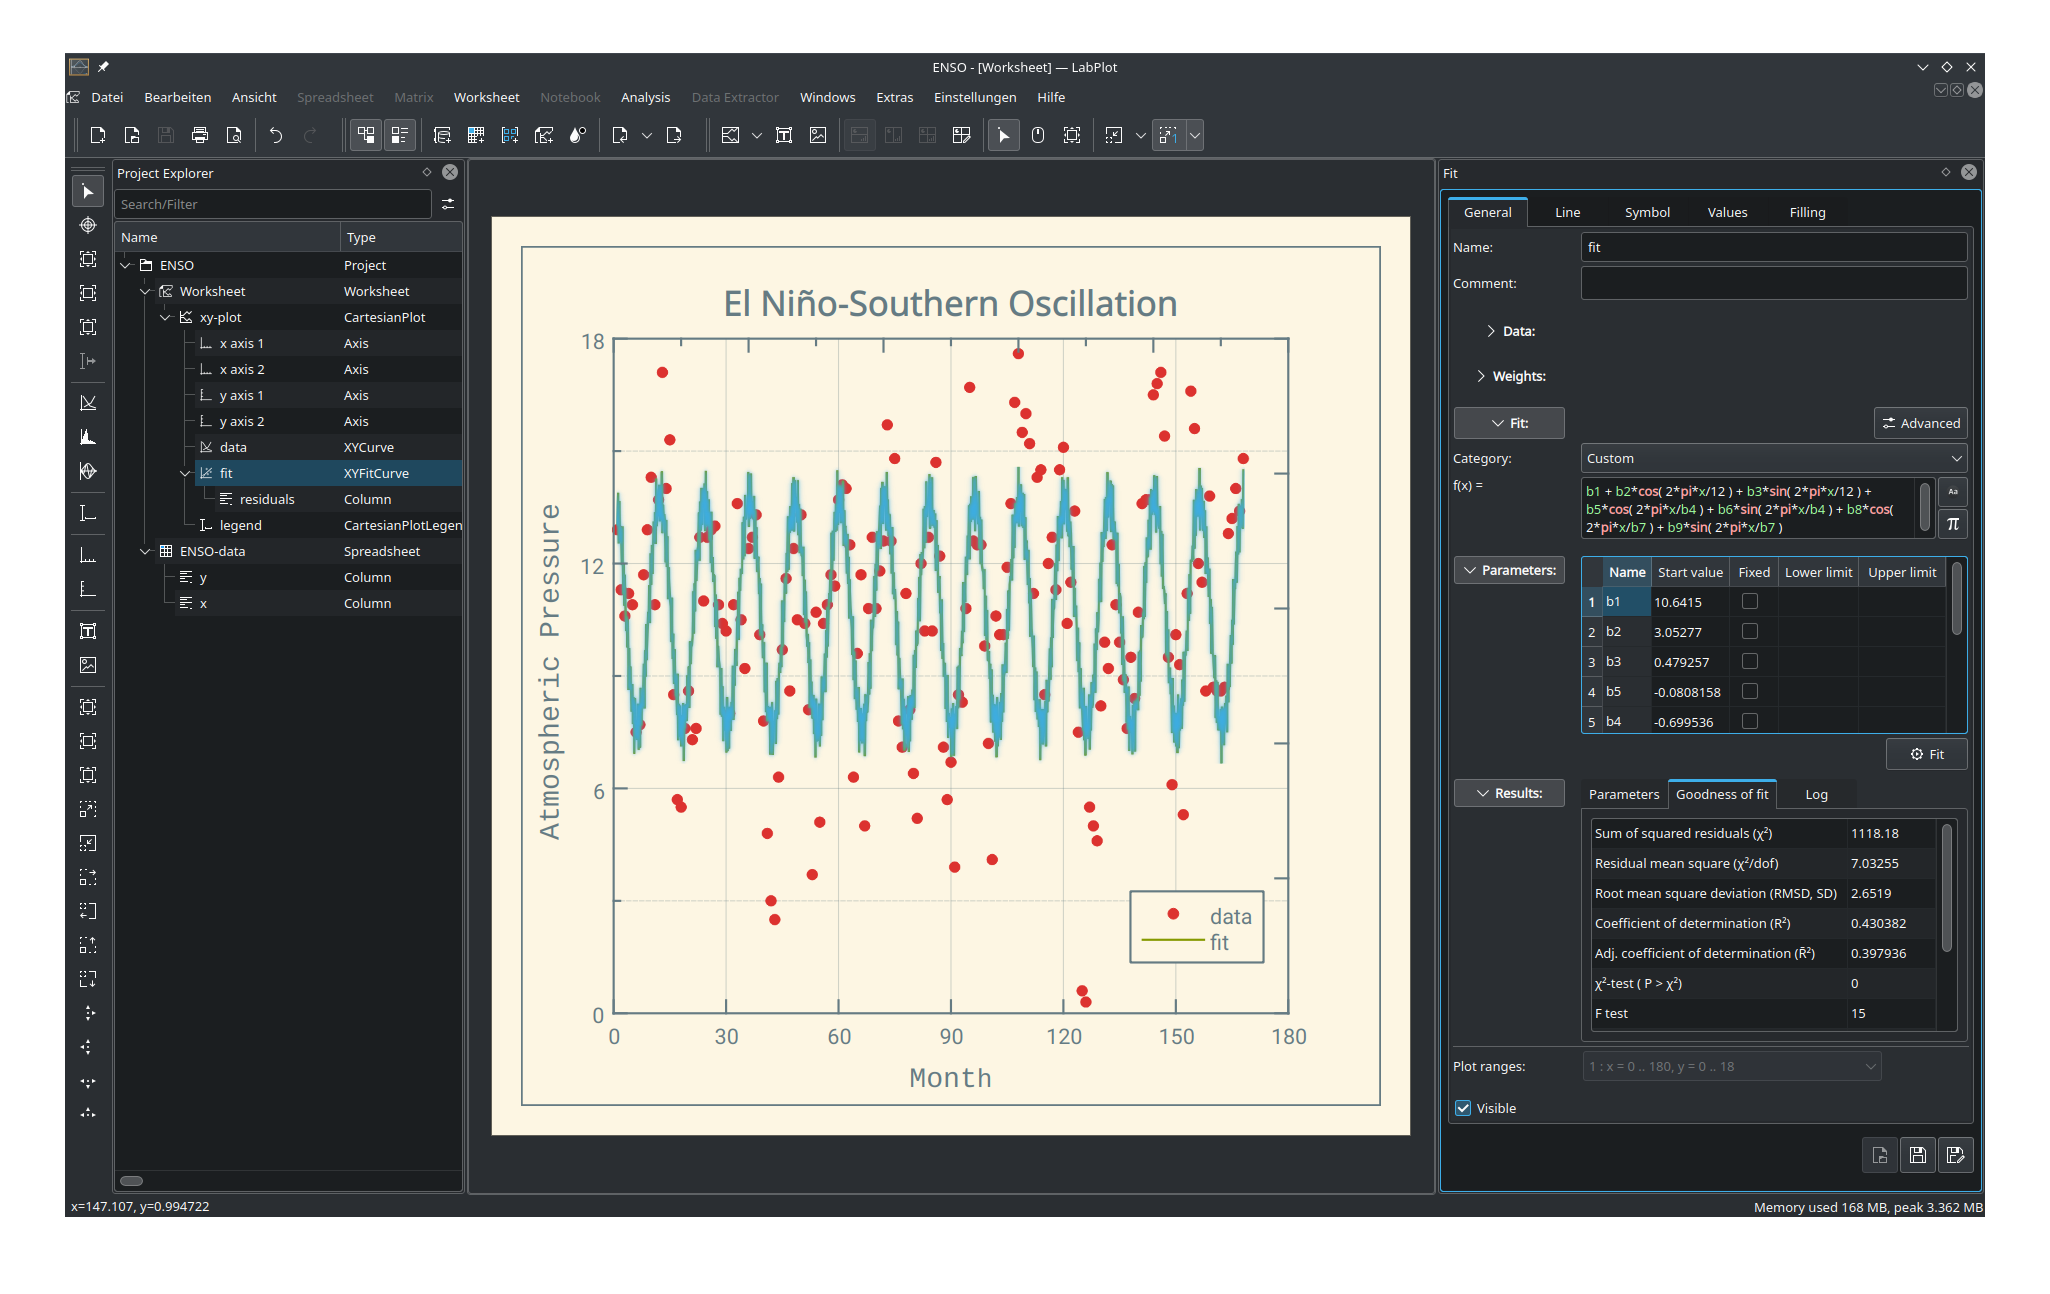
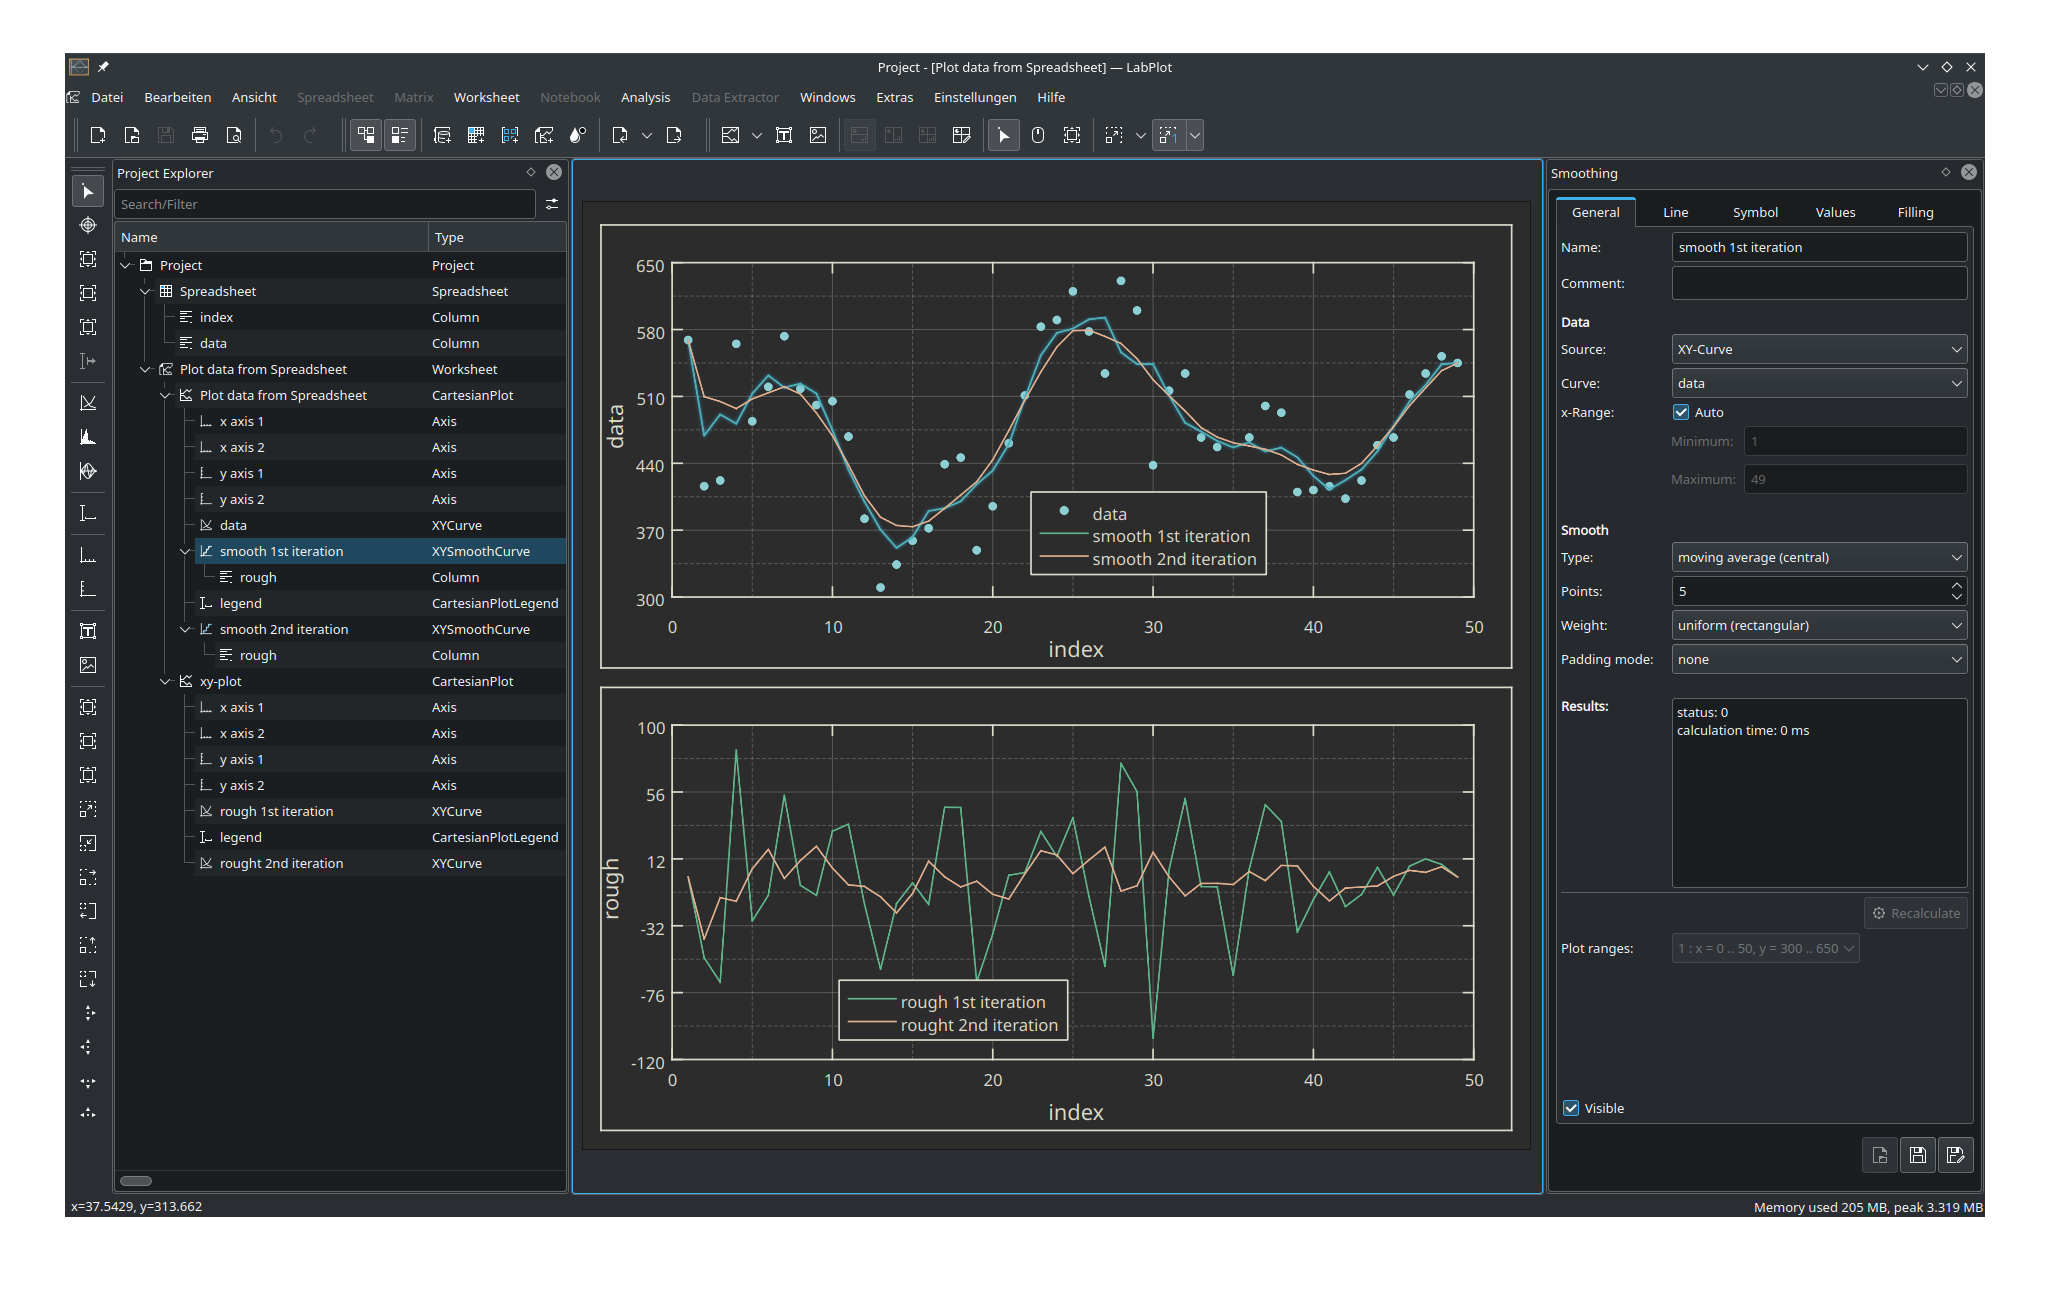
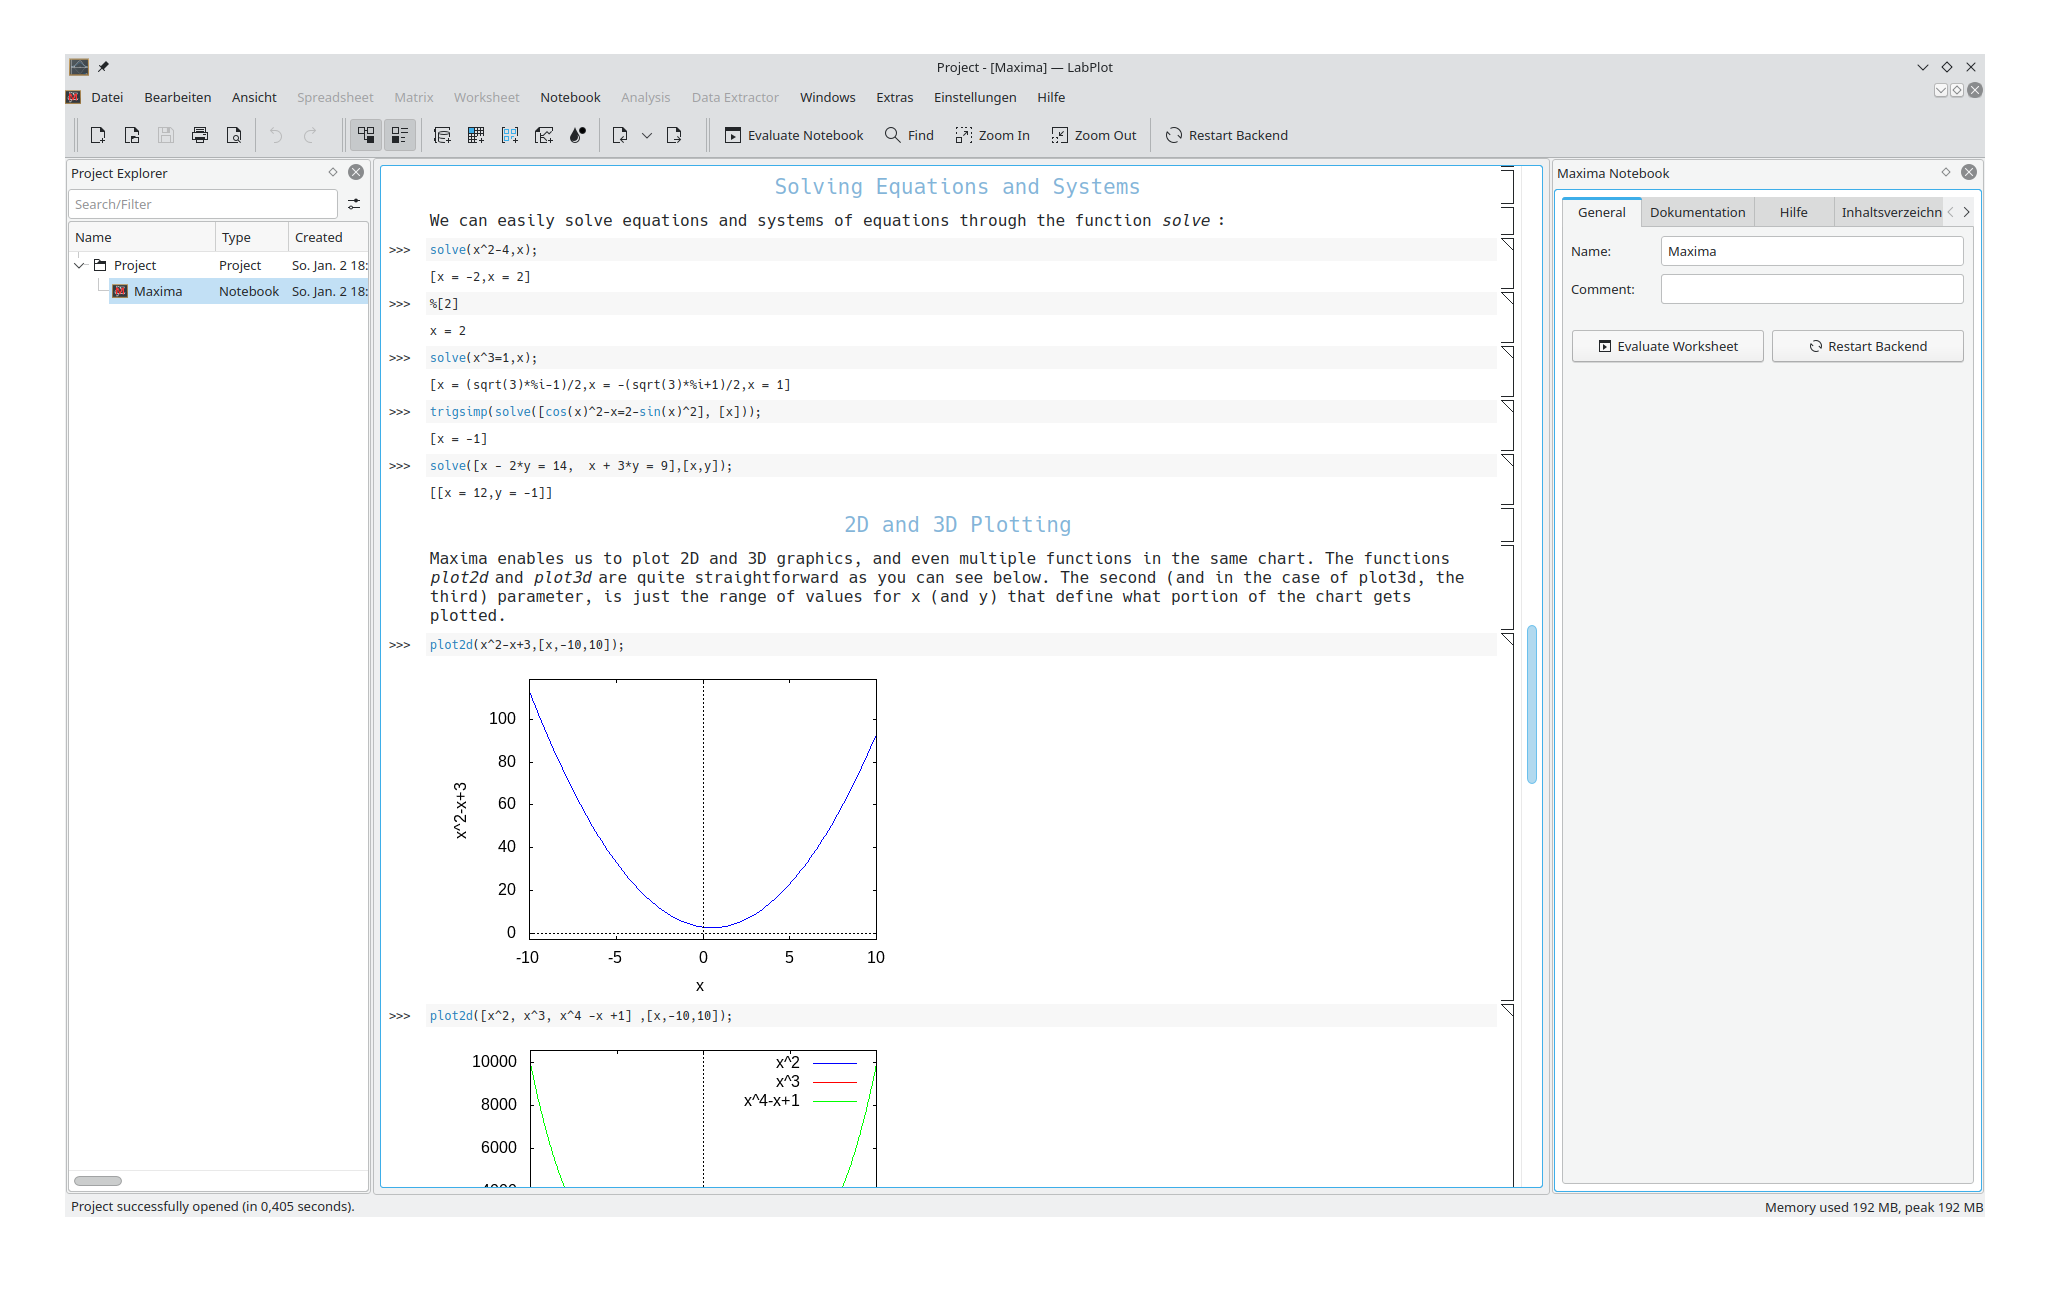
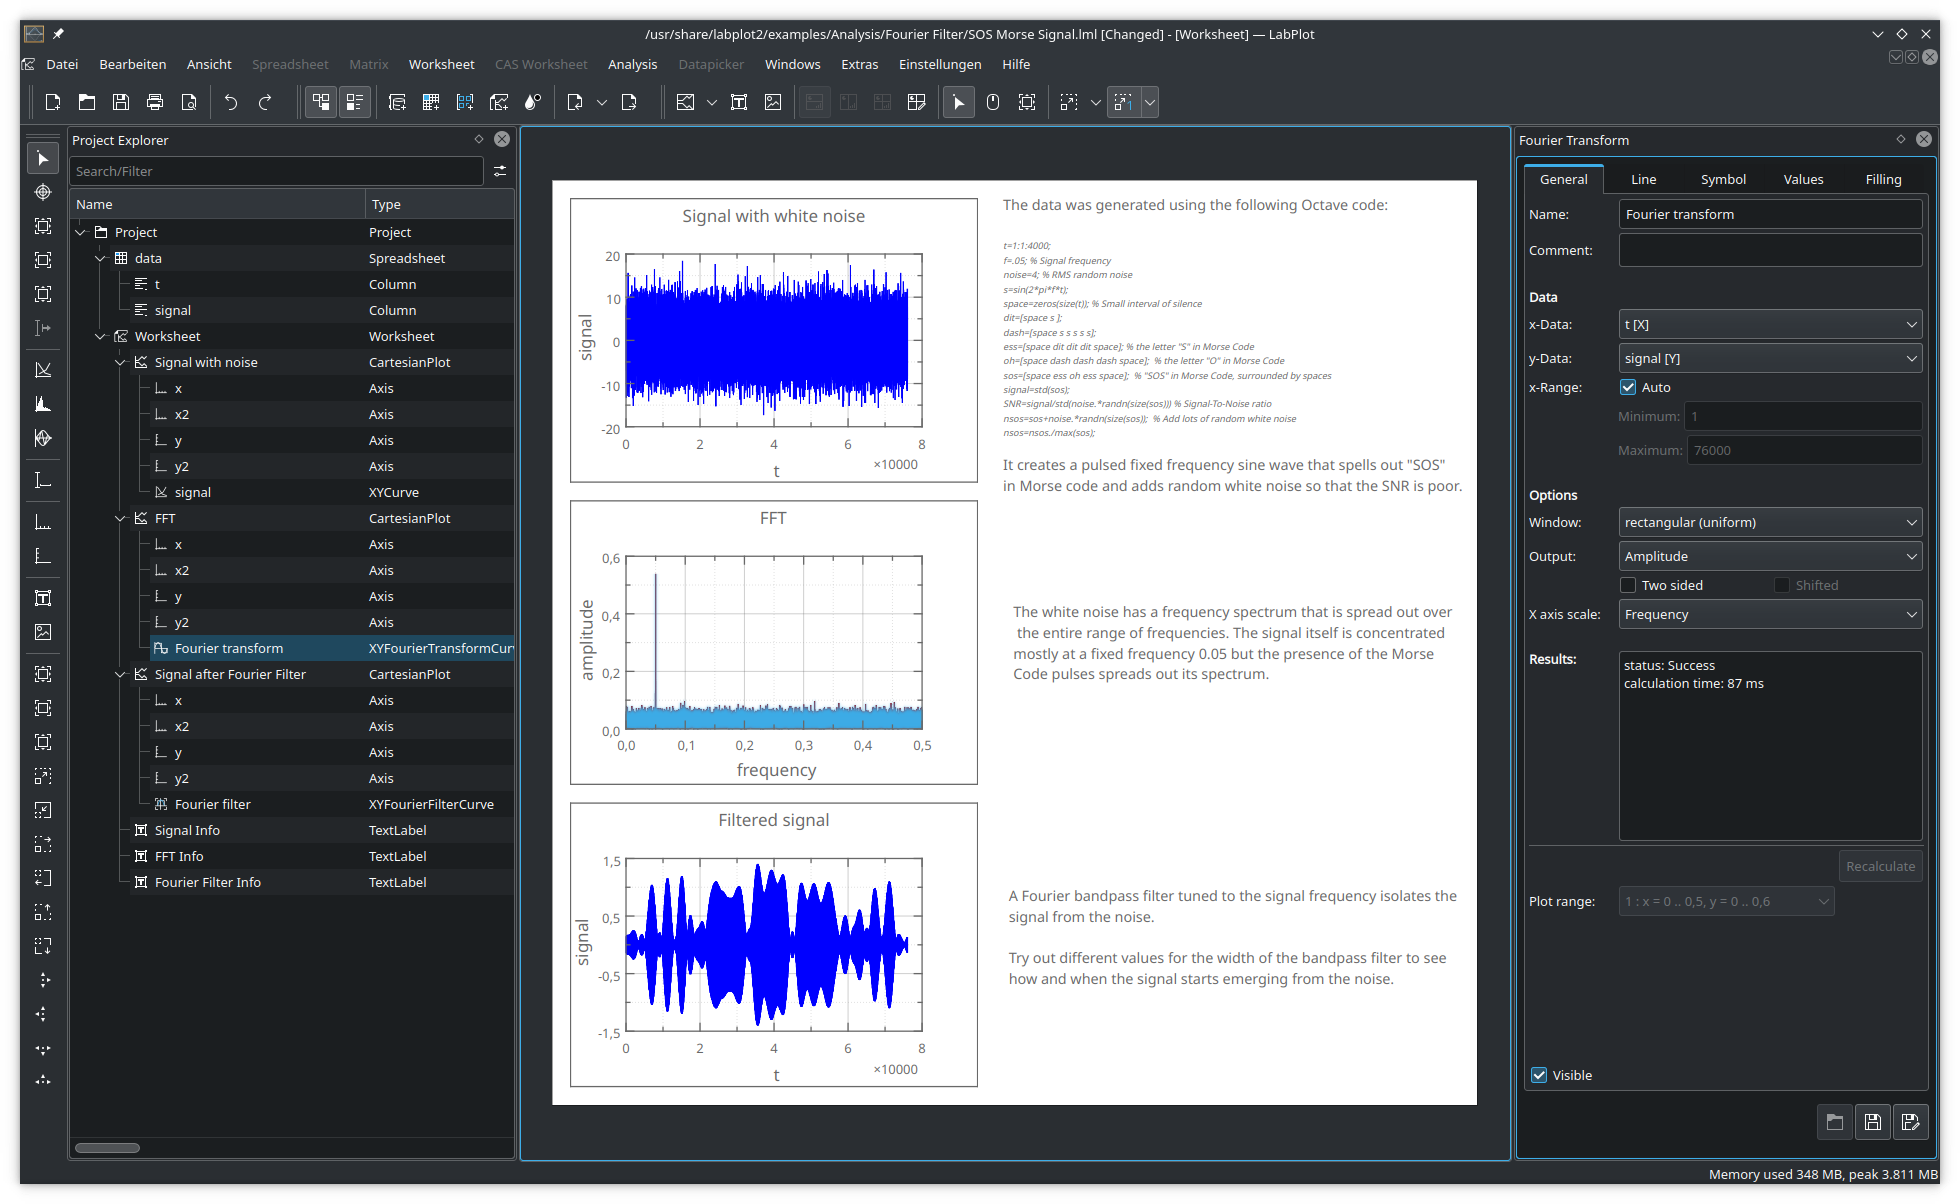
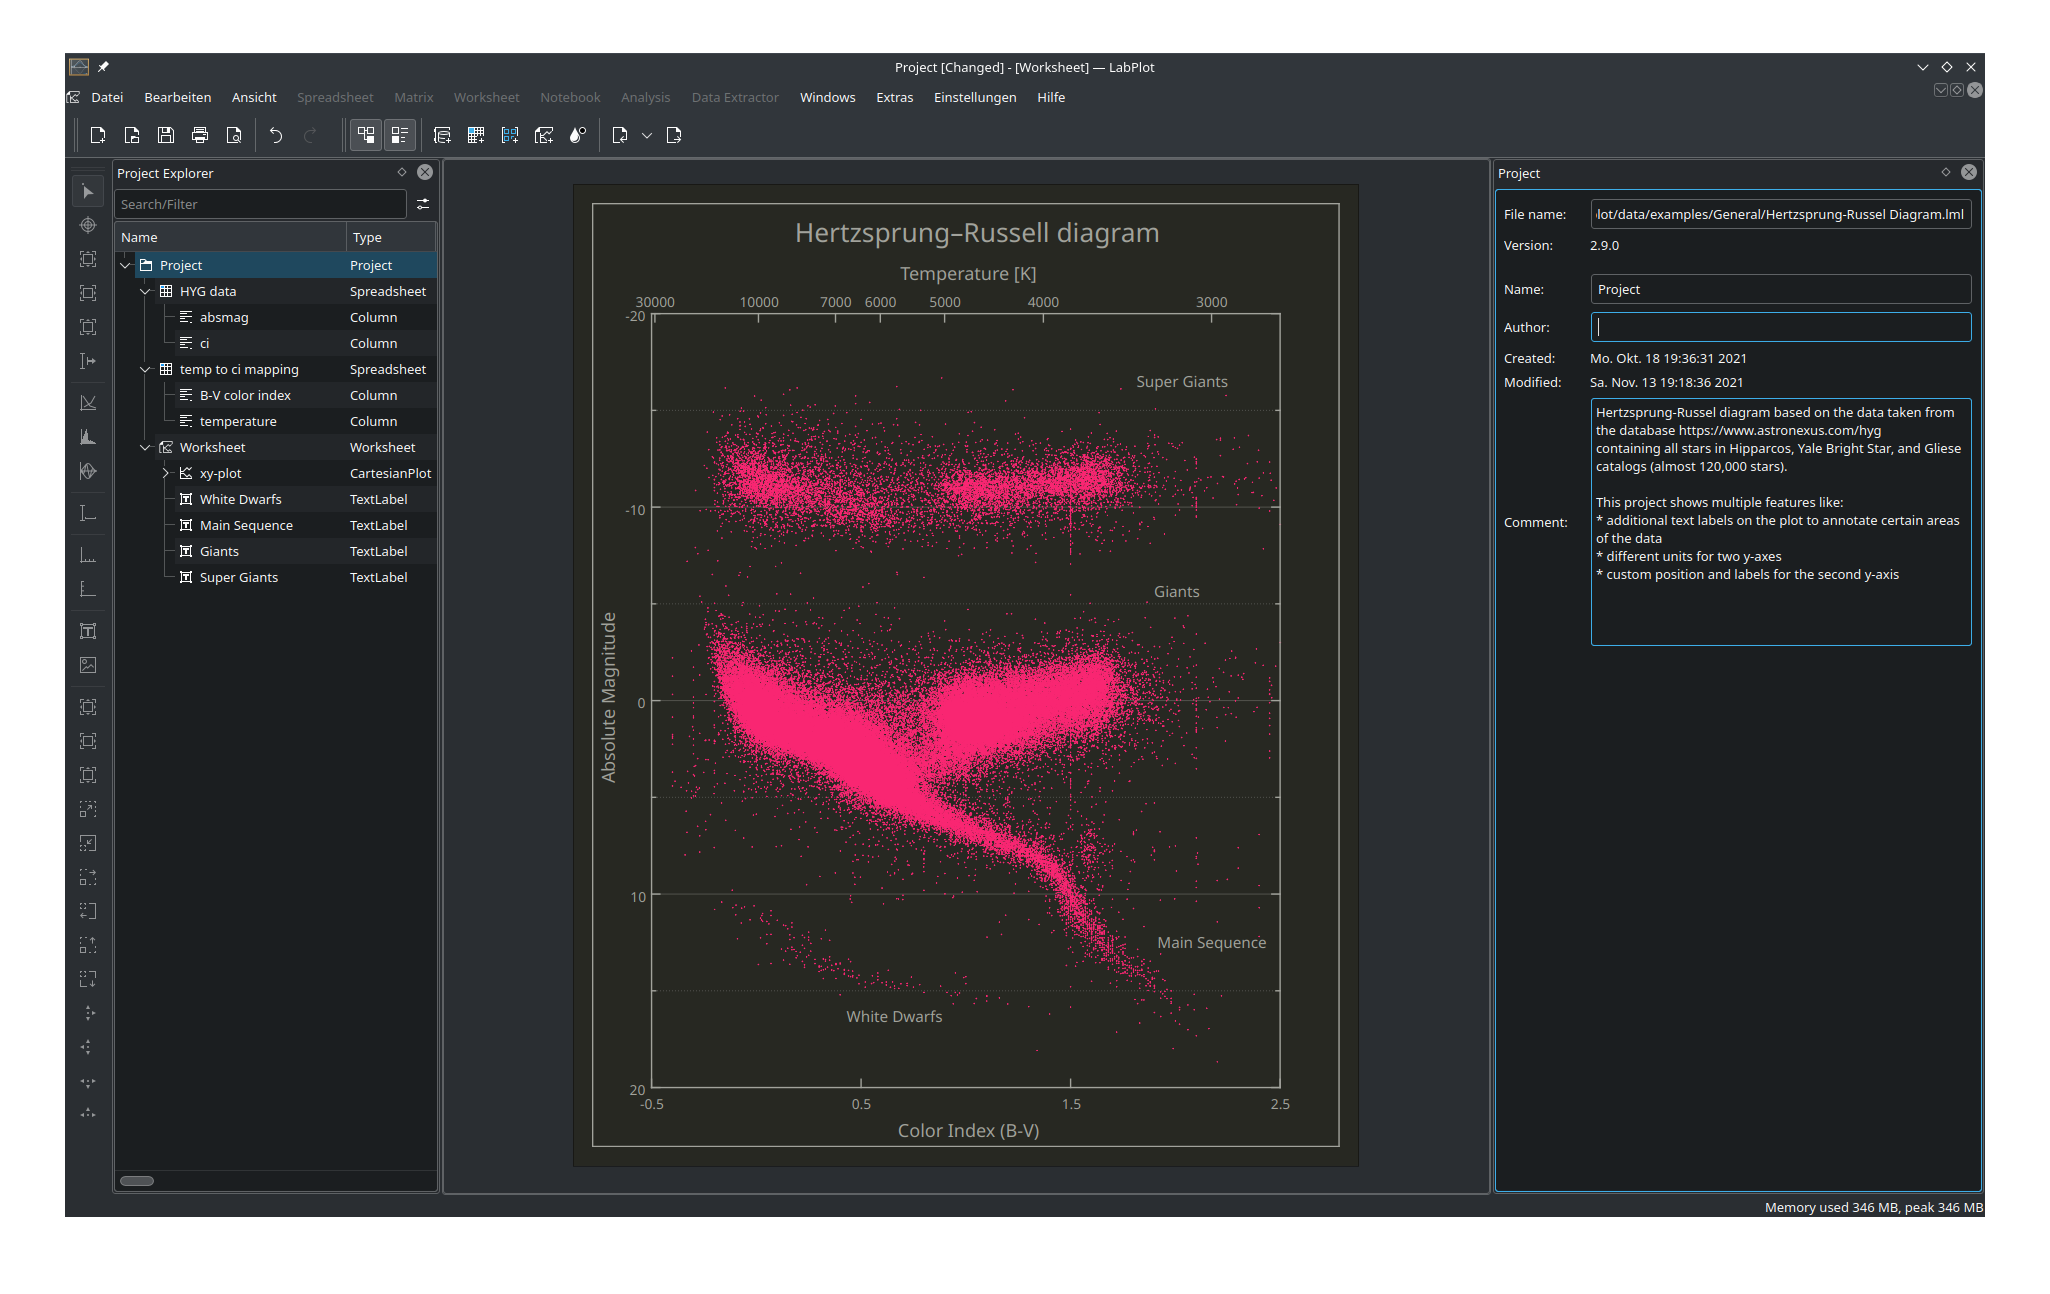
LabPlot is a FREE, open source and cross-platform Data Visualization and Analysis software accessible to everyone.
-
High-quality Data Visualization and Plotting with just a few clicks
-
Reliable and easy Data Analysis and Statistics, no coding required!
-
Intuitive and fast Computing with Interactive Notebooks
-
Effortless Data Extraction from plots and support for Live Data
-
Smooth Data Import and Export to and from multiple formats
-
Available for Windows, macOS, Linux and FreeBSD
Product ID:
9NGXFC68925L
Release date:
2020-11-16
Last update:
2022-11-02