

Description
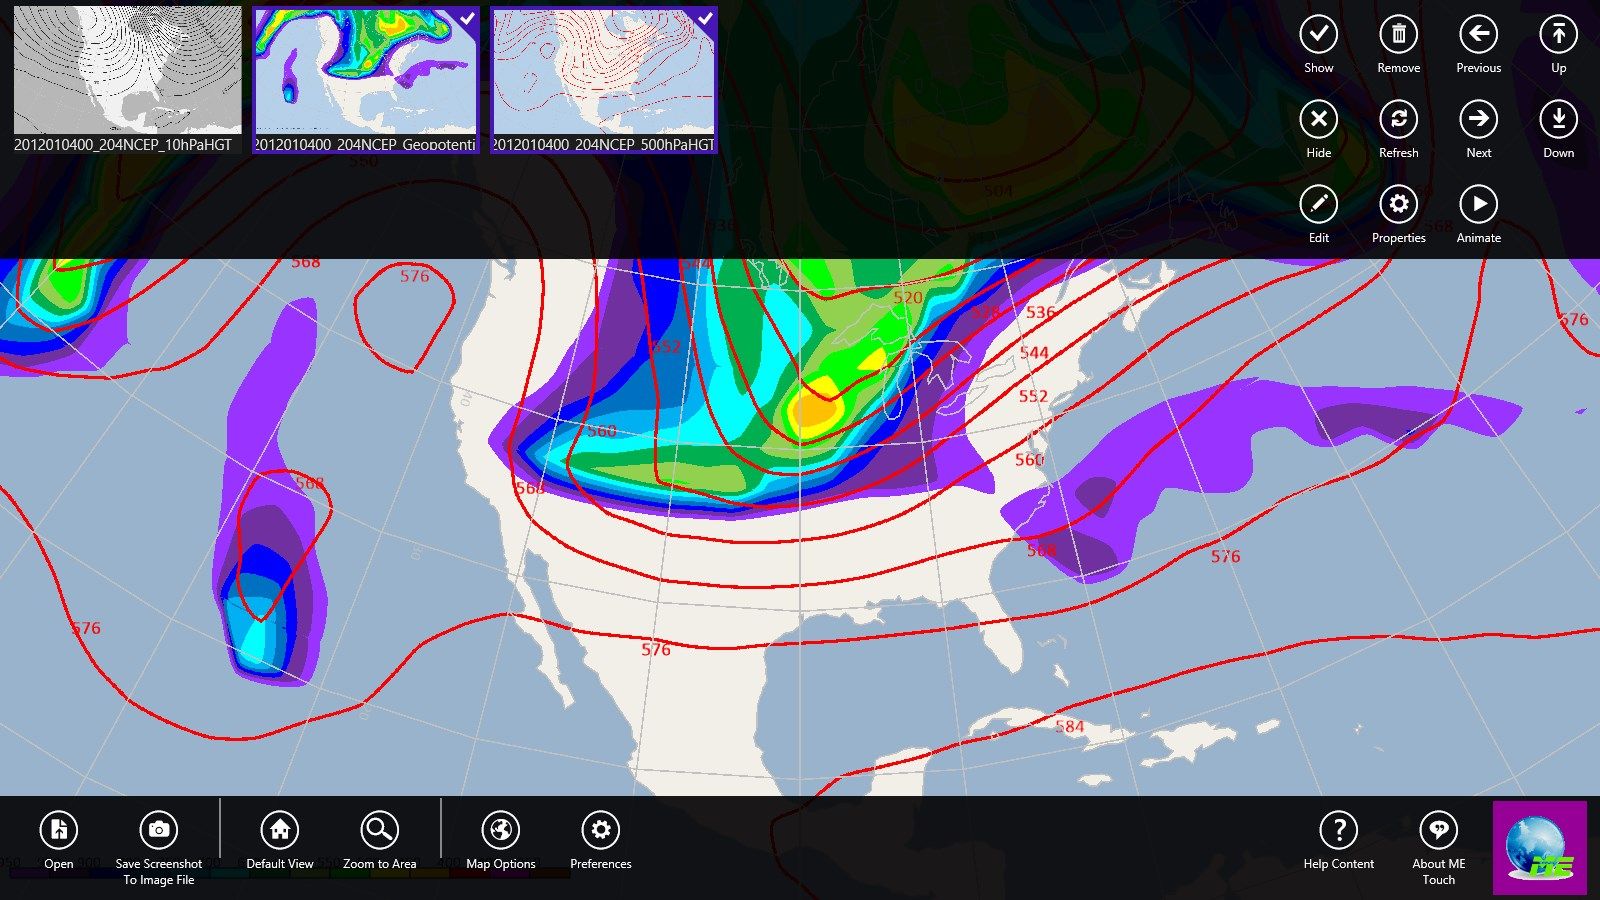
MeteoExplorer Touch, based on the technology of desktop MeteoExplorer software,is a professional software for analyzing and visualizing scientific data. It is also the world first touch-oriented meteorological software optimized for Microsoft’s Windows 8 and Windows RT operating system. MeteoExplorer touch emphasizes performance by following native C++ development and tapping DirectX hardware acceleration rendering technology. It is also designed to be a productivity tool that makes no compromise in implementing its features. Indeed, it provides more than 70% features offered by MeteoExplorer. Moreover, by taking advantage of the touch-oriented functionalities in Windows 8/RT, MeteoExplorer Touch brings an all-new experience for atmospheric science researchers and professionals to process meteorological data on their mobile devices as well as PCs.
-
Graphical layers management (navigation and animation)
-
Objective analysis of physical elements in surface observation data and upper-air soundings data
-
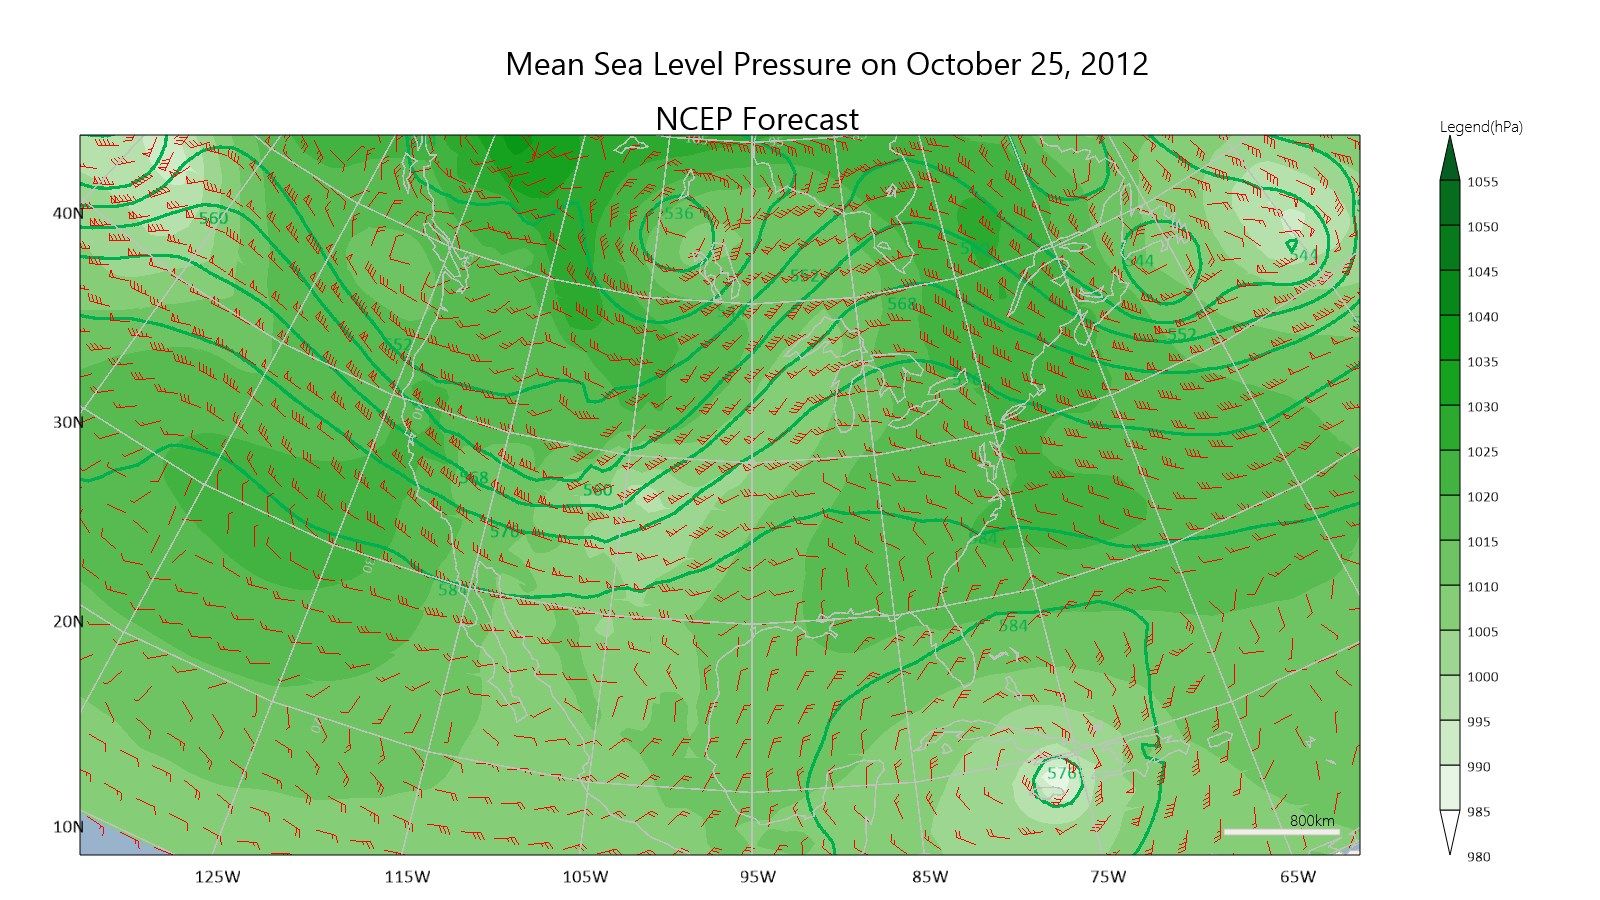
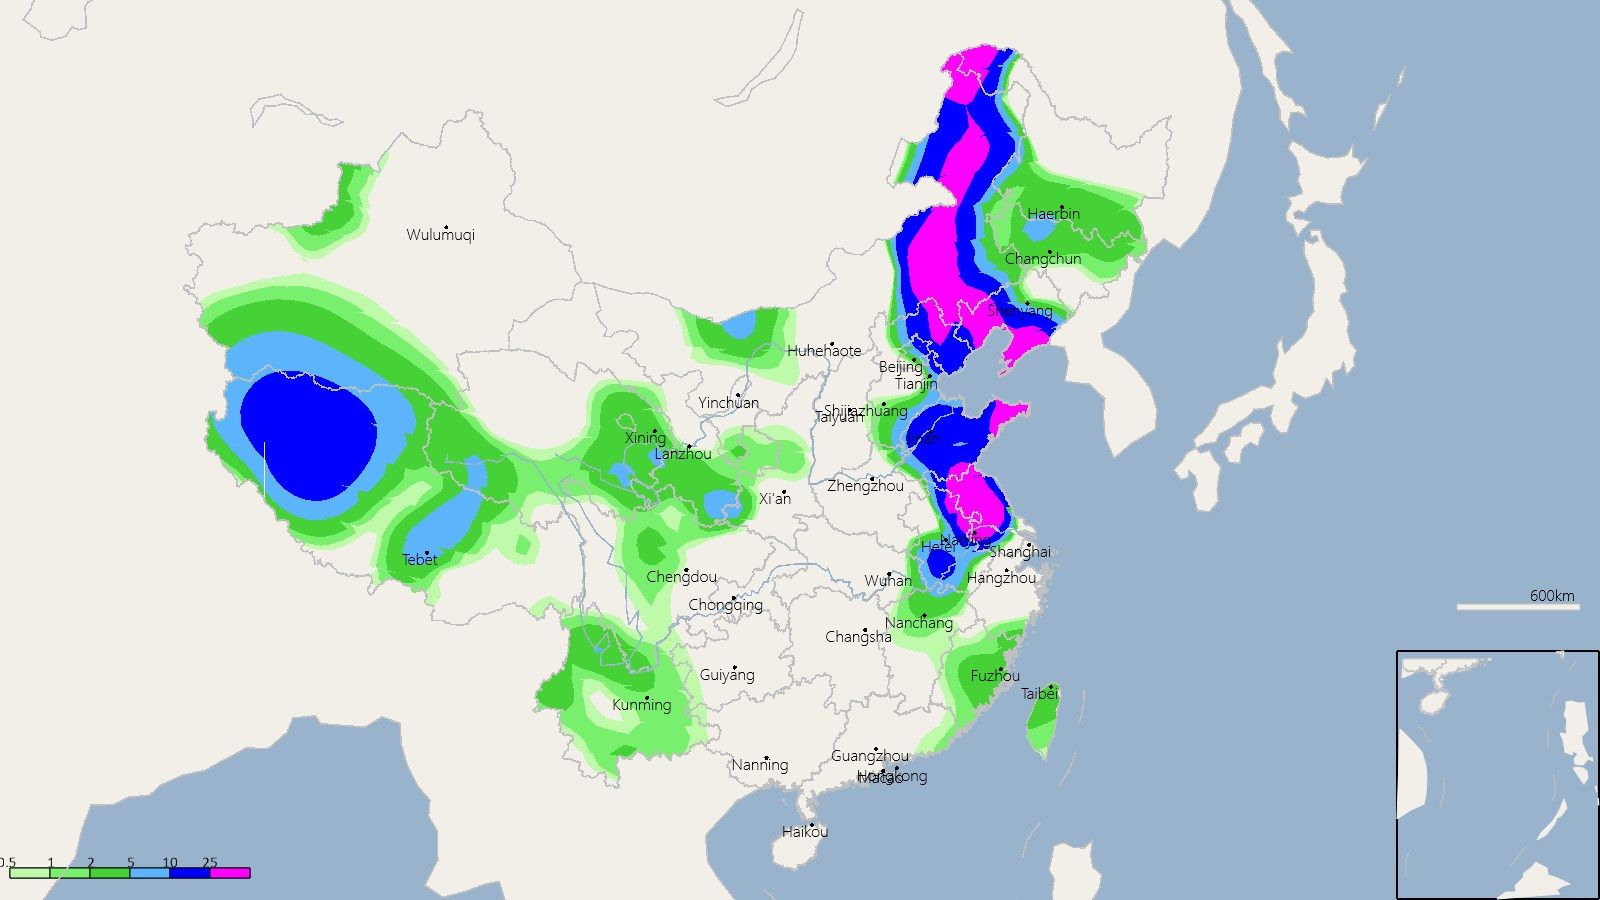
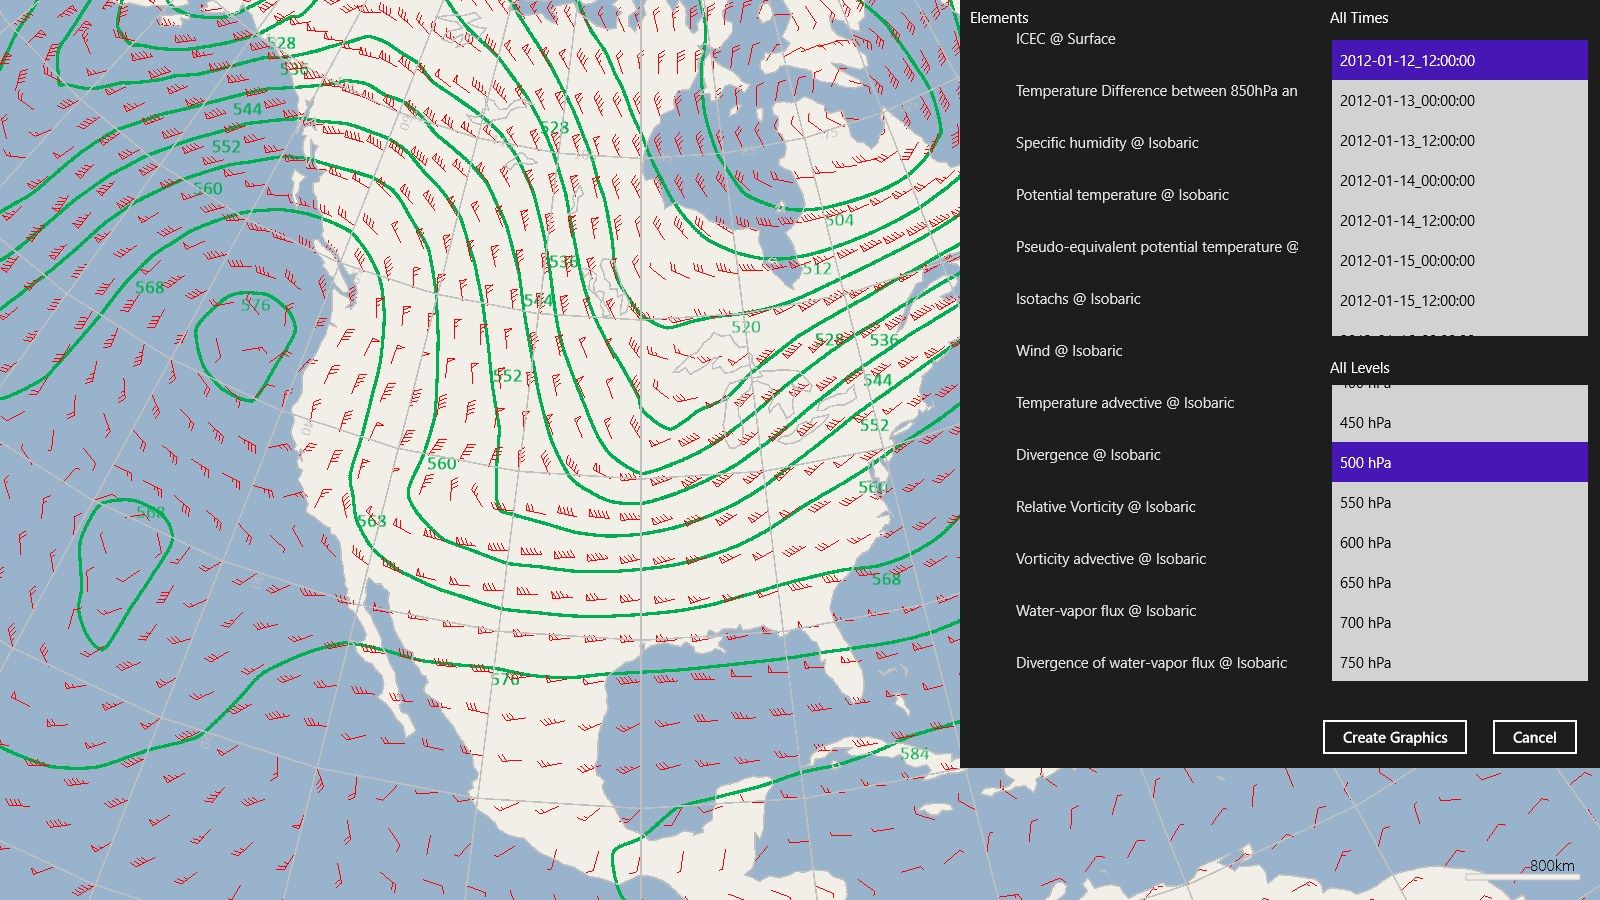
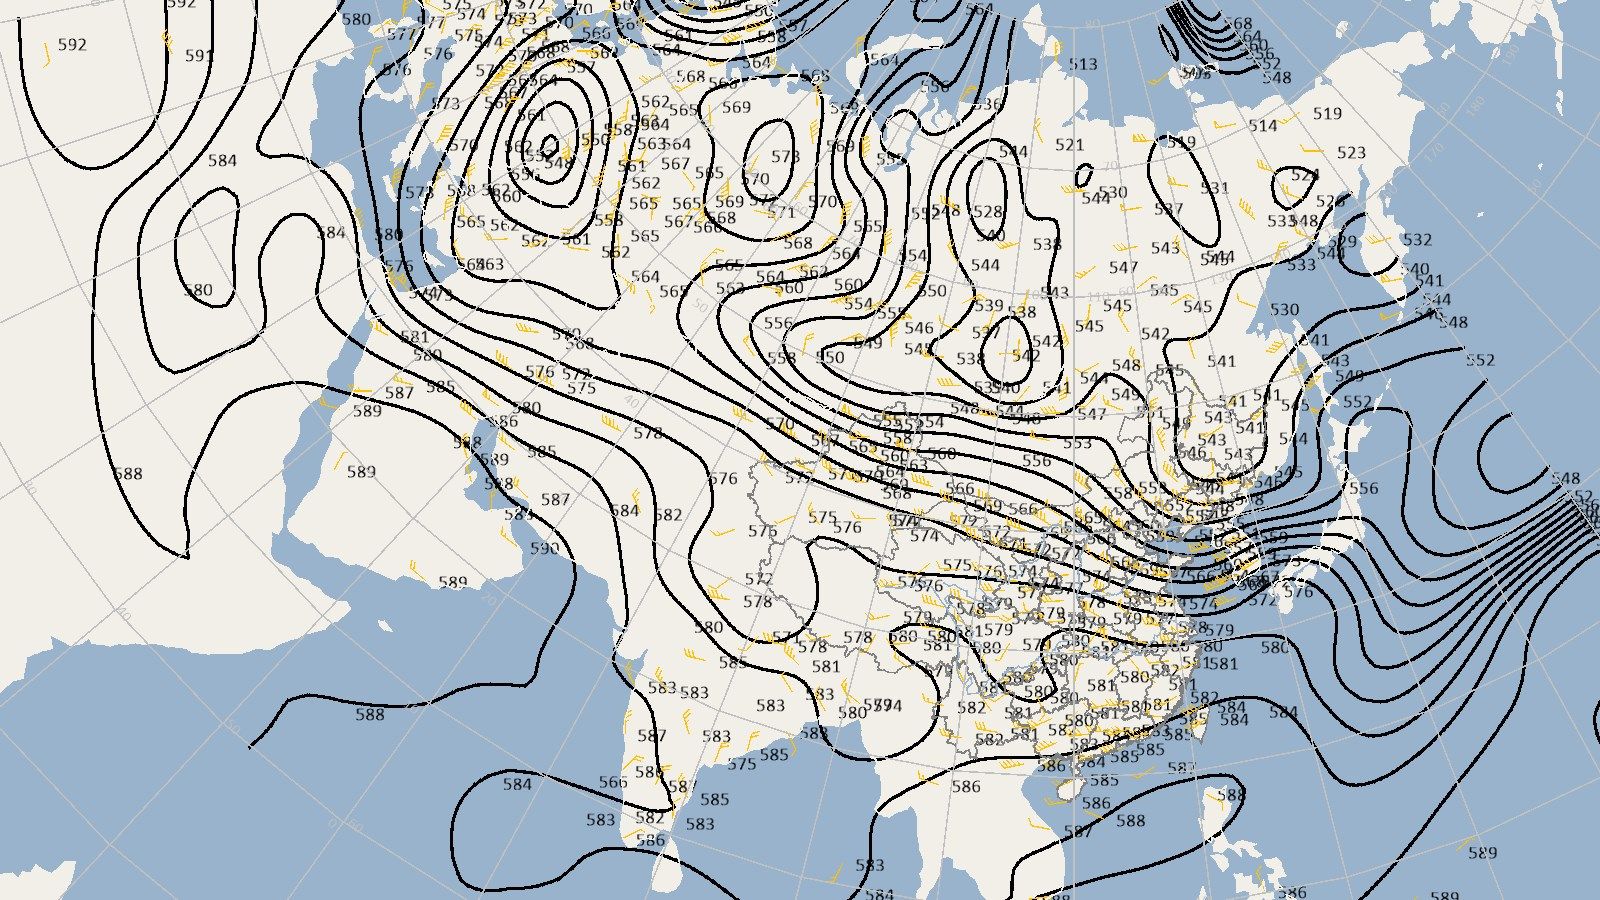
Isoline analysis and shading of gridded data
-
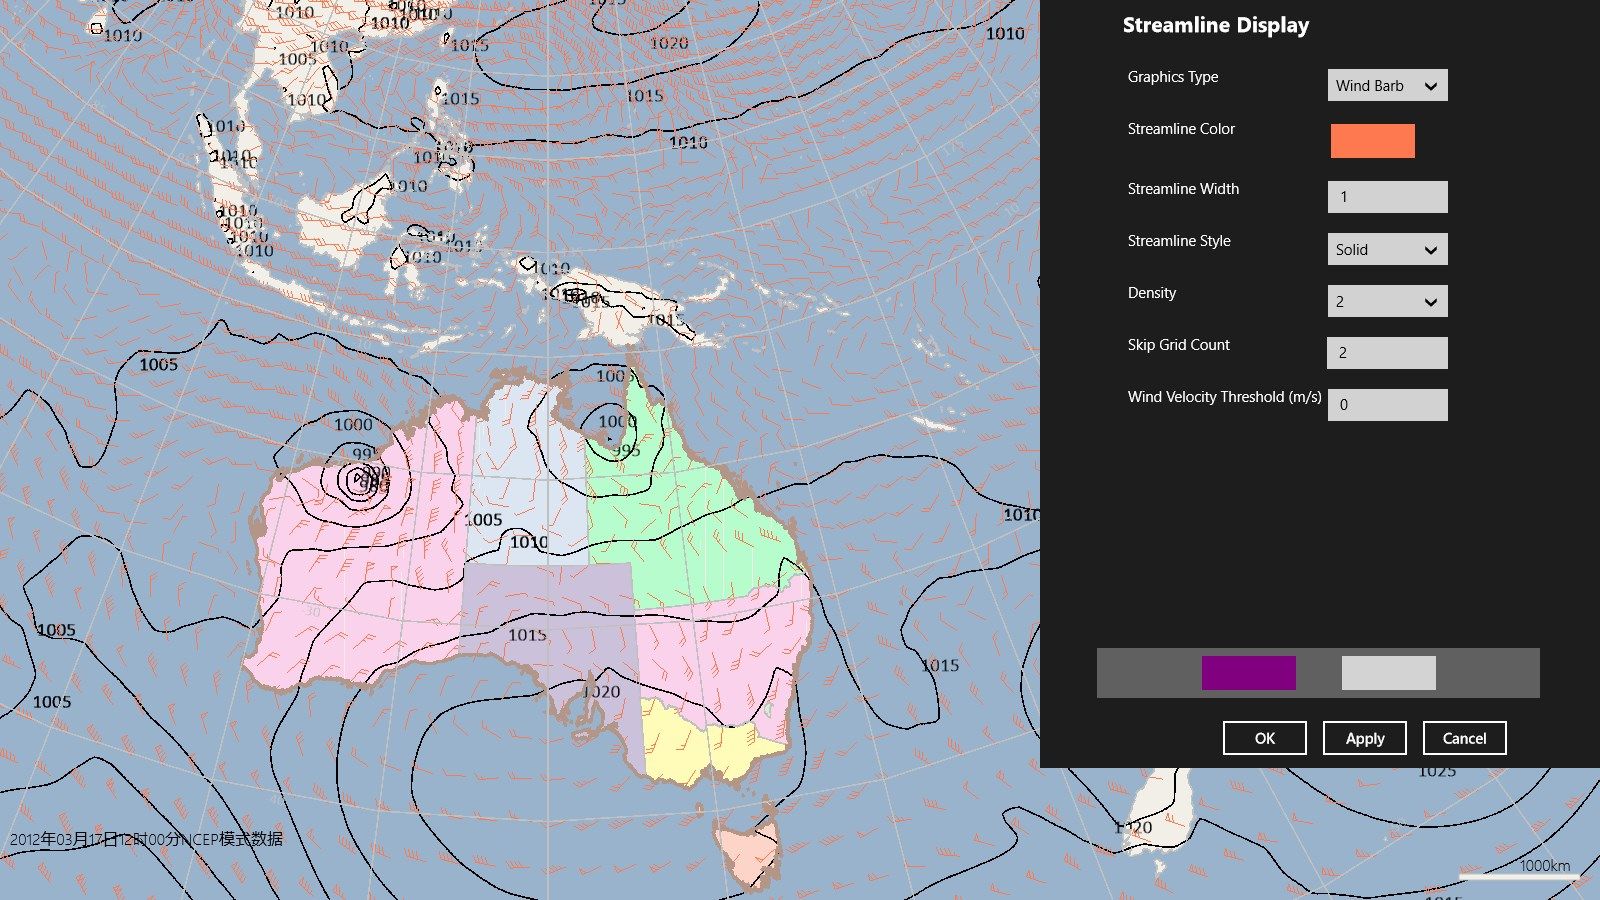
Streamline analysis of wind field
-
Computation of physics elements
-
NetCDF,GRIB1/GRIB2, GrADS data process and display
-
MICAPS data process and display
-
ESRI shapefile data process and display
-
Tile and tile notifications
-
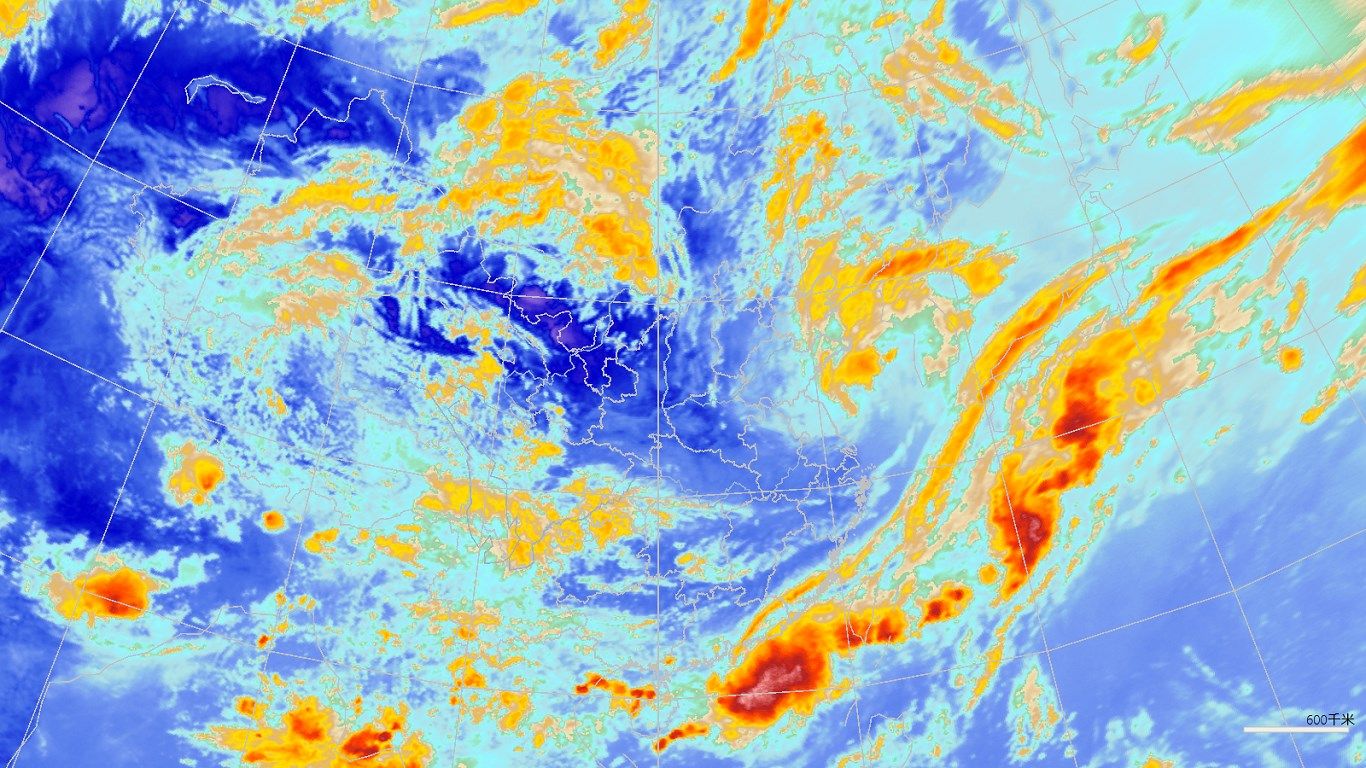
Satellite nephogram data display and animation, supporting AWX, GPF format
-
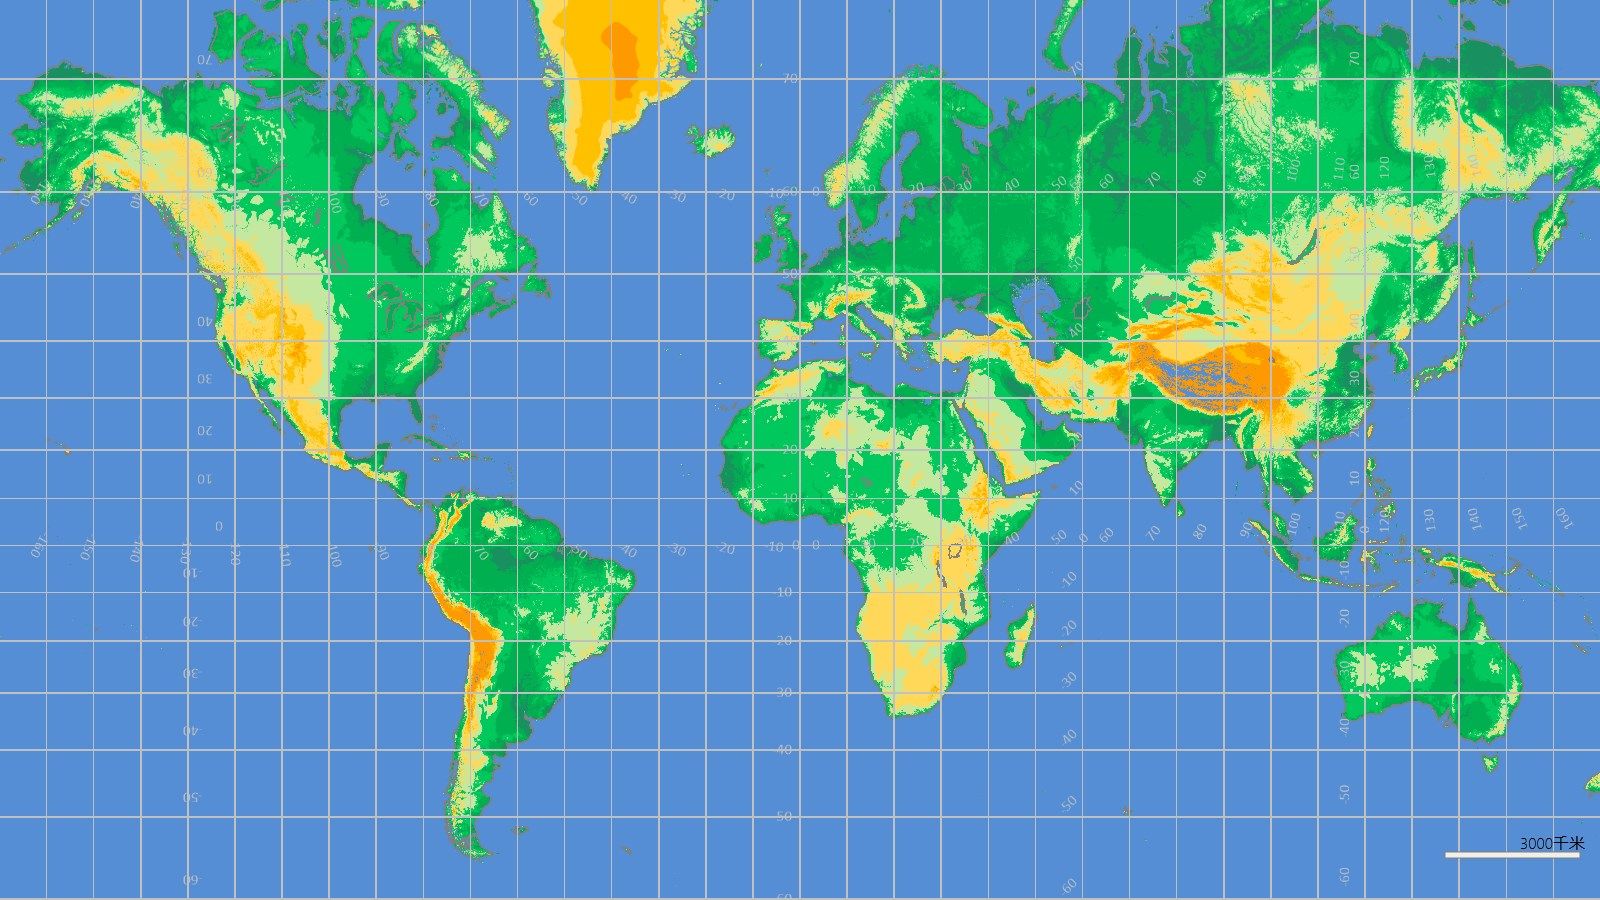
Map zoom, pan, preconfigured projection settings for most of the countries and regions in the world
-
Zoom to area
-
Save screen shot as image file (supported formats: BMP, JPG, and PNG
-
Support English and Simplified Chinese language in user interface
-
Page layout configuration