
Description
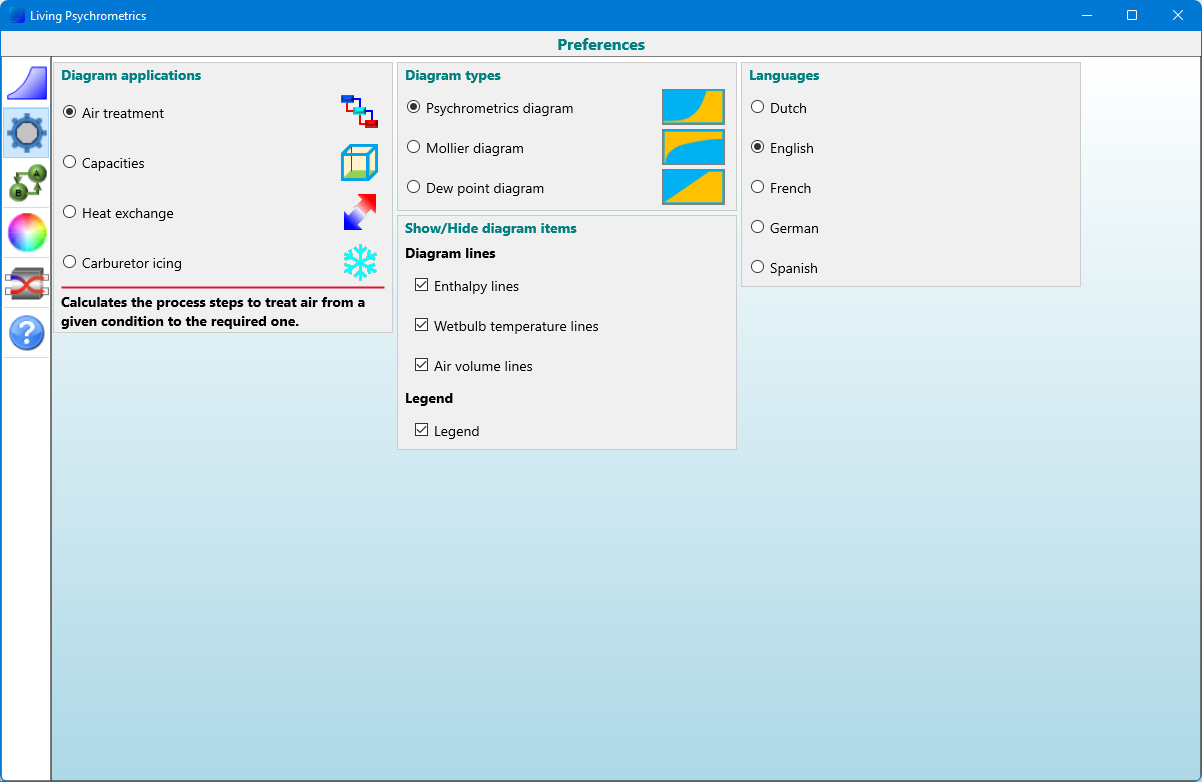
This app offers four different calculations and shows the results both in a pane and on a psychrometric diagram:
-
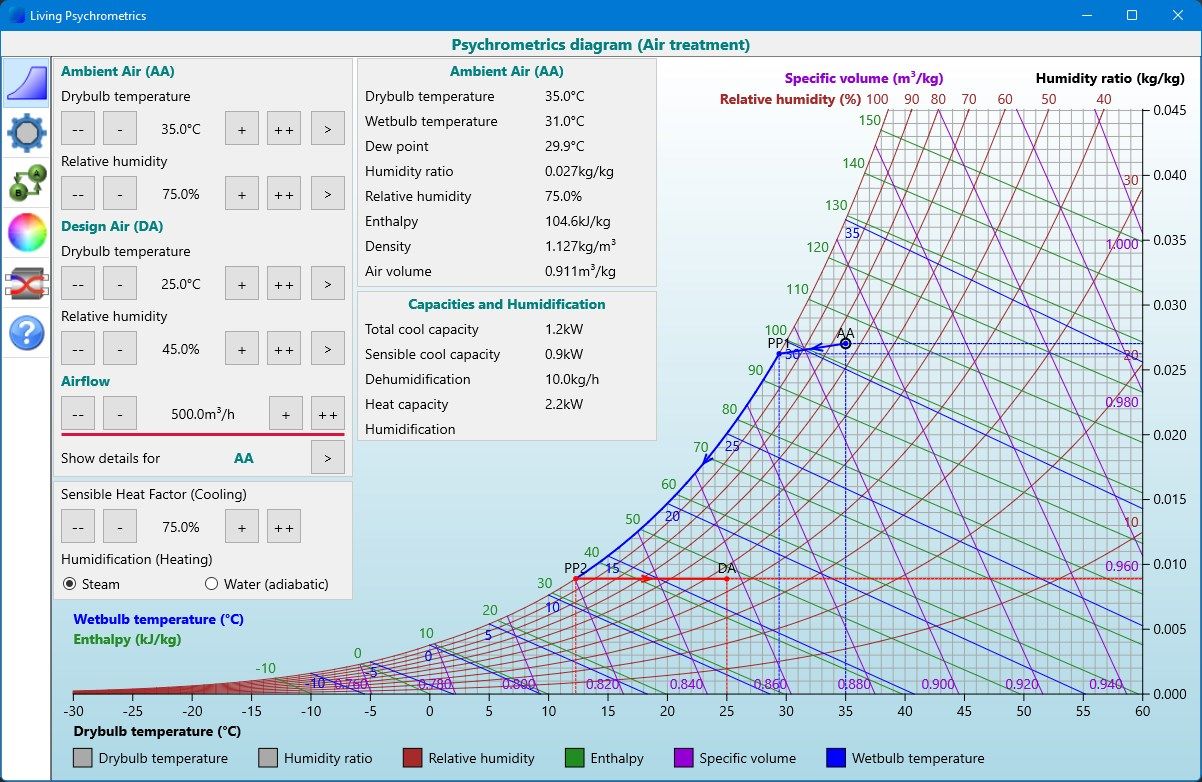
Air treatment
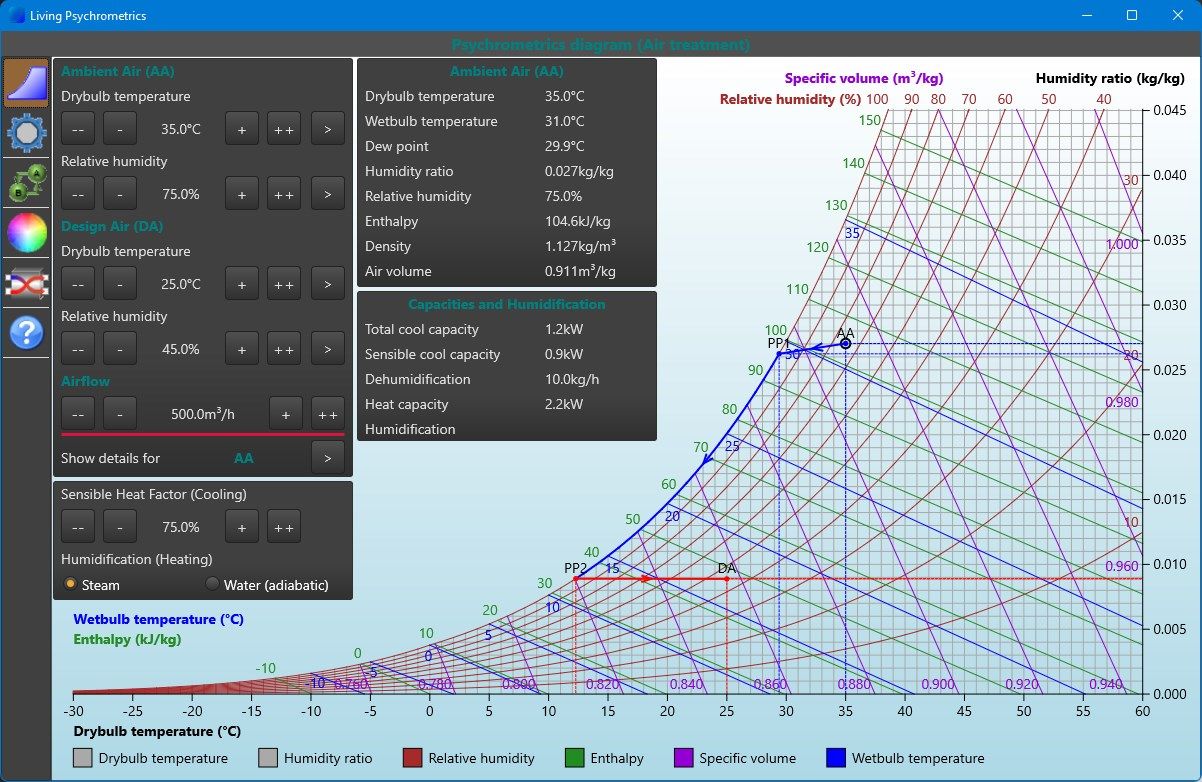
Calculates how to convert a given ambient air to a required design air. The steps involved are cooling with a given sensible heat factor, dehumidifying, heating and humidifying (adiabatic or steam). Depending on the given and required air conditions, some of these steps may not be needed. -
Capacities
Calculates the required capacity to cool down or heat up a given amount of air (e.g. air in your room). -
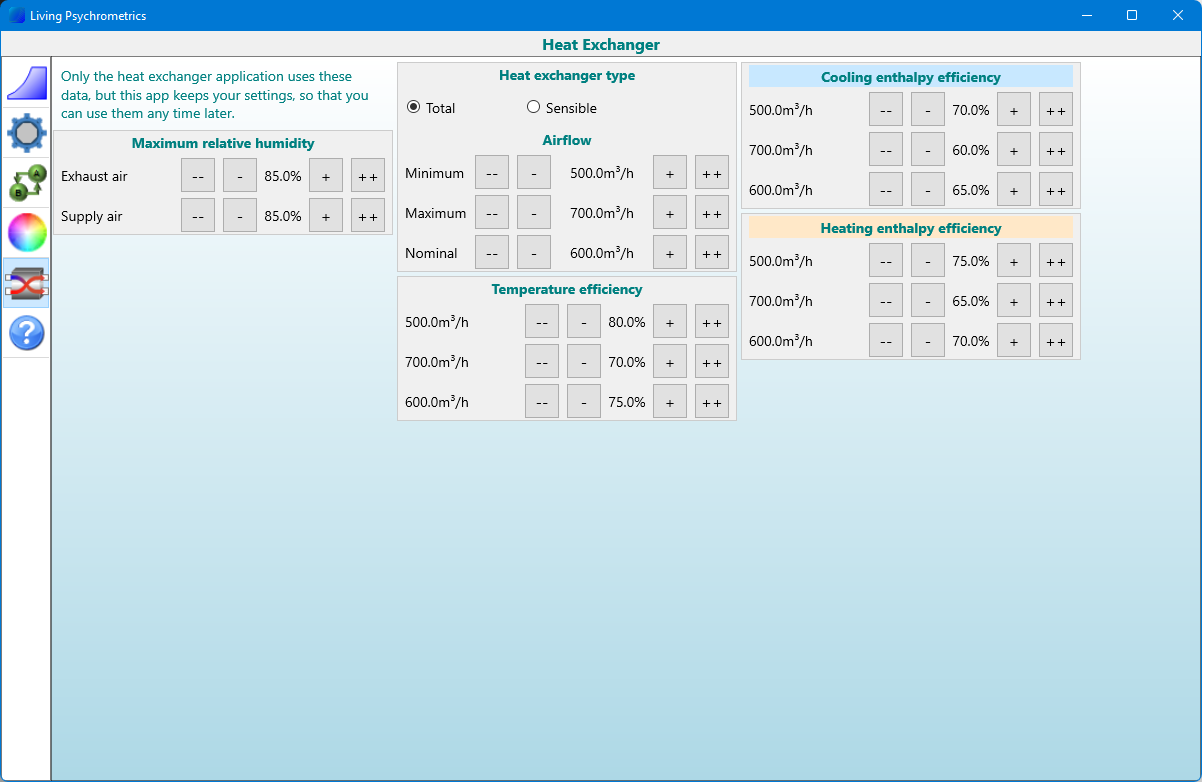
Heat exchanger
Calculates how warm room air heats up cool ambient air before supplying it as fresh air to the room. While heating up the ambient air, the heat exchanger cools down the room air, which may result in condensate. When the ambient air would be too cold, this calculation dimensions an electric heater to prevent condensate. -
Carburetor icing
Given a temperature and a dew point temperature, calculates the probability of icing in an airplane carburetor. Graphically shows the danger zones on a diagram.
These four calculations show the results in a pane, but also graphically in a diagram. You can choose between three different diagrams:
-
Psychrometric
This is the classic diagram representing different kinds of air properties into a single diagram. You find detailed descriptions in standard books about air treatment, such as ASHRAE. This diagram shows lines of constant temperature, humidity ratio, relative humidity, enthalpy and specific volume. -
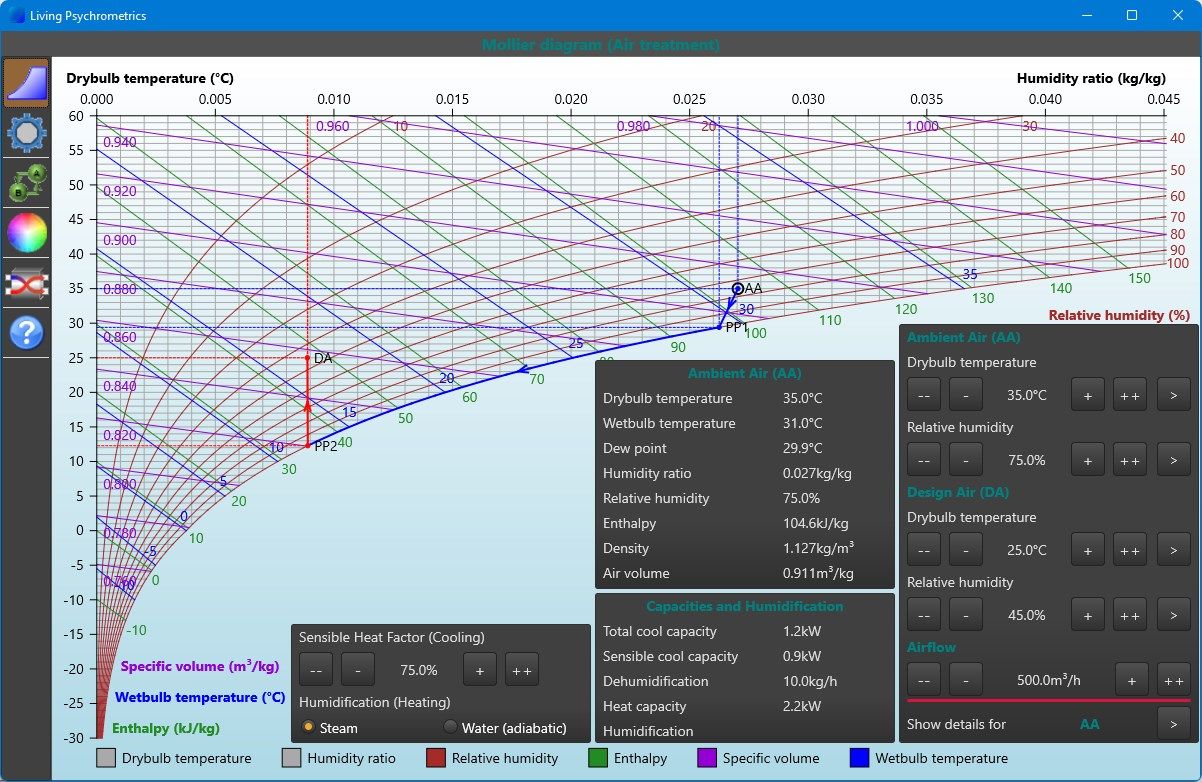
Mollier
This is probably the oldest diagram to represent air properties and named after its inventor Richard Mollier (1863-1935). To get a psychrometrics diagram from a Mollier diagram, swap it along the vertical axis and rotate it 90°.
The Mollier diagram is heavily used in Eastern Europe and Germany and shows the same lines as in the psychrometrics diagram. -
Dewpoint
This diagram is meant for meteorologists and pilots. It is easy to read important weather data, such as temperature, dew point and relative humidity. However, this diagram shows the same constant lines as for the other two. Interestingly, the straight lines in the other two diagrams become curved lines in this one and vice versa.
-
Select two air properties to define a point: dry bulb temperature, wet bulb temperature, humidity ratio, relative humidity, enthalpy, specific volume and moist air density.
-
No need for a keyboard: move point over a diagram to change its air properties. Change other values using a slider.No need for a keyboard. Enter data using buttons for small and large value increments
-
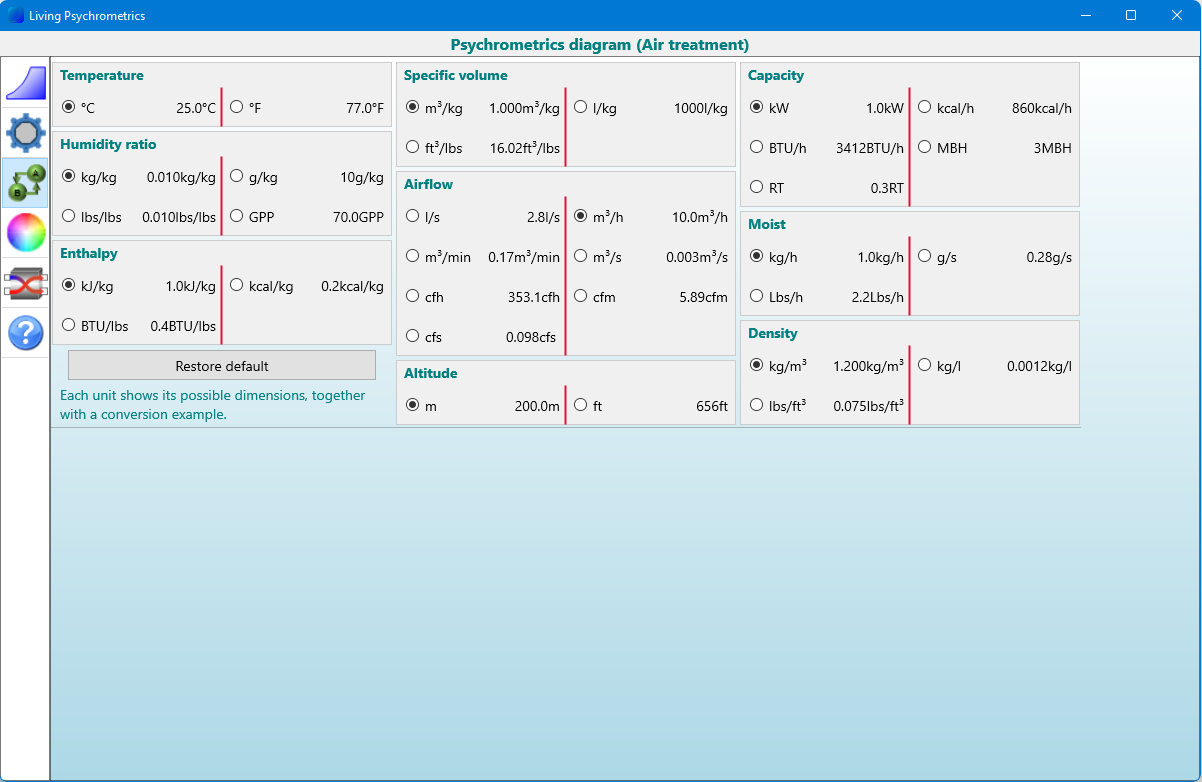
Choose between metric or imperial unit dimensions, e.g. °C and °F or kW and BTU/h.
-
See immediate results of any change on the diagrams and the result panel shows detailed information about a point on the diagram.
-
Choose one of the diagram types (Psychrometrics, Mollier or Dewpoint) for the graphical results. Hide some constant lines on the selected diagram to simplify it.
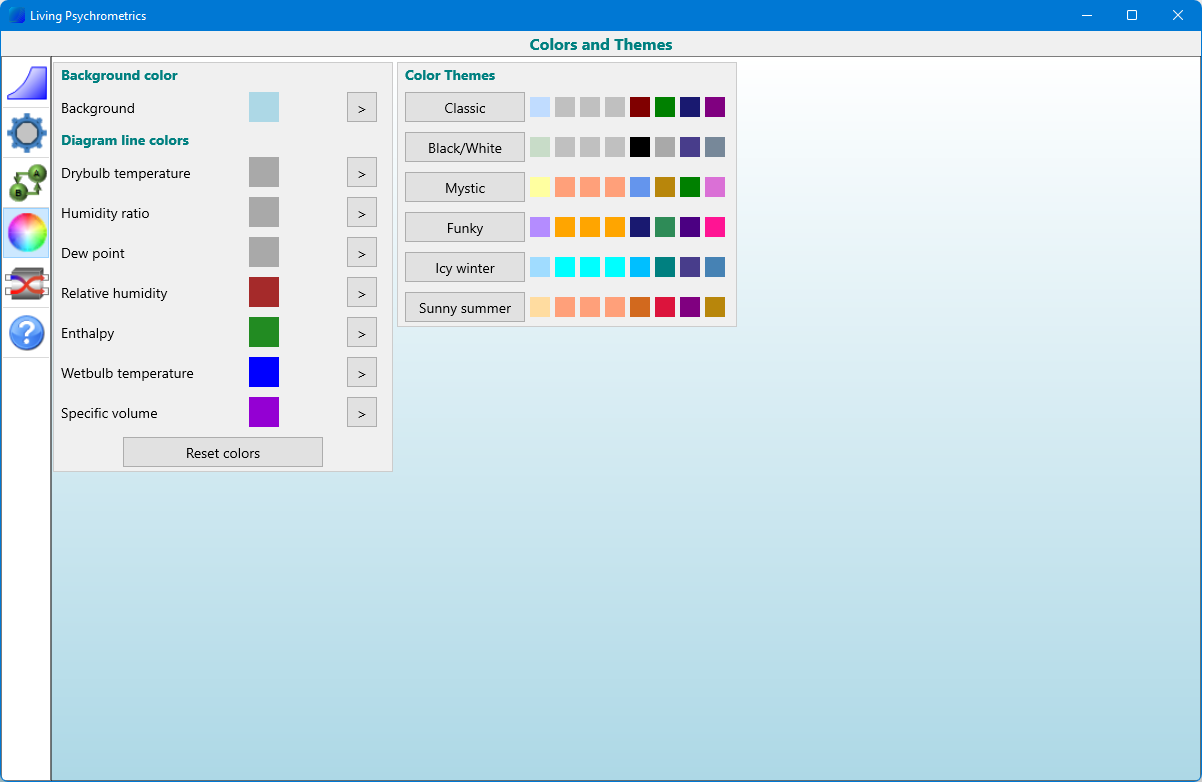
-
Define colors for the diagram lines and the background gradient.
-
Define the efficiency properties of a heat exchanger, giving you professional results.
-
Tap the explain tab to get a short explanation of a calculation or a diagram.
-
Scale the app by enlarging or maximizing the screen.
-
The app saves your latest settings and starts up with those settings. Adapts its user interface when you rotate your screen.
-
Detects the Windows language settings and changes its language (French, German, Spanish and Dutch) or continue to use English. At any time, you can also change the language explicitly.
-
Supports light and dark themes.