
Description
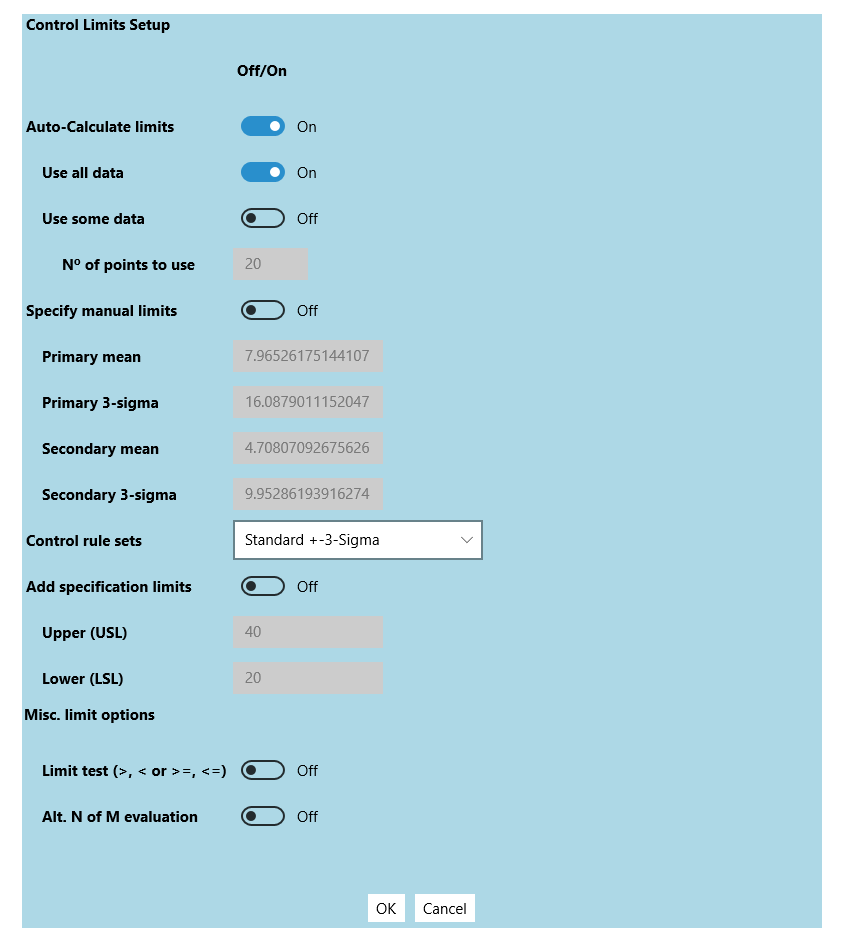
The QC SPC Chart software is an interactive SPC chart (6-sigma) application aimed at quality control professionals (and students) who want to view industry standard statistical quality control charts on their mobile devices. Typical users will monitor critical quality factors in manufacturing, process, and service industries, and display the results in one of the many supported chart types. Chart types include: variable control charts (XBar-R, XBar-Sigma, Individual-Range, and Median-Range), and attribute control charts for monitoring defects (p-, np-, c-, u-, and DPMO charts). The software will automatically calculate SPC control limits using historical data for the supported variable control and attribute control chart types. Alarms can be generated for standard +3 sigma control limits, or the WECO (Western Electric) rules. It will also calculate process capability ratios (Cp, Cpk) and process performance indices (Pp, Ppk). A set of specification limits can also be added to the chart.
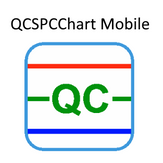
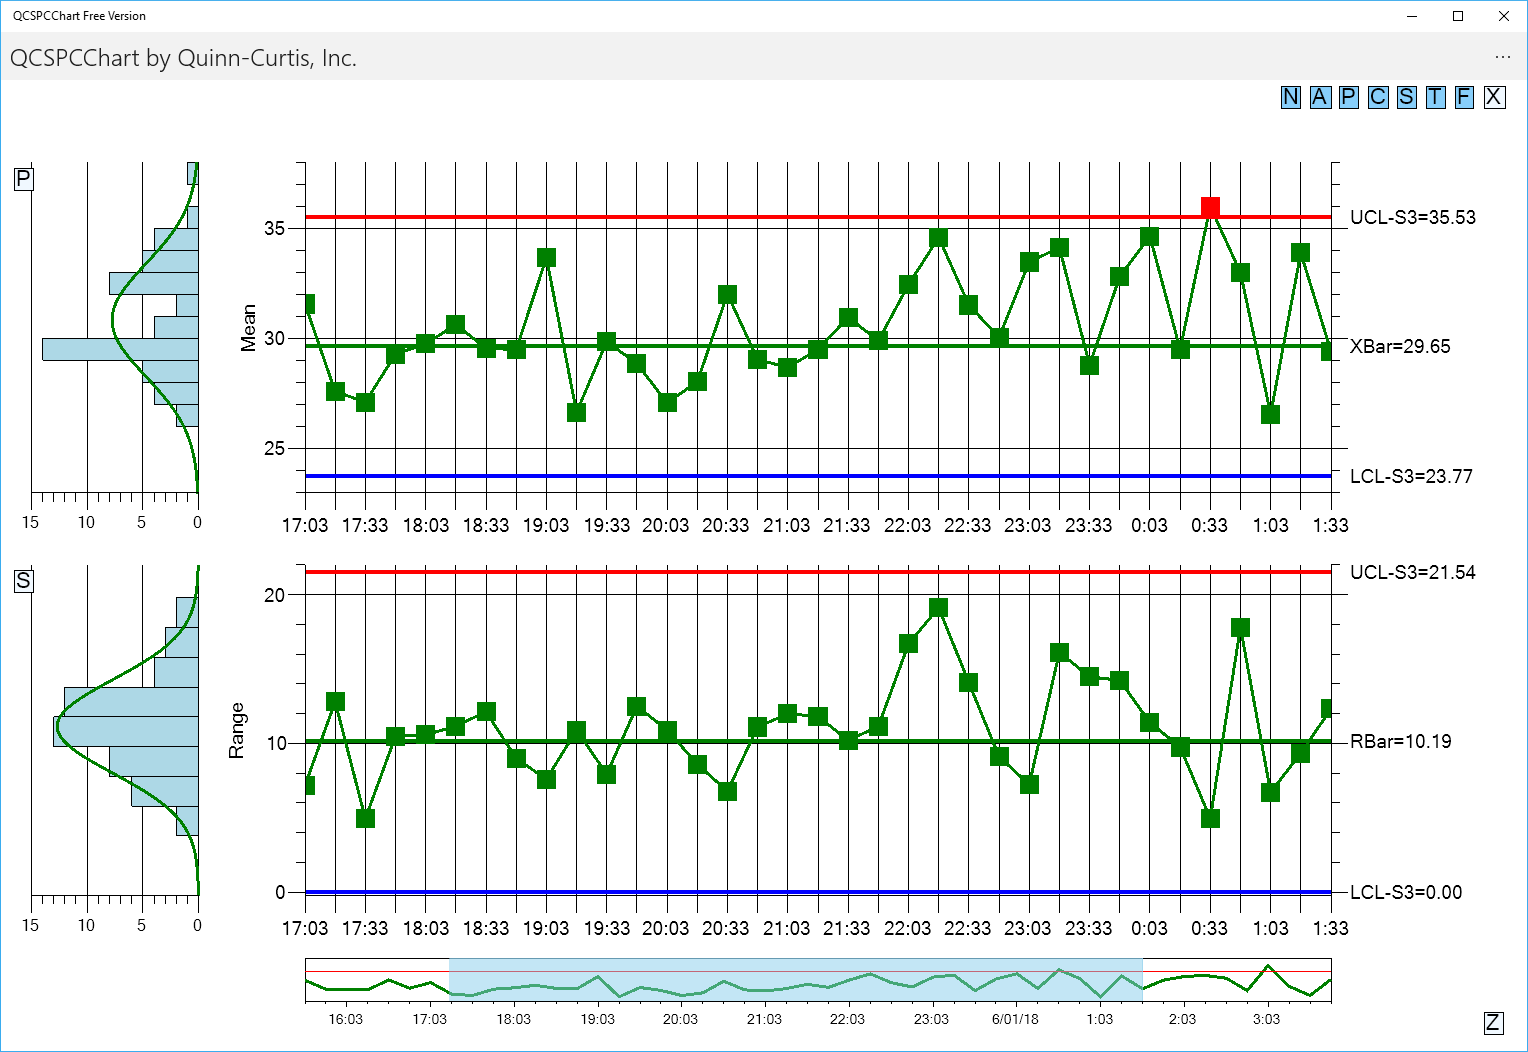
The SPC charts are displayed as one or two synchronized charts, under the control of a scroll bar. The scroll bar can be replaced by an integrated zoom control which allows for the display of charts with a custom time frame. Auto-scaling of the charts y-axes keeps everything in view. An integrated table appears above the chart, that displays information about the process under view, and each sample interval plotted in the chart. The table displays time, individual sample values, sample statistics, process indices, alarm status, and any notes entered for that sample interval.
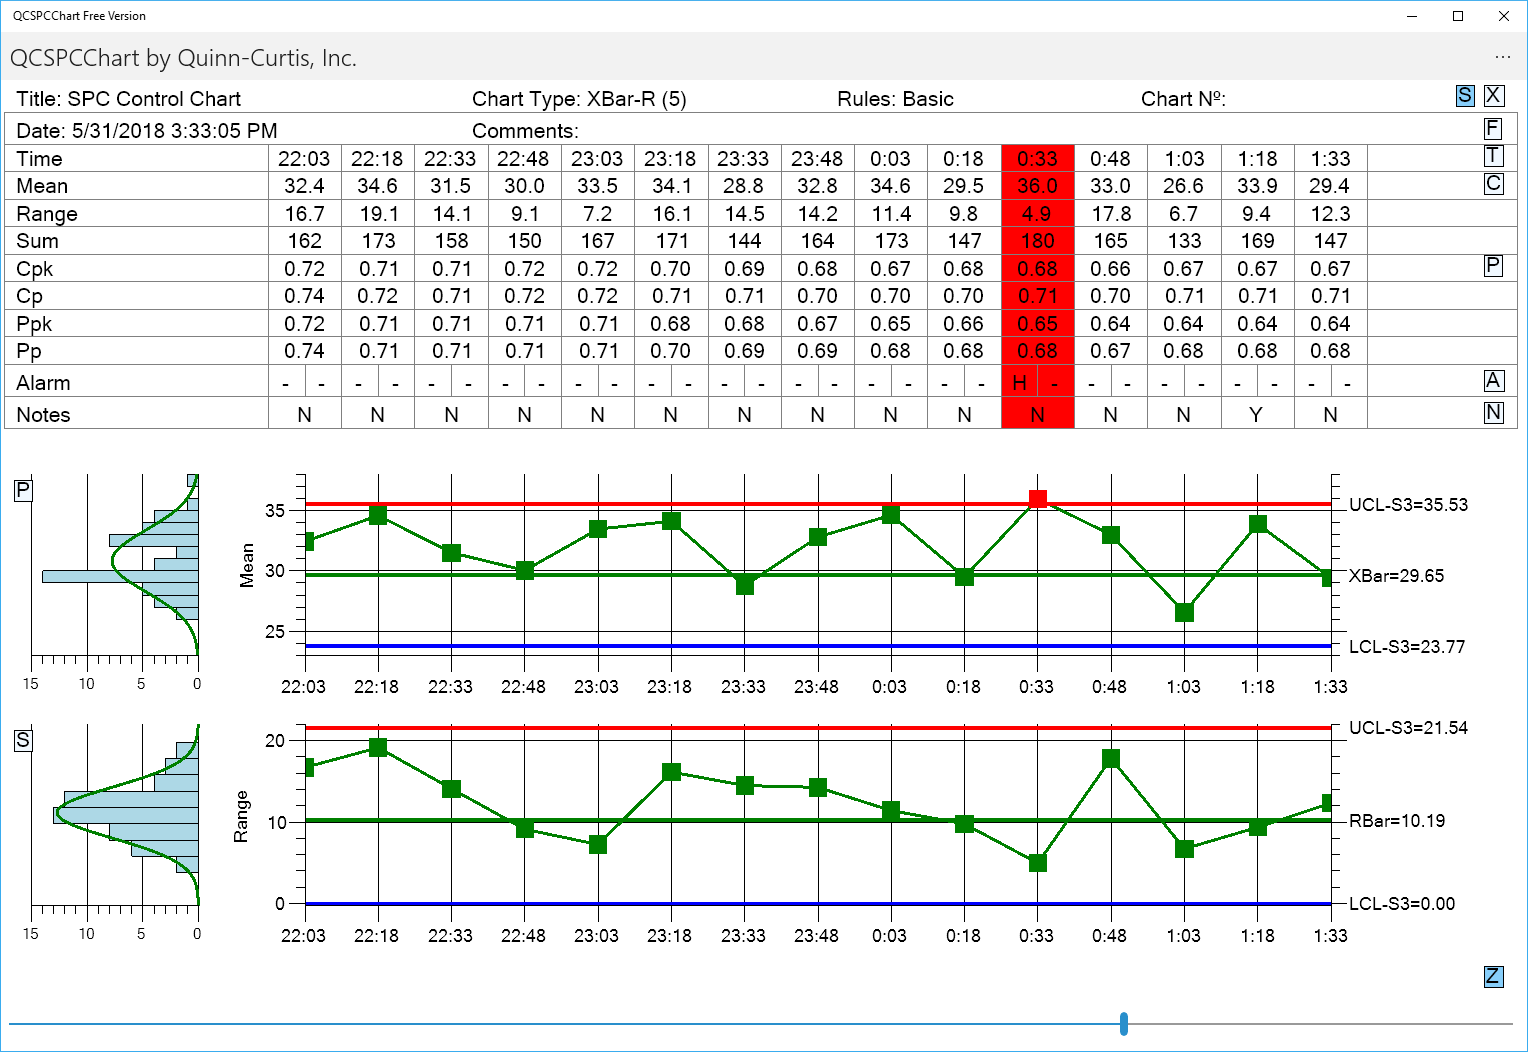
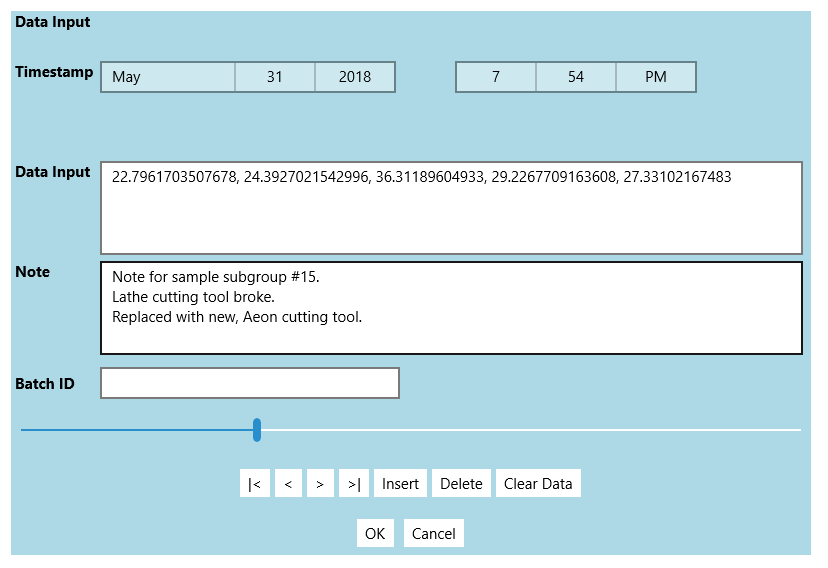
The user can customize the SPC chart and control limits using built-in setup forms. Both auto-calculated and manually set control limits are supported. The user can manually input and edit sample data from within the program. The user can also import sample data from a CSV (comma separated value) file. The entire chart setup, and data, can be saved on the host device so that they are easily accessible the next time you use the app. You can even set the current setup to be auto-loaded the next time the app starts.
This software is meant to be run on a device with a minimum display resolution of approximately 1200 x 800 pixels (landscape mode) or 800 x 1200 pixels (portrait mode). Display resolutions less than that may result in clipped text on the sides of the charts, tables and setup dialogs.
This app is the free version of the software and the total number of sample intervals (data points) which can be displayed at one time is limited to 100.
-
Variable Control Charts: XBar-R, XBar-Sigma, Individual-Range, and Median-Range
-
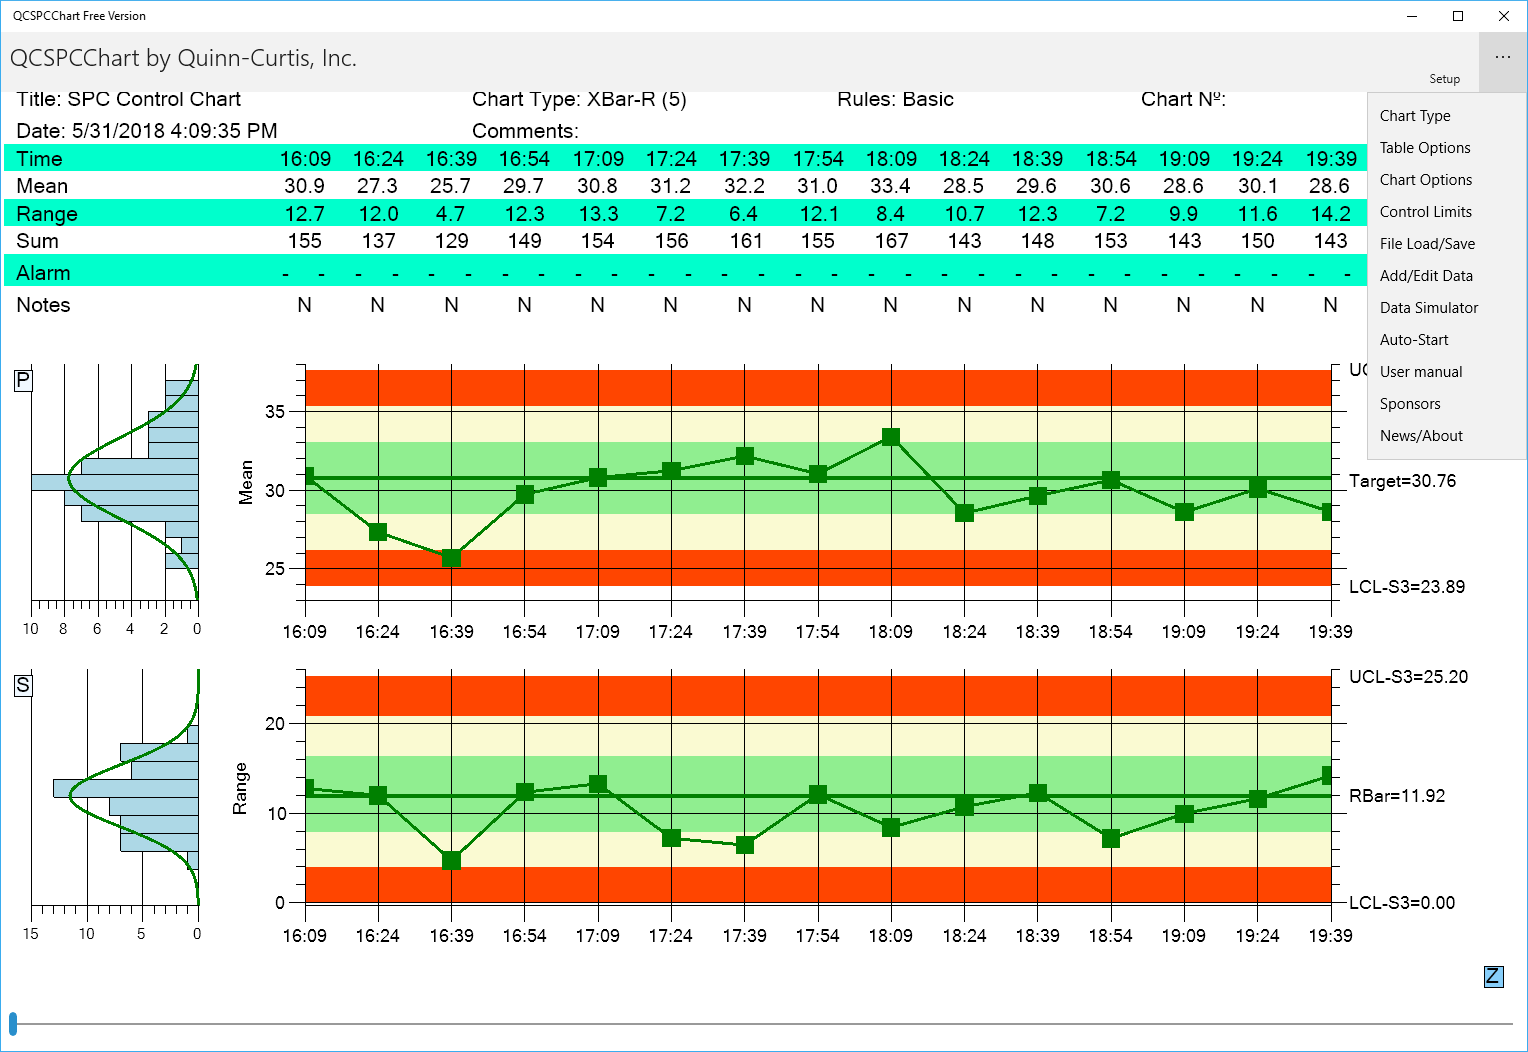
Attribute Control Charts for Defects: p-, np-, c-, u-, and DPMO charts)
-
Integrated table support for sample interval details
-
Synchronized scrolling of chart and table data
-
Zoom control for wide or narrow view of data
-
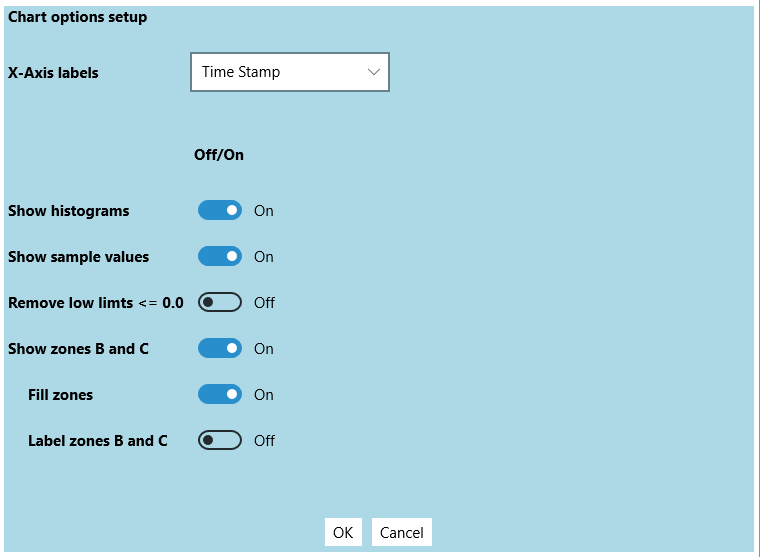
Wide array of setup options for chart and control limit customization
-
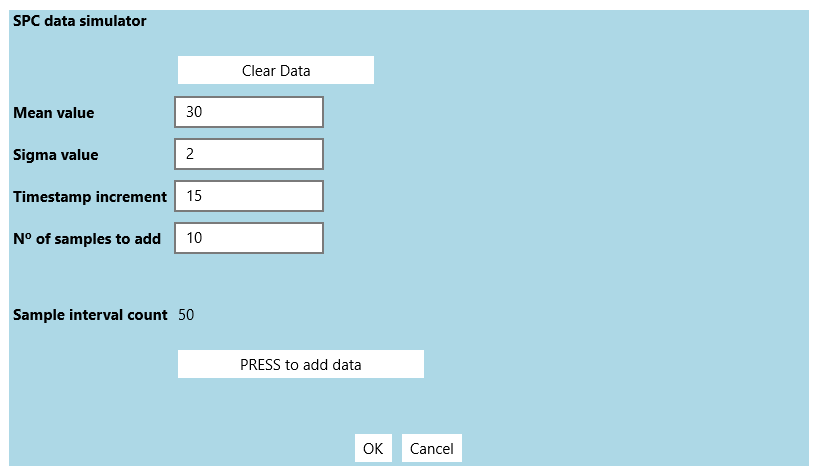
Data simulator for all chart types
-
Sample data input using device keyboard, or from a CSV file
-
SPC control limits can be set using standard algorithms, or manually to known values
-
High and low specification limits
-
Chart setup can be saved to a local setup file
-
App includes localization for English, Spanish, Portuguese, French, German, and Italian
-
Online user manual (English only at this time)
-
Alarm, notes and data tooltips with the touch or a finger, or click of a mouse
-
Buttons on the sides of the charts and table allow the user to minimize table and chart options, freeing up more space for the desired chart
-
The integrated table can display process capability (Cp, Cpk) and process performance (Pp, Ppk) values.