
Description
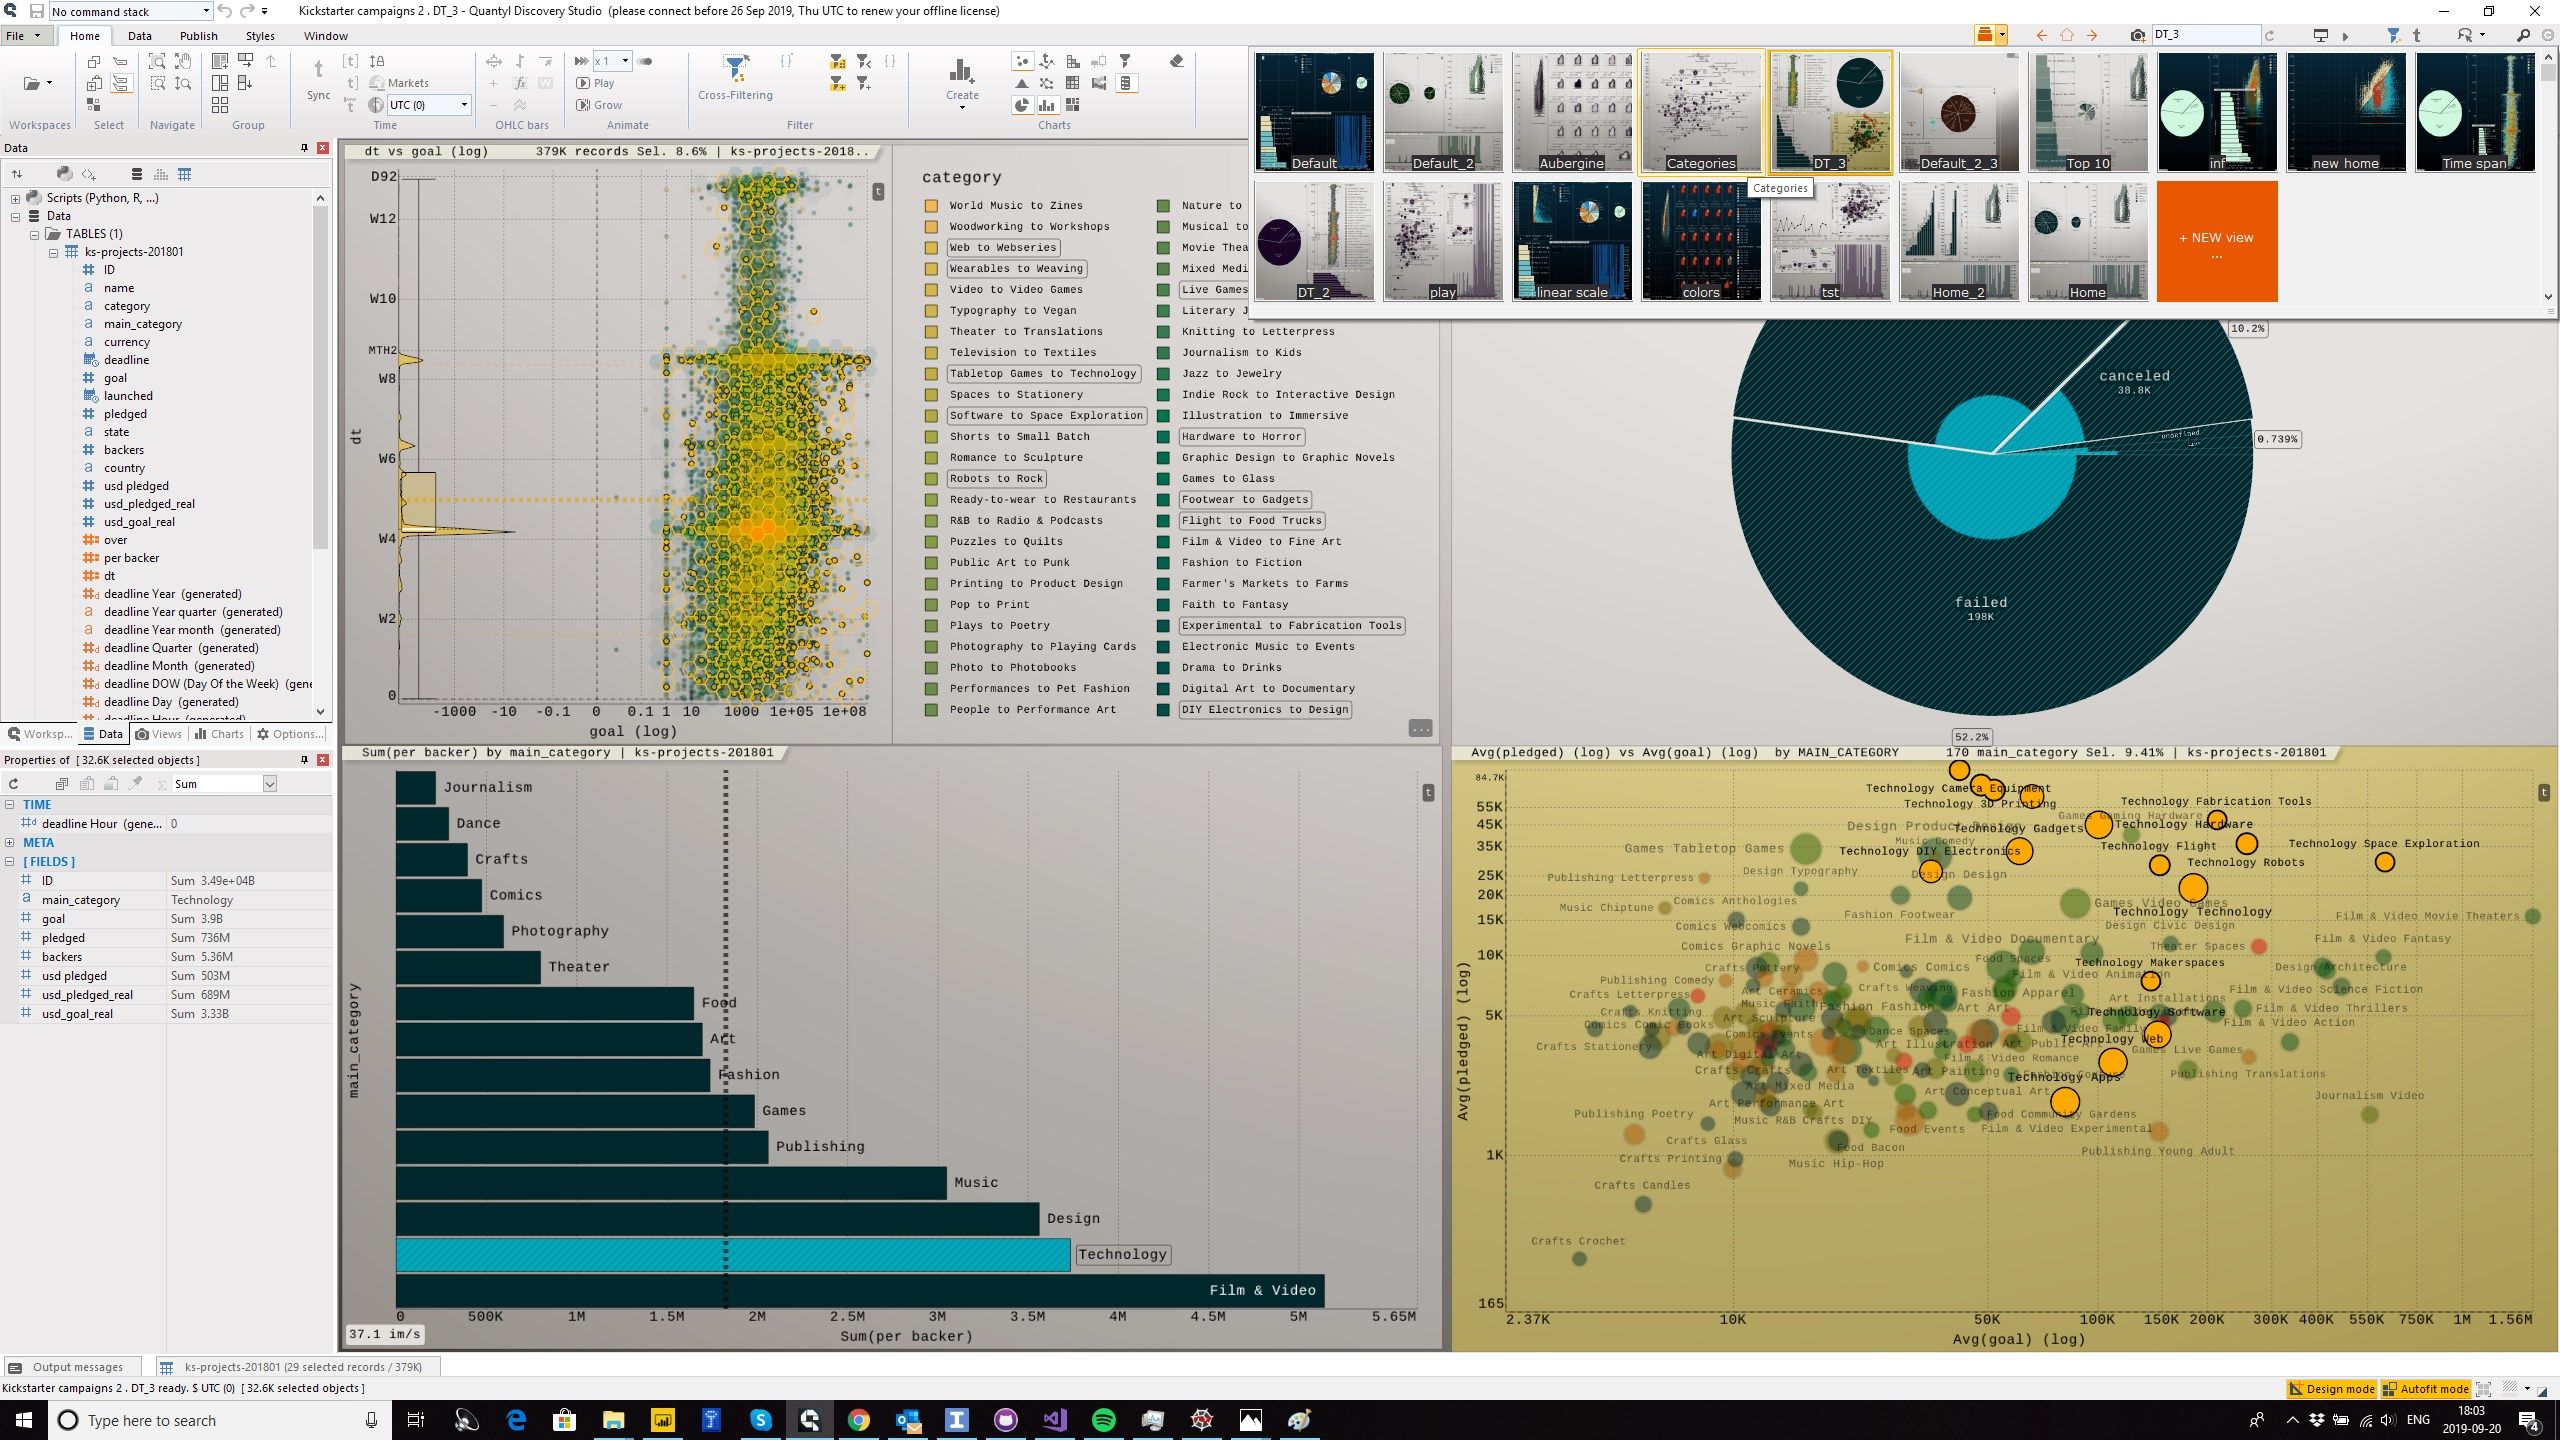
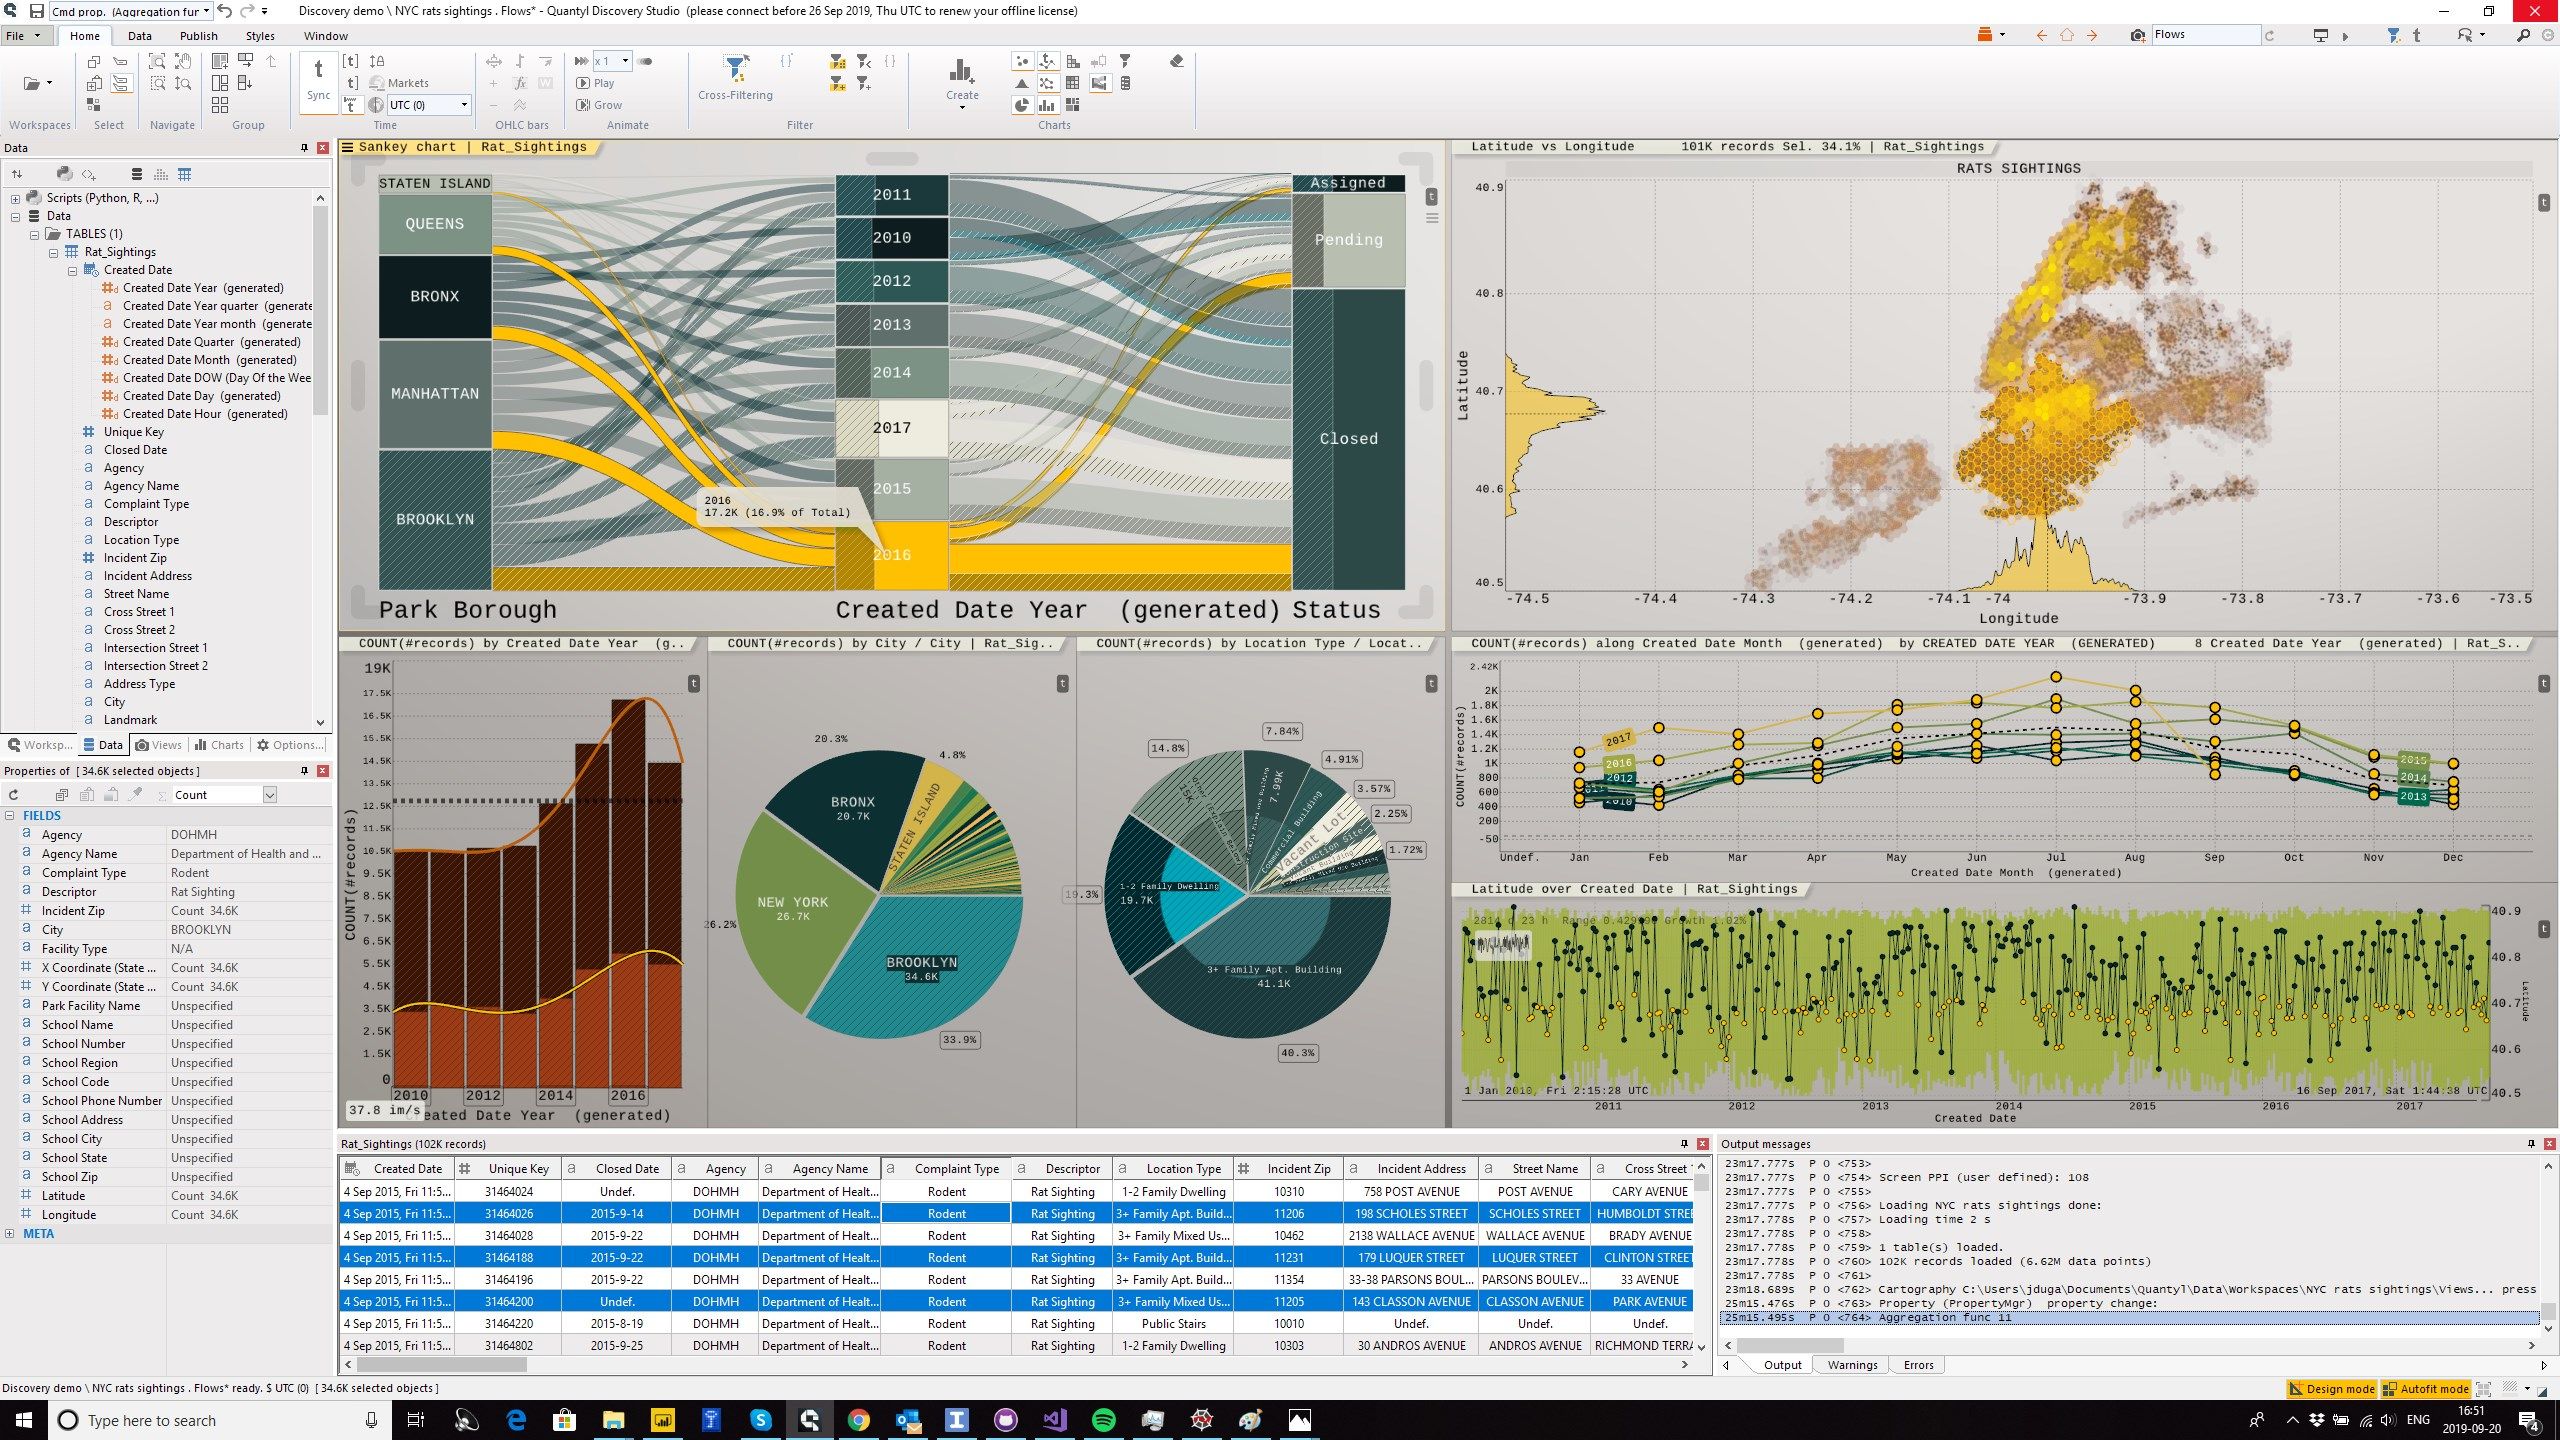
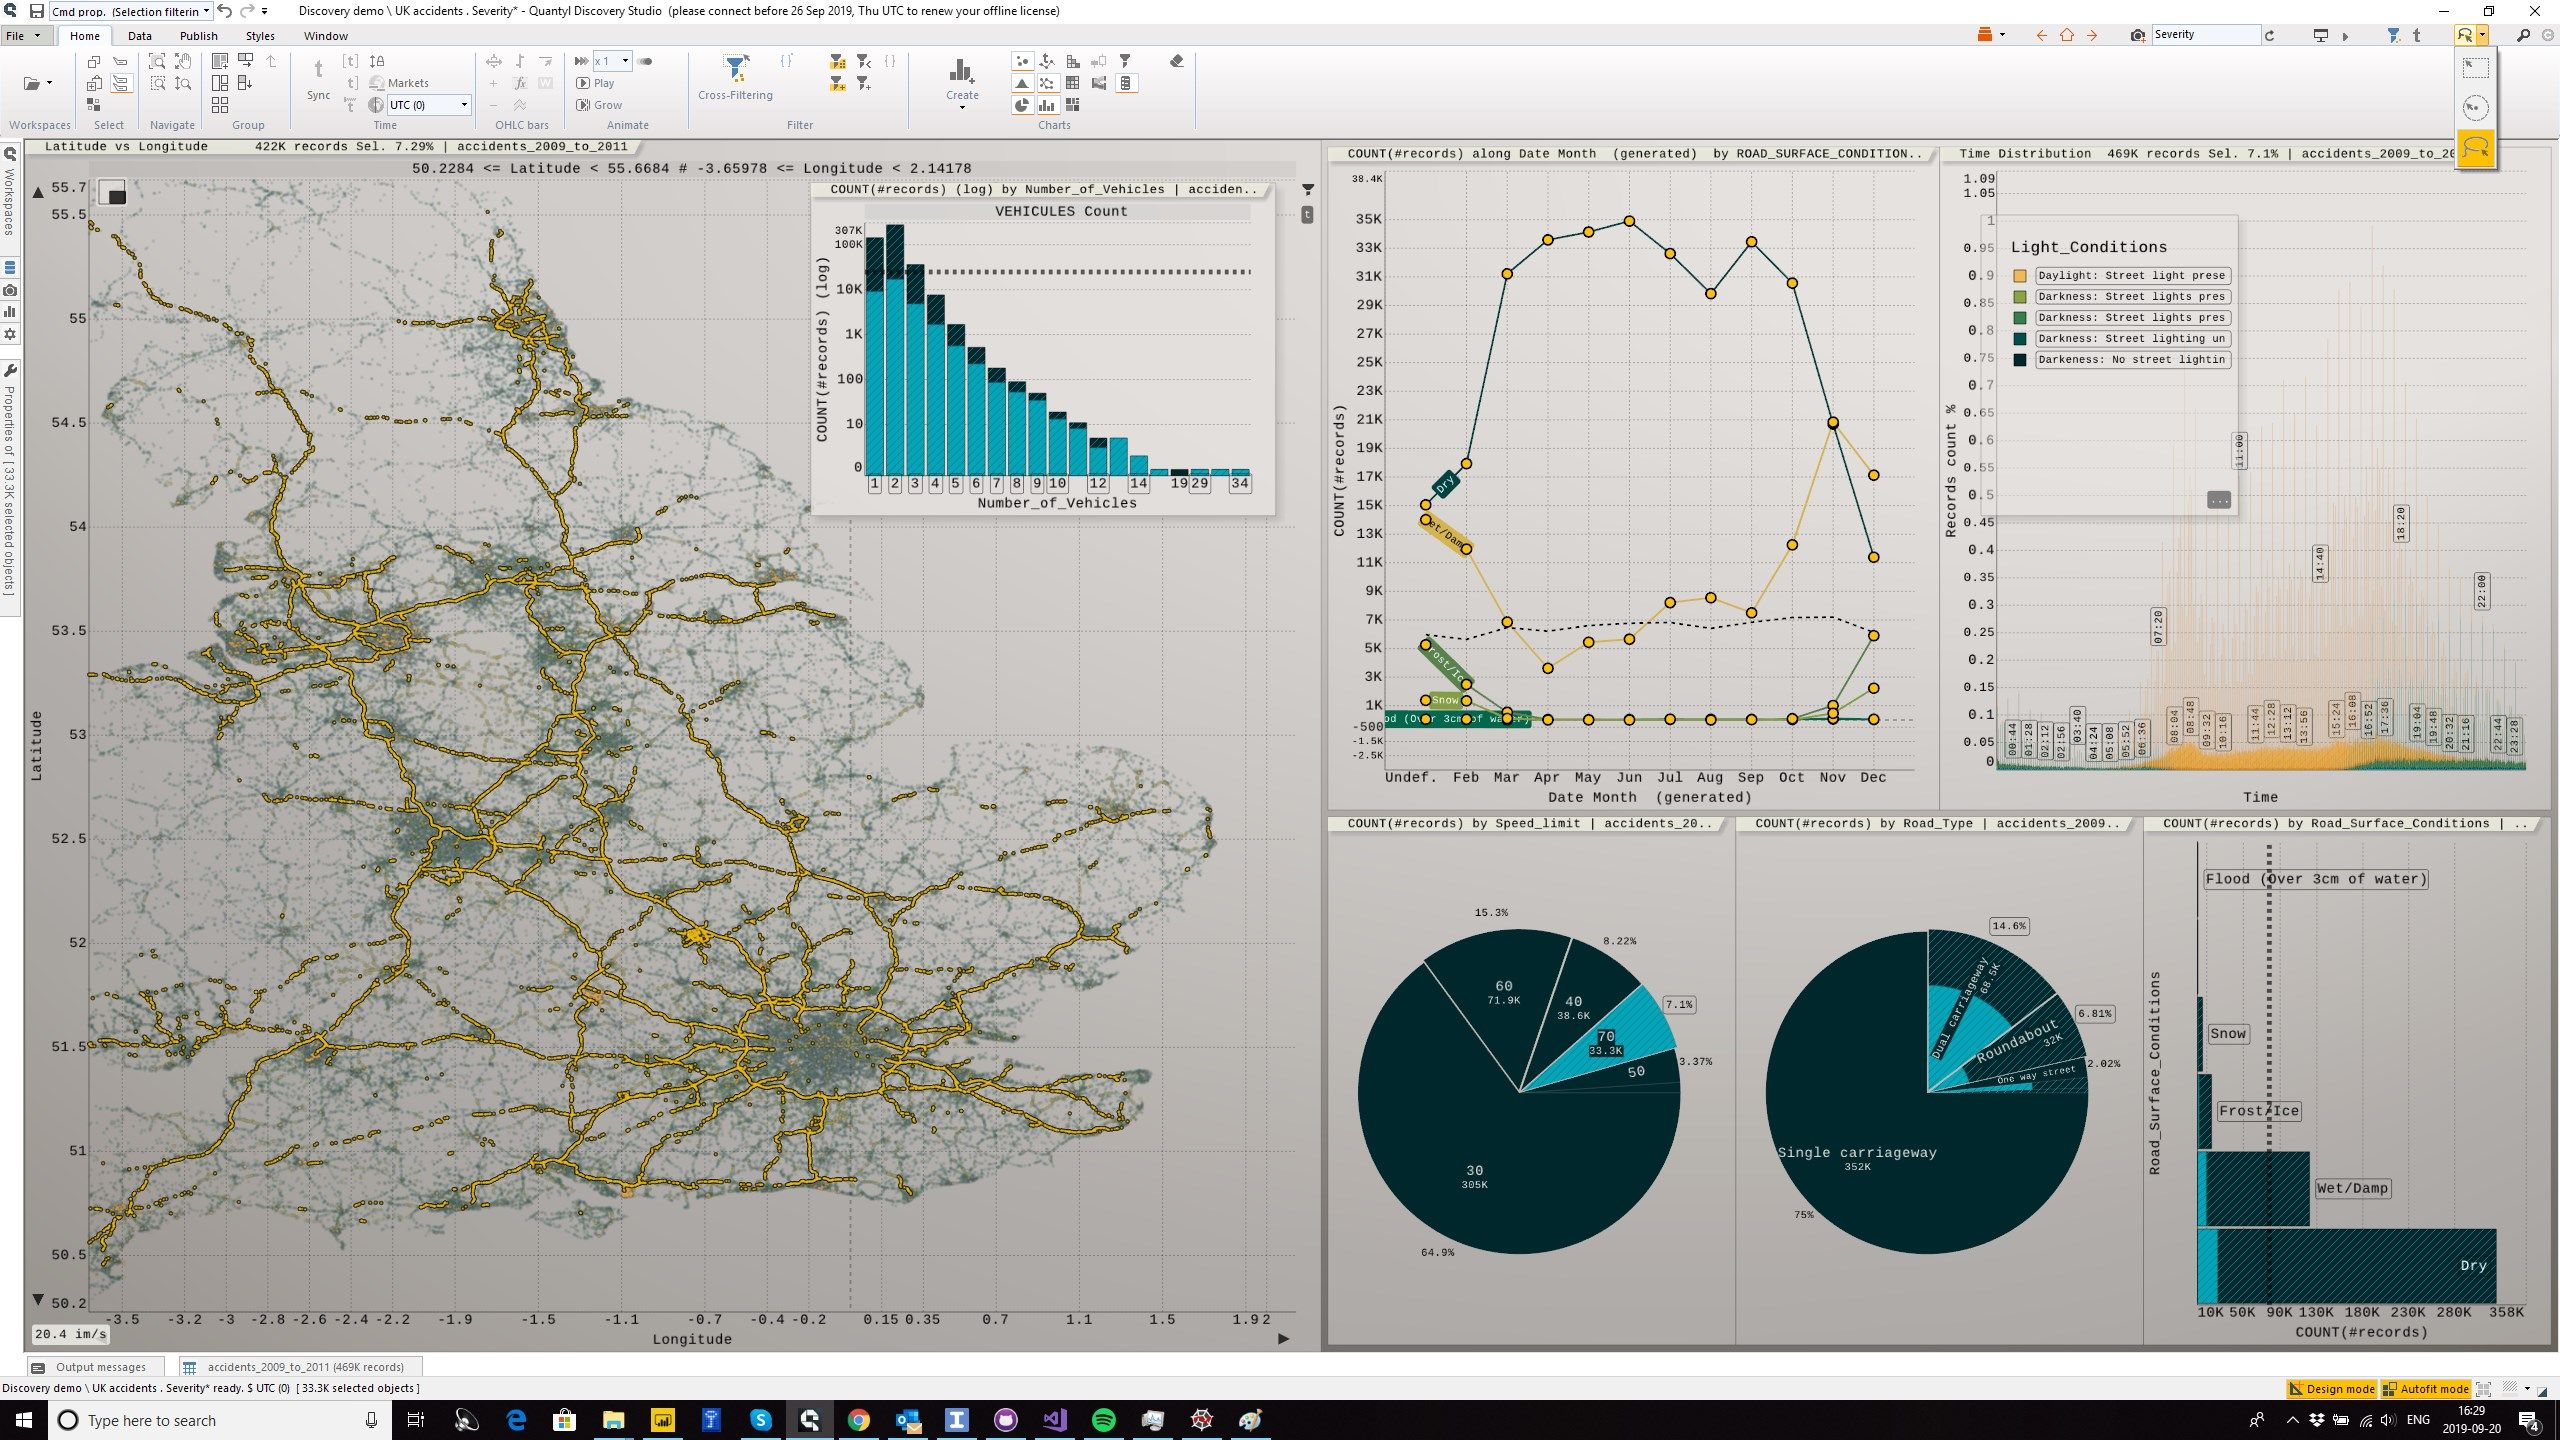
Quantyl Discovery offers a unique experience dedicated to tabular data discovery, visualization and analytics. It was designed from the ground up for maximum performances and interactivity on PC. Effortlessly interact with millions of rows on a standard laptop, with or without aggregation!
Unlike BI tools, Quantyl Discovery enables you to search, select and filter anyway you want to, from coarse-grained (aggregated) to fine-grained analytics. This innovative All-in-one software is able to work offline, your data stays with you and stays private (no data upload).
From raw datasets to charts in seconds:
• Quickly ingest large (up to GByte-size) text files like .csv or databases (ODBC 64-bit)
• Connect to your favorite data sources through Python and R scripts
• Create and customize highly interactive charts and graphs from a rich library
• Easily create multiple views with multiple charts in an innovative 100% zoomable interface
• Aggregate data whenever you need it
• Carry out interactive cross-selecting (selection brushing)
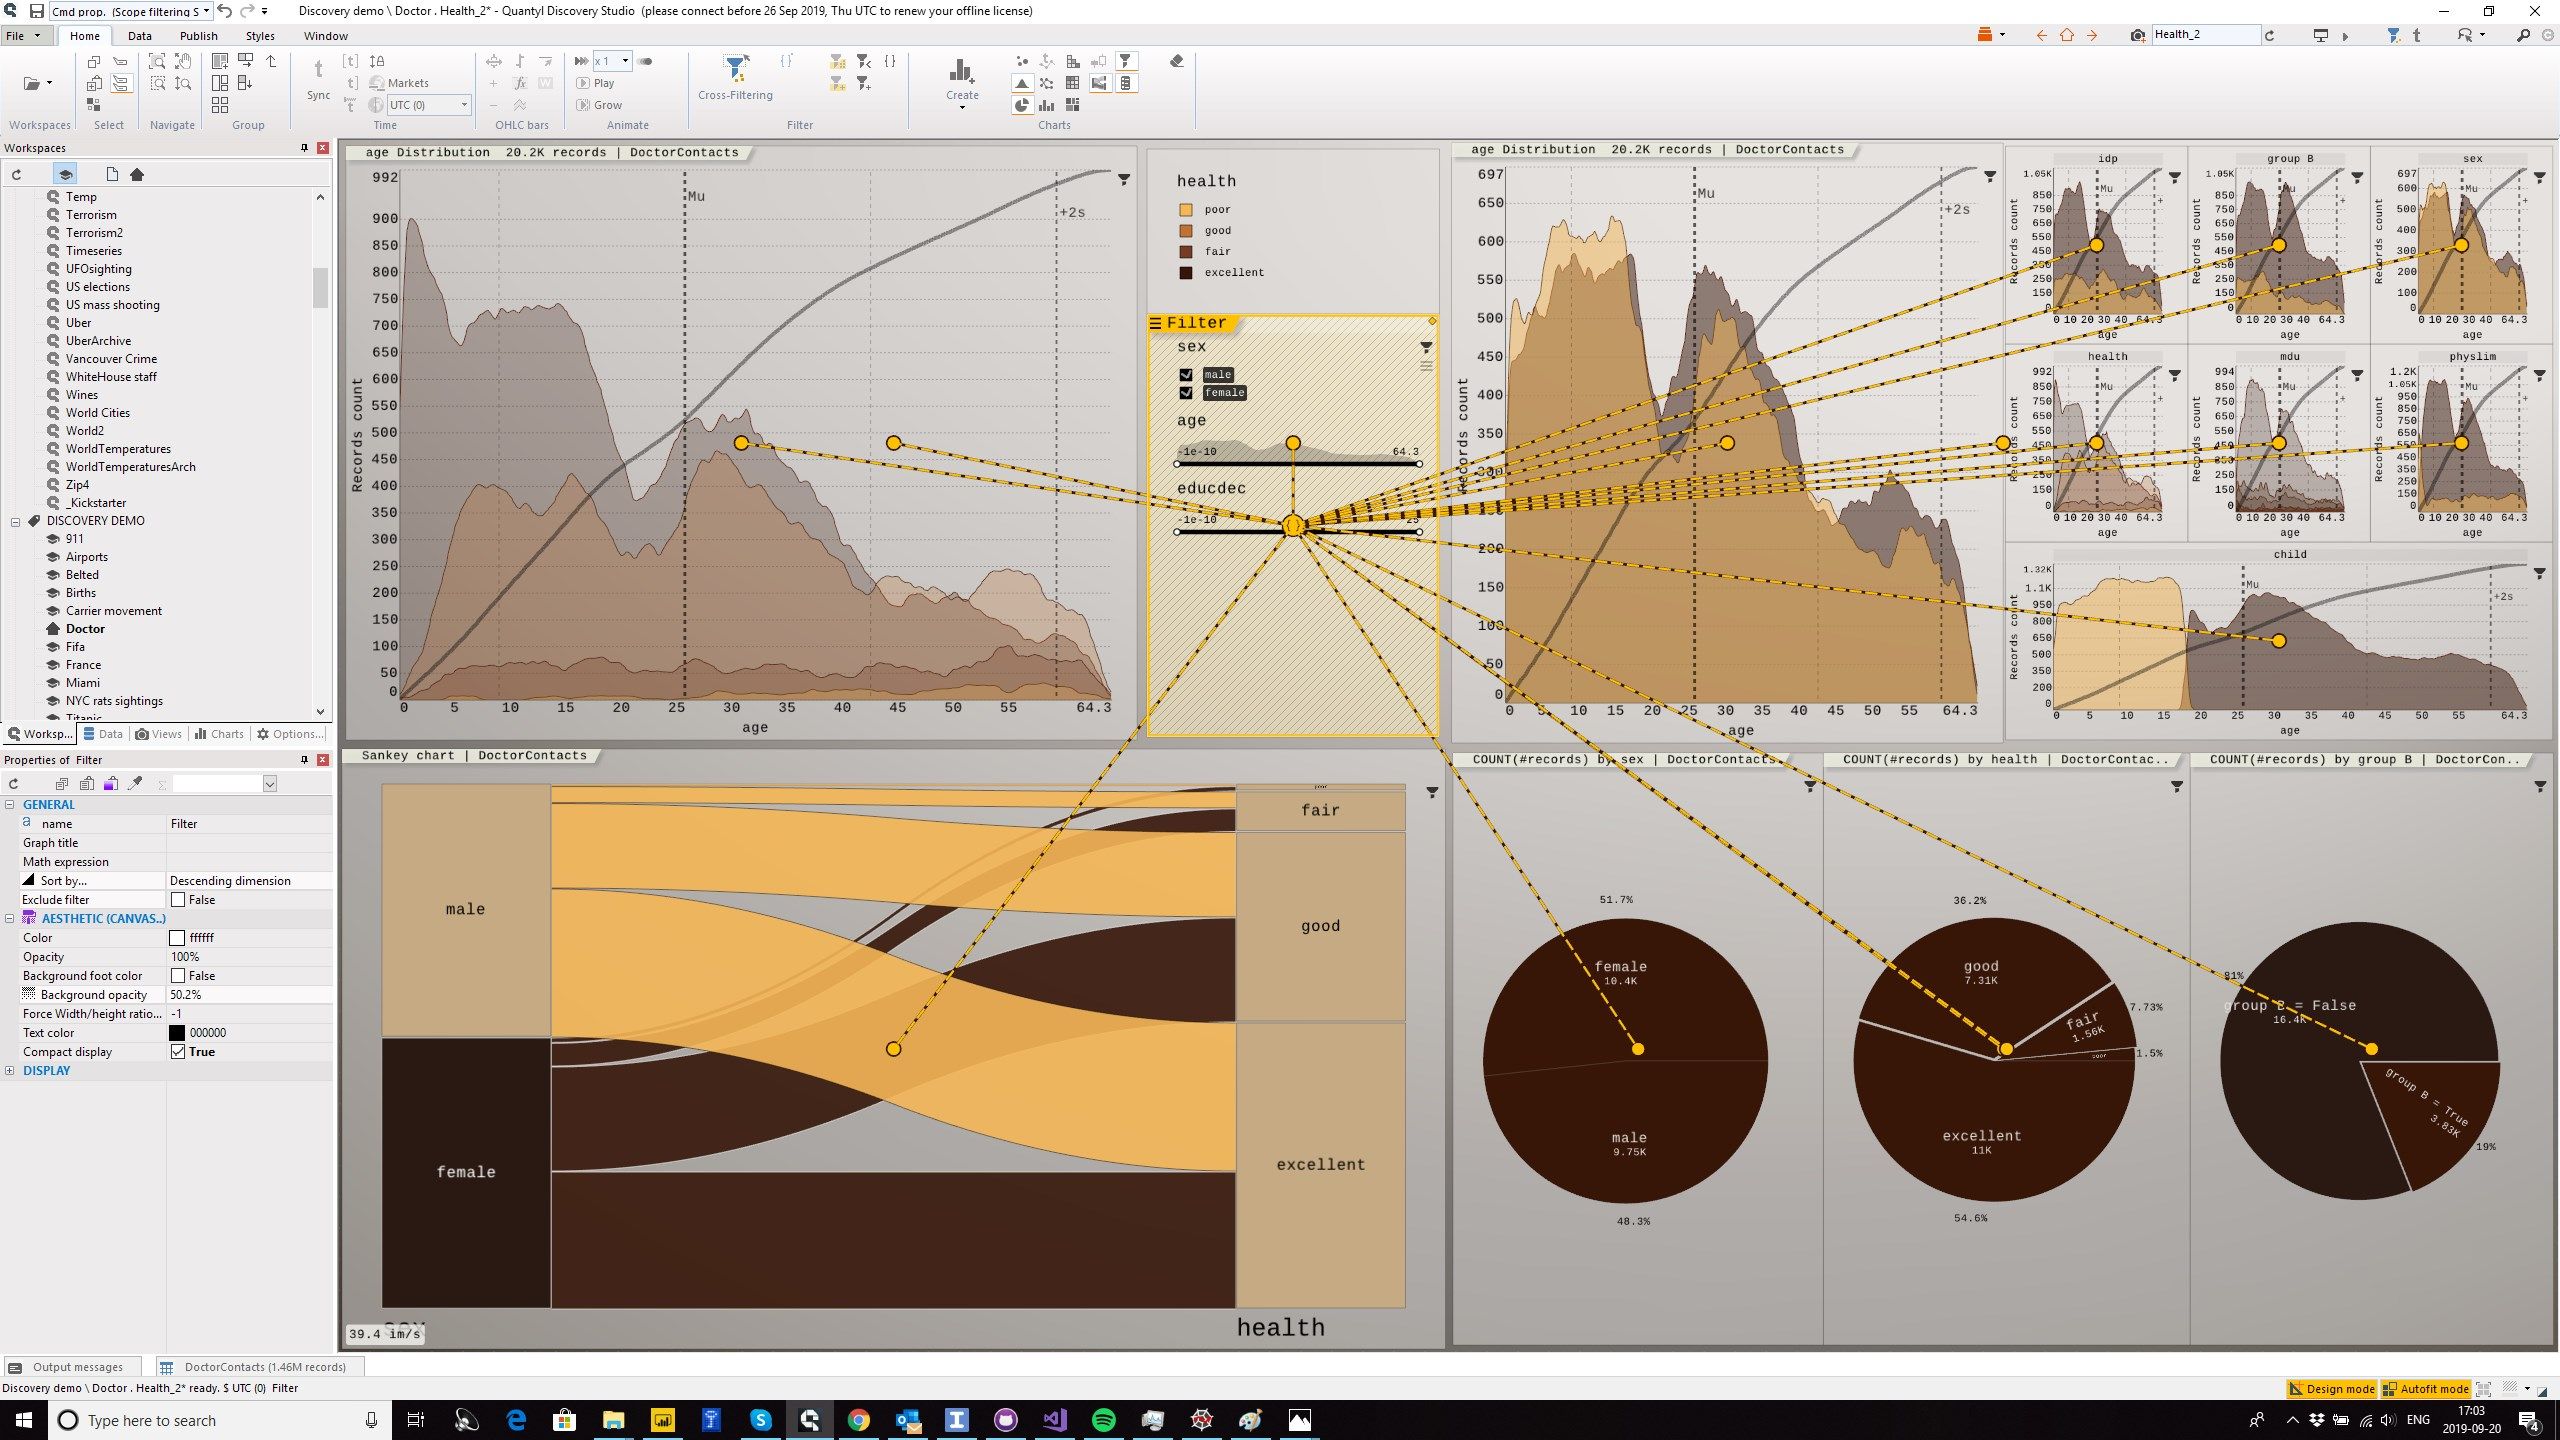
• Perform cross-filtering with a variety of tools (drill down)
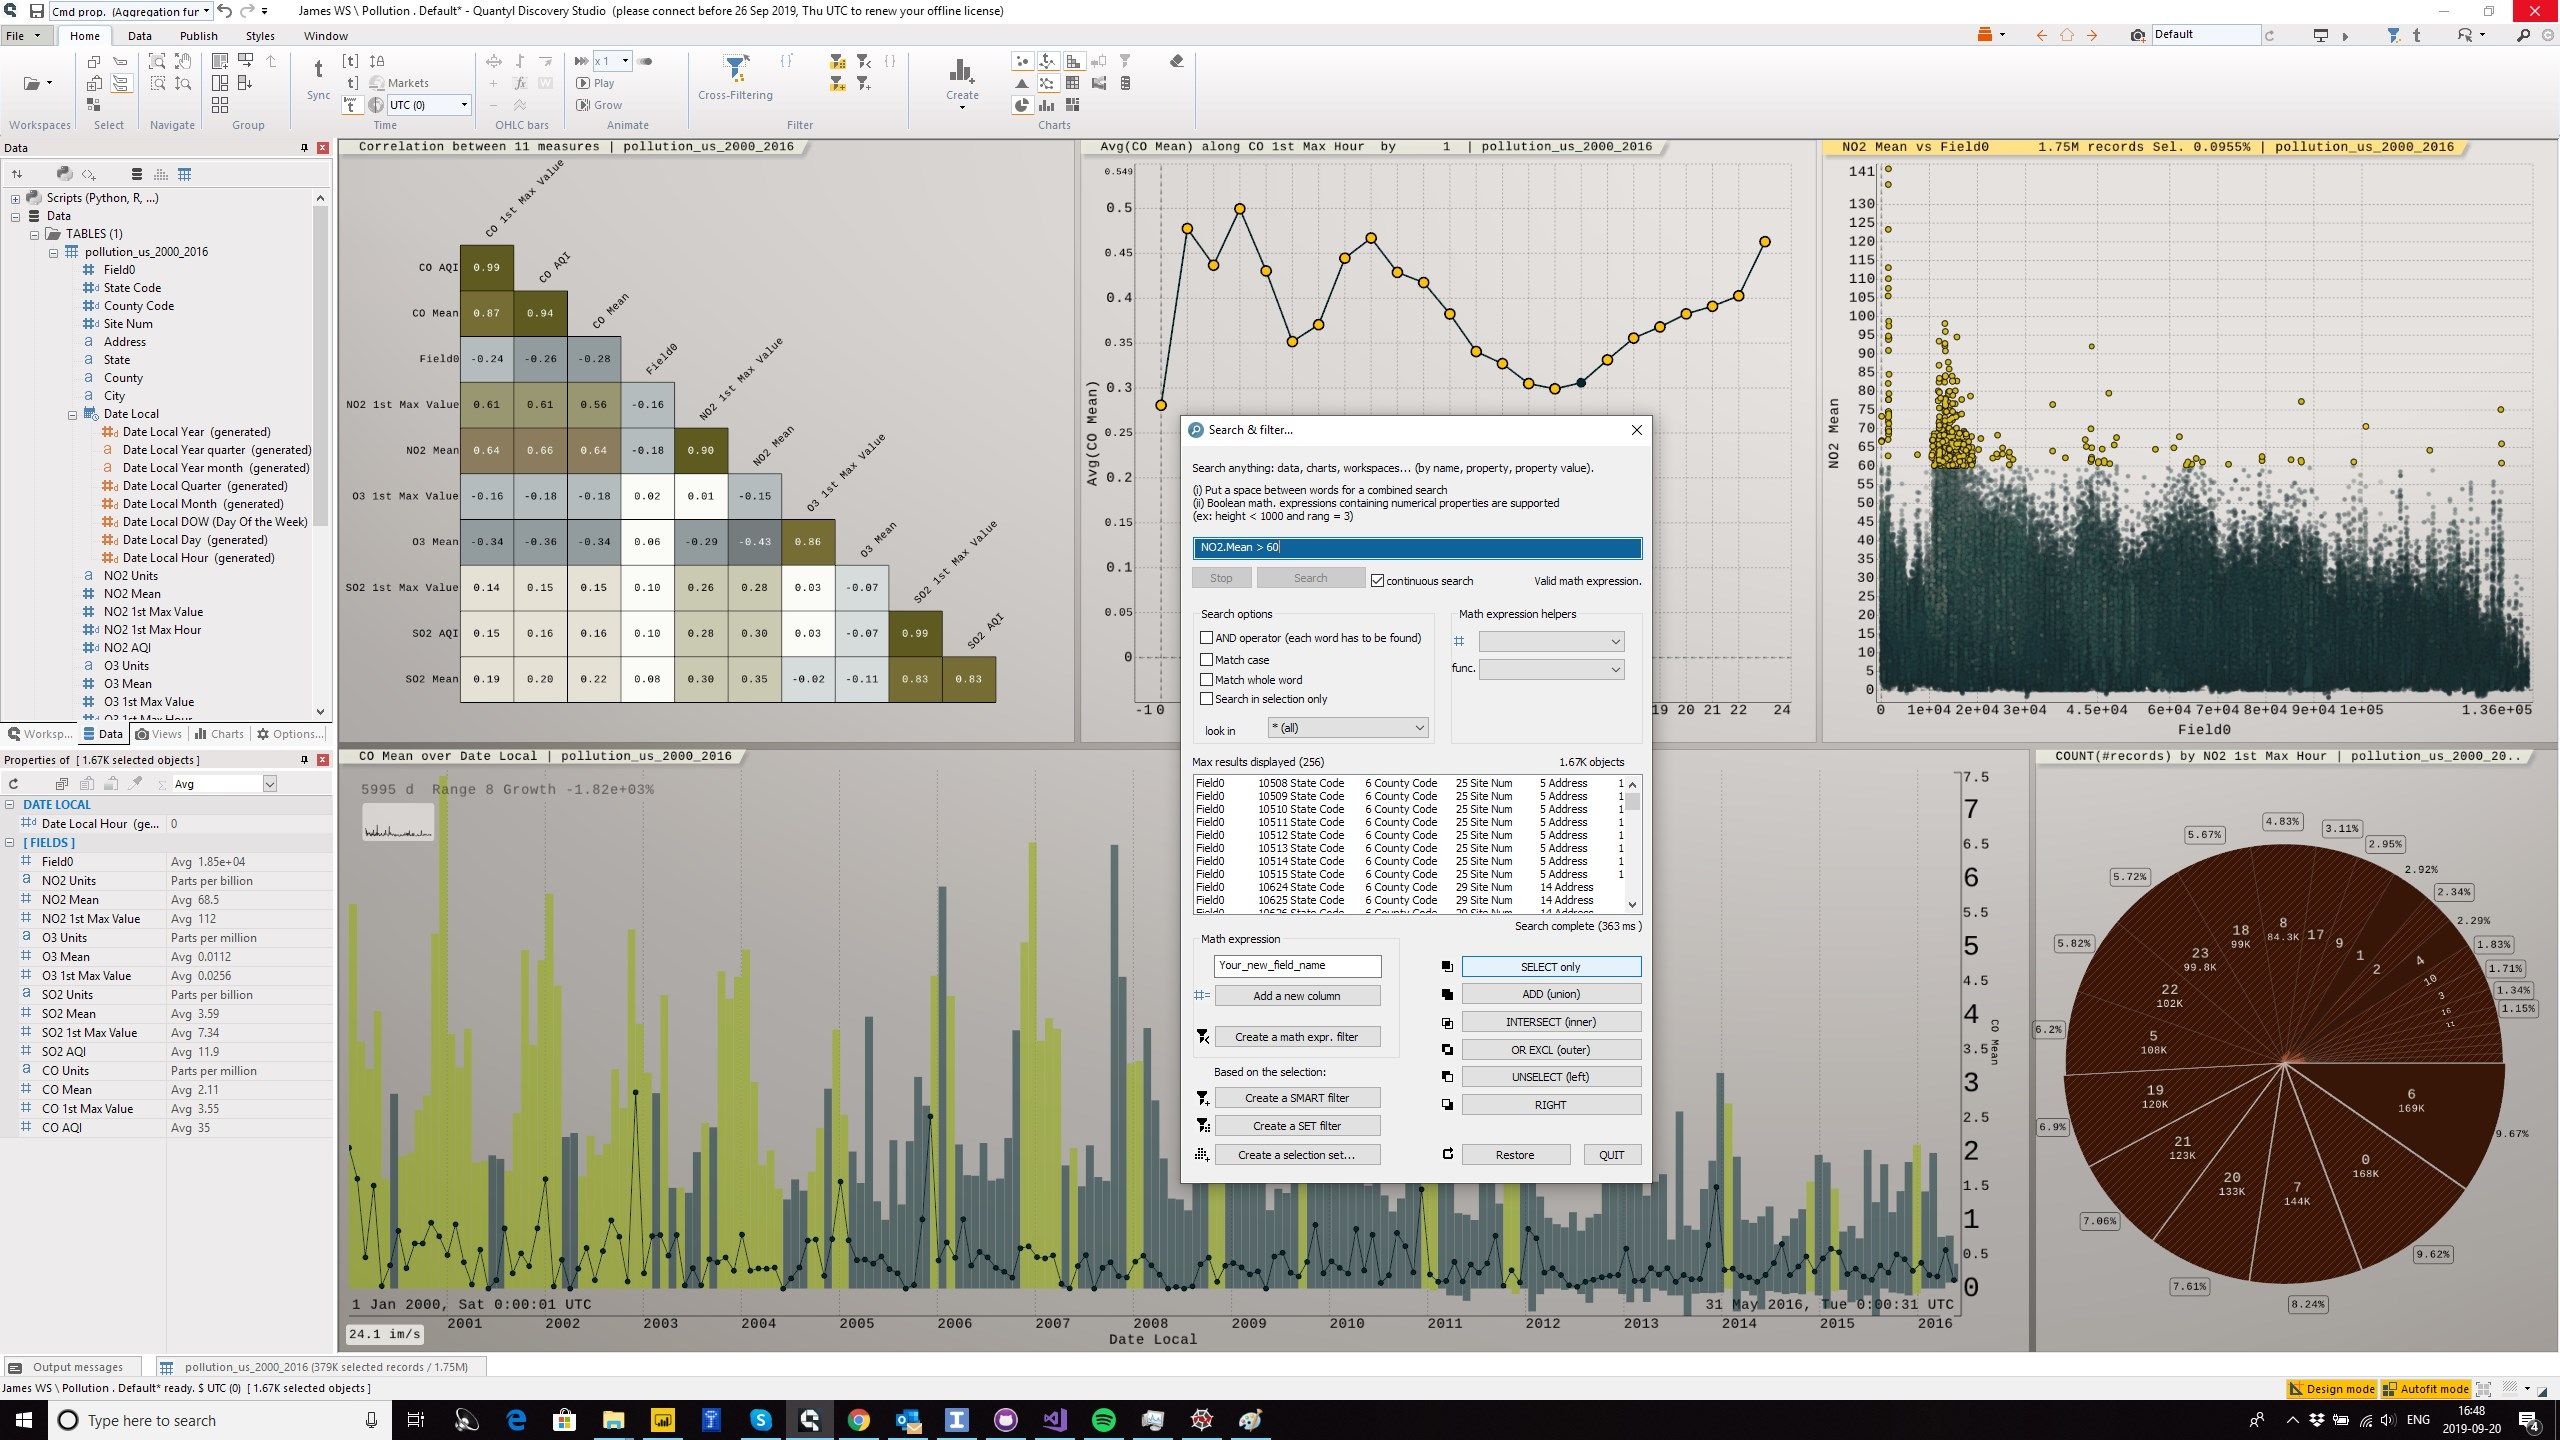
• Carry out powerful searches on any data, including mathematical expressions
• Animate any data you need—from time to measurements or dimensions
• … and so much more!
Coding is obviously NOT required for you to use this product. If you’re a data scientist, however, simple APIs are provided for Python and R so you can import and transform data back and forth between your environment and Quantyl Discovery. Work from your favorite IDE or launch Python and R scripts directly from the user interface.
See and experience it yourself with your own data! We offer a feature-complete trial period and switch to the Free Edition when this period is over.
F R E E Edition imports and saves up to 30,000 rows of data per table.
It also allows to explore any project for free. We believe you should have free and perpetual access to your own content—just like for photos or videos.
Available in-App purchases:
E S S E N T I A L Edition imports and saves up to 1,000,000 rows of data per table (Perpetual license)
A D V A N C E Edition imports and saves up to 15,000,000 rows of data per table (Perpetual license)
U N L I M I T E D Edition imports and saves unlimited rows of data per table (Subscription)
-
Visualize, navigate and interact with millions of rows on a "standard" Windows 10/11 laptop in a zoomable and morphic user interface
-
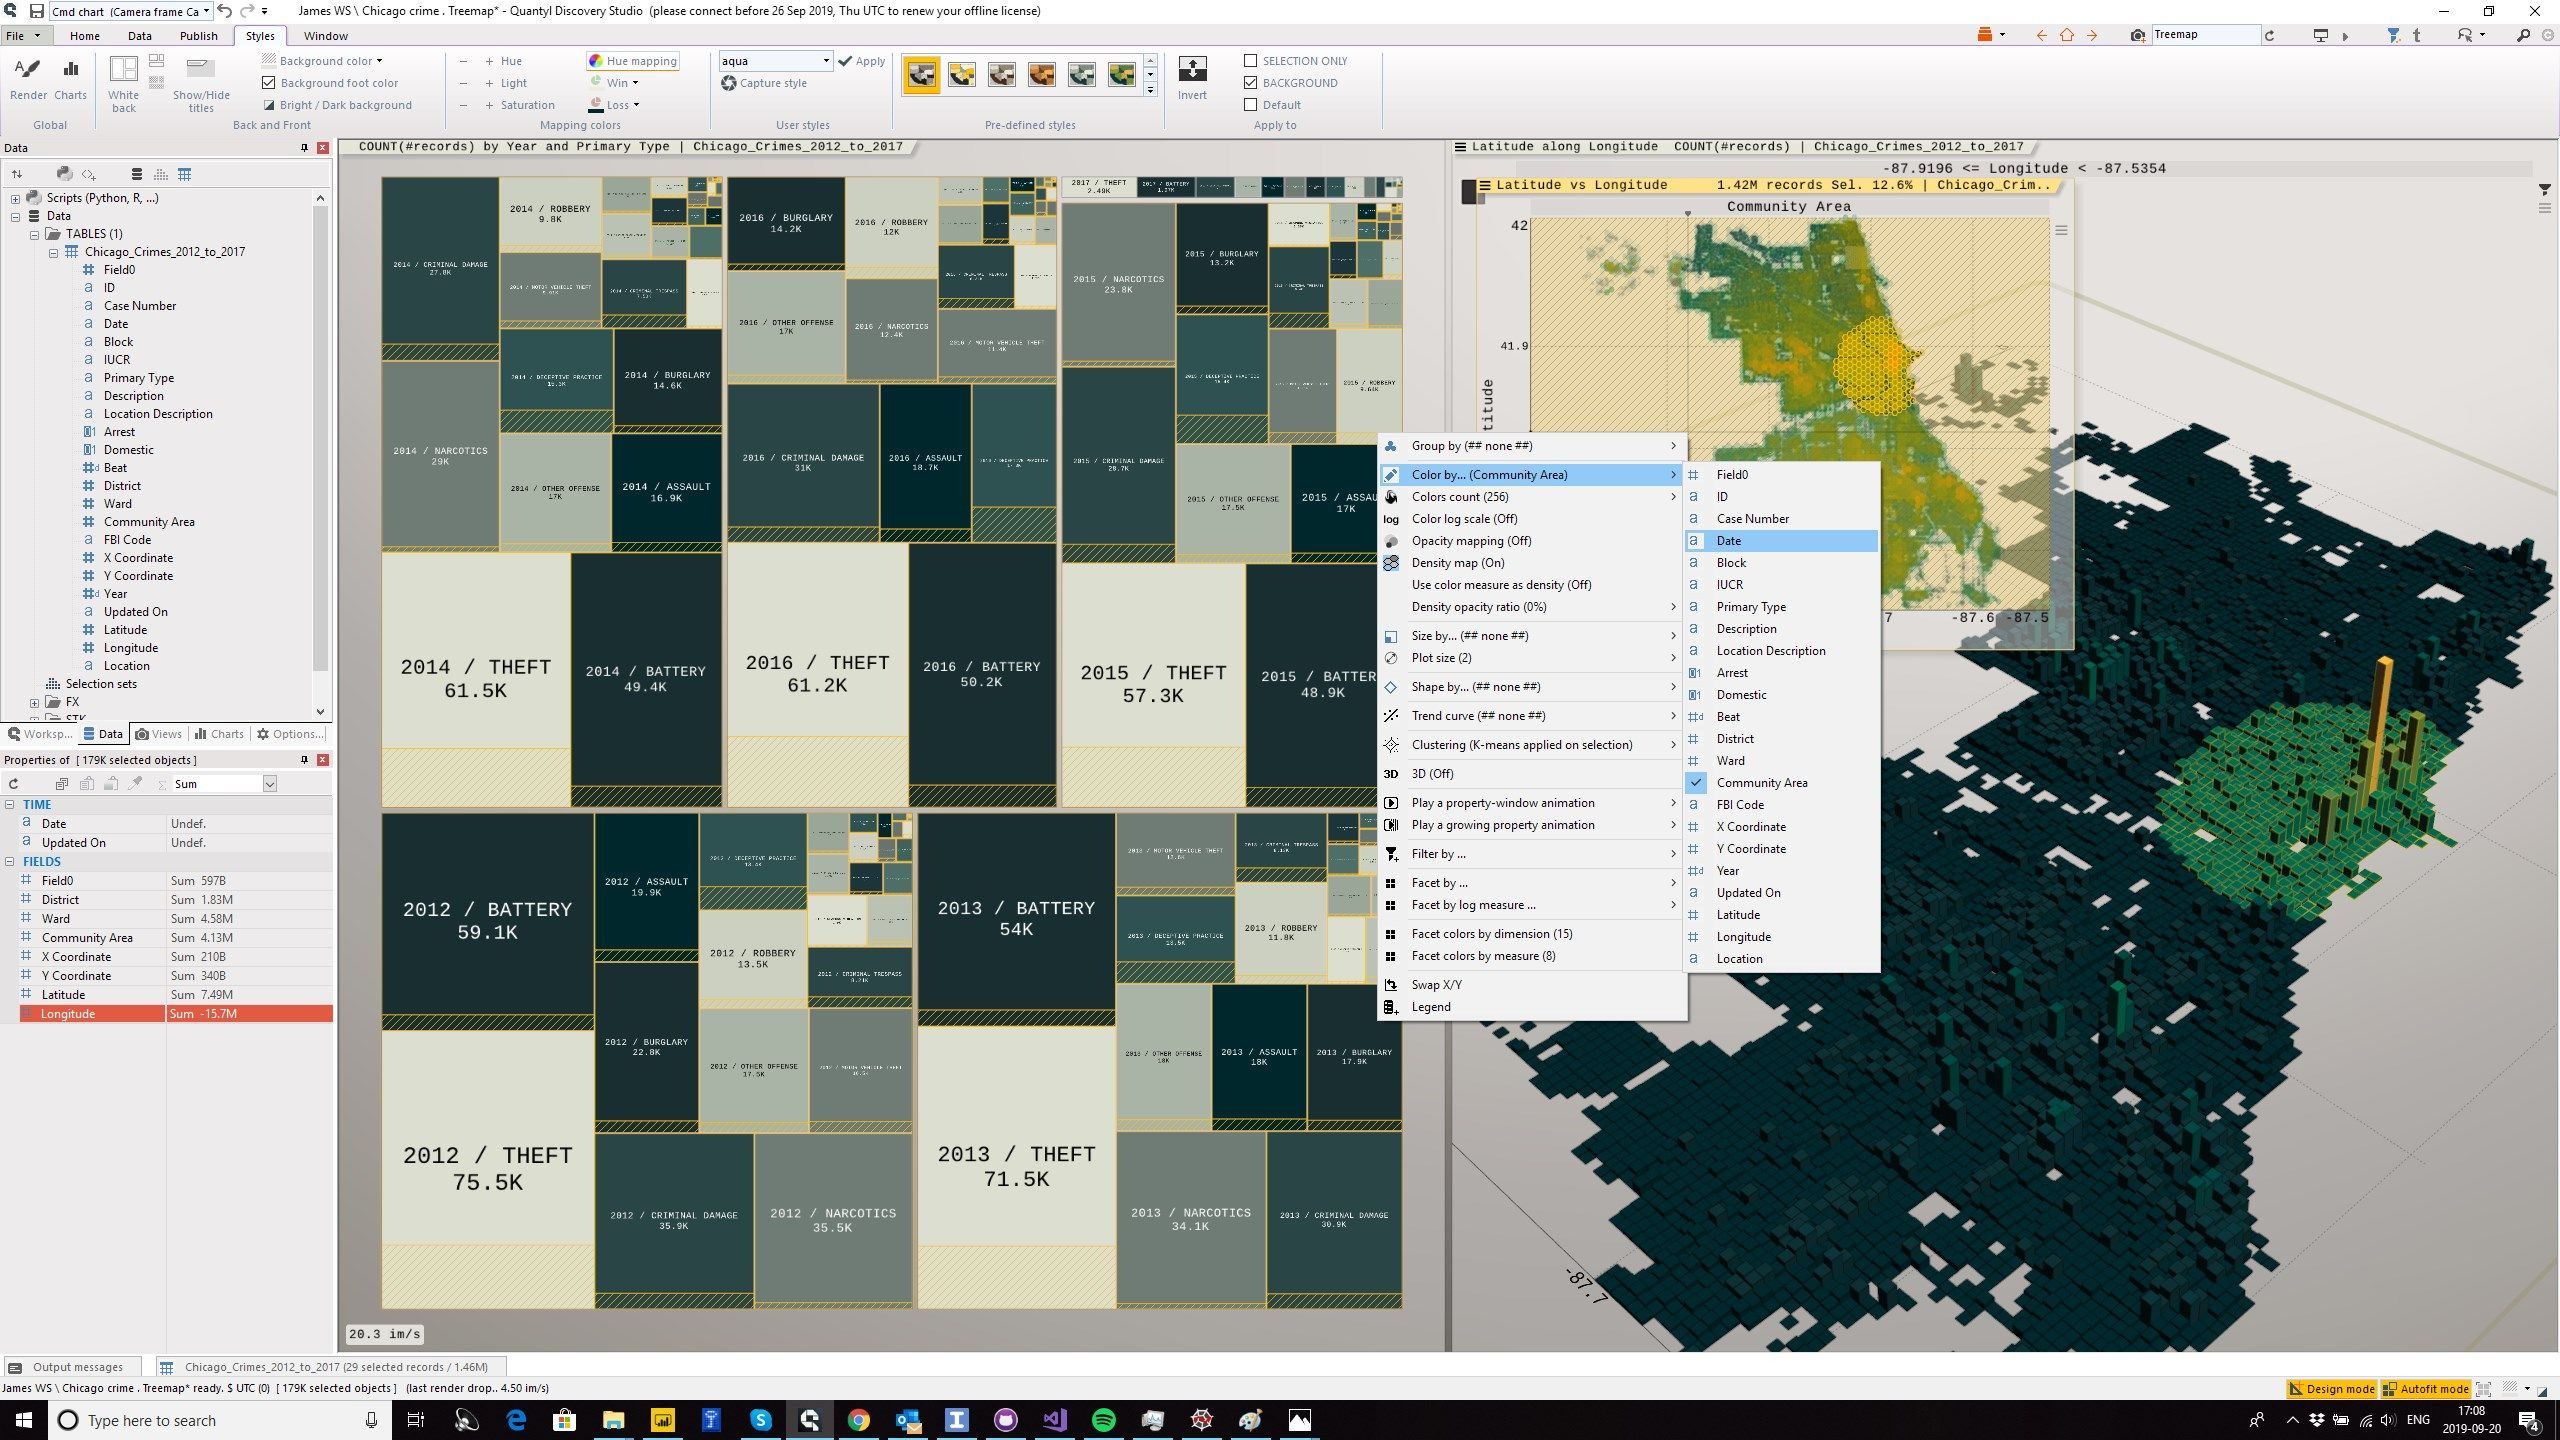
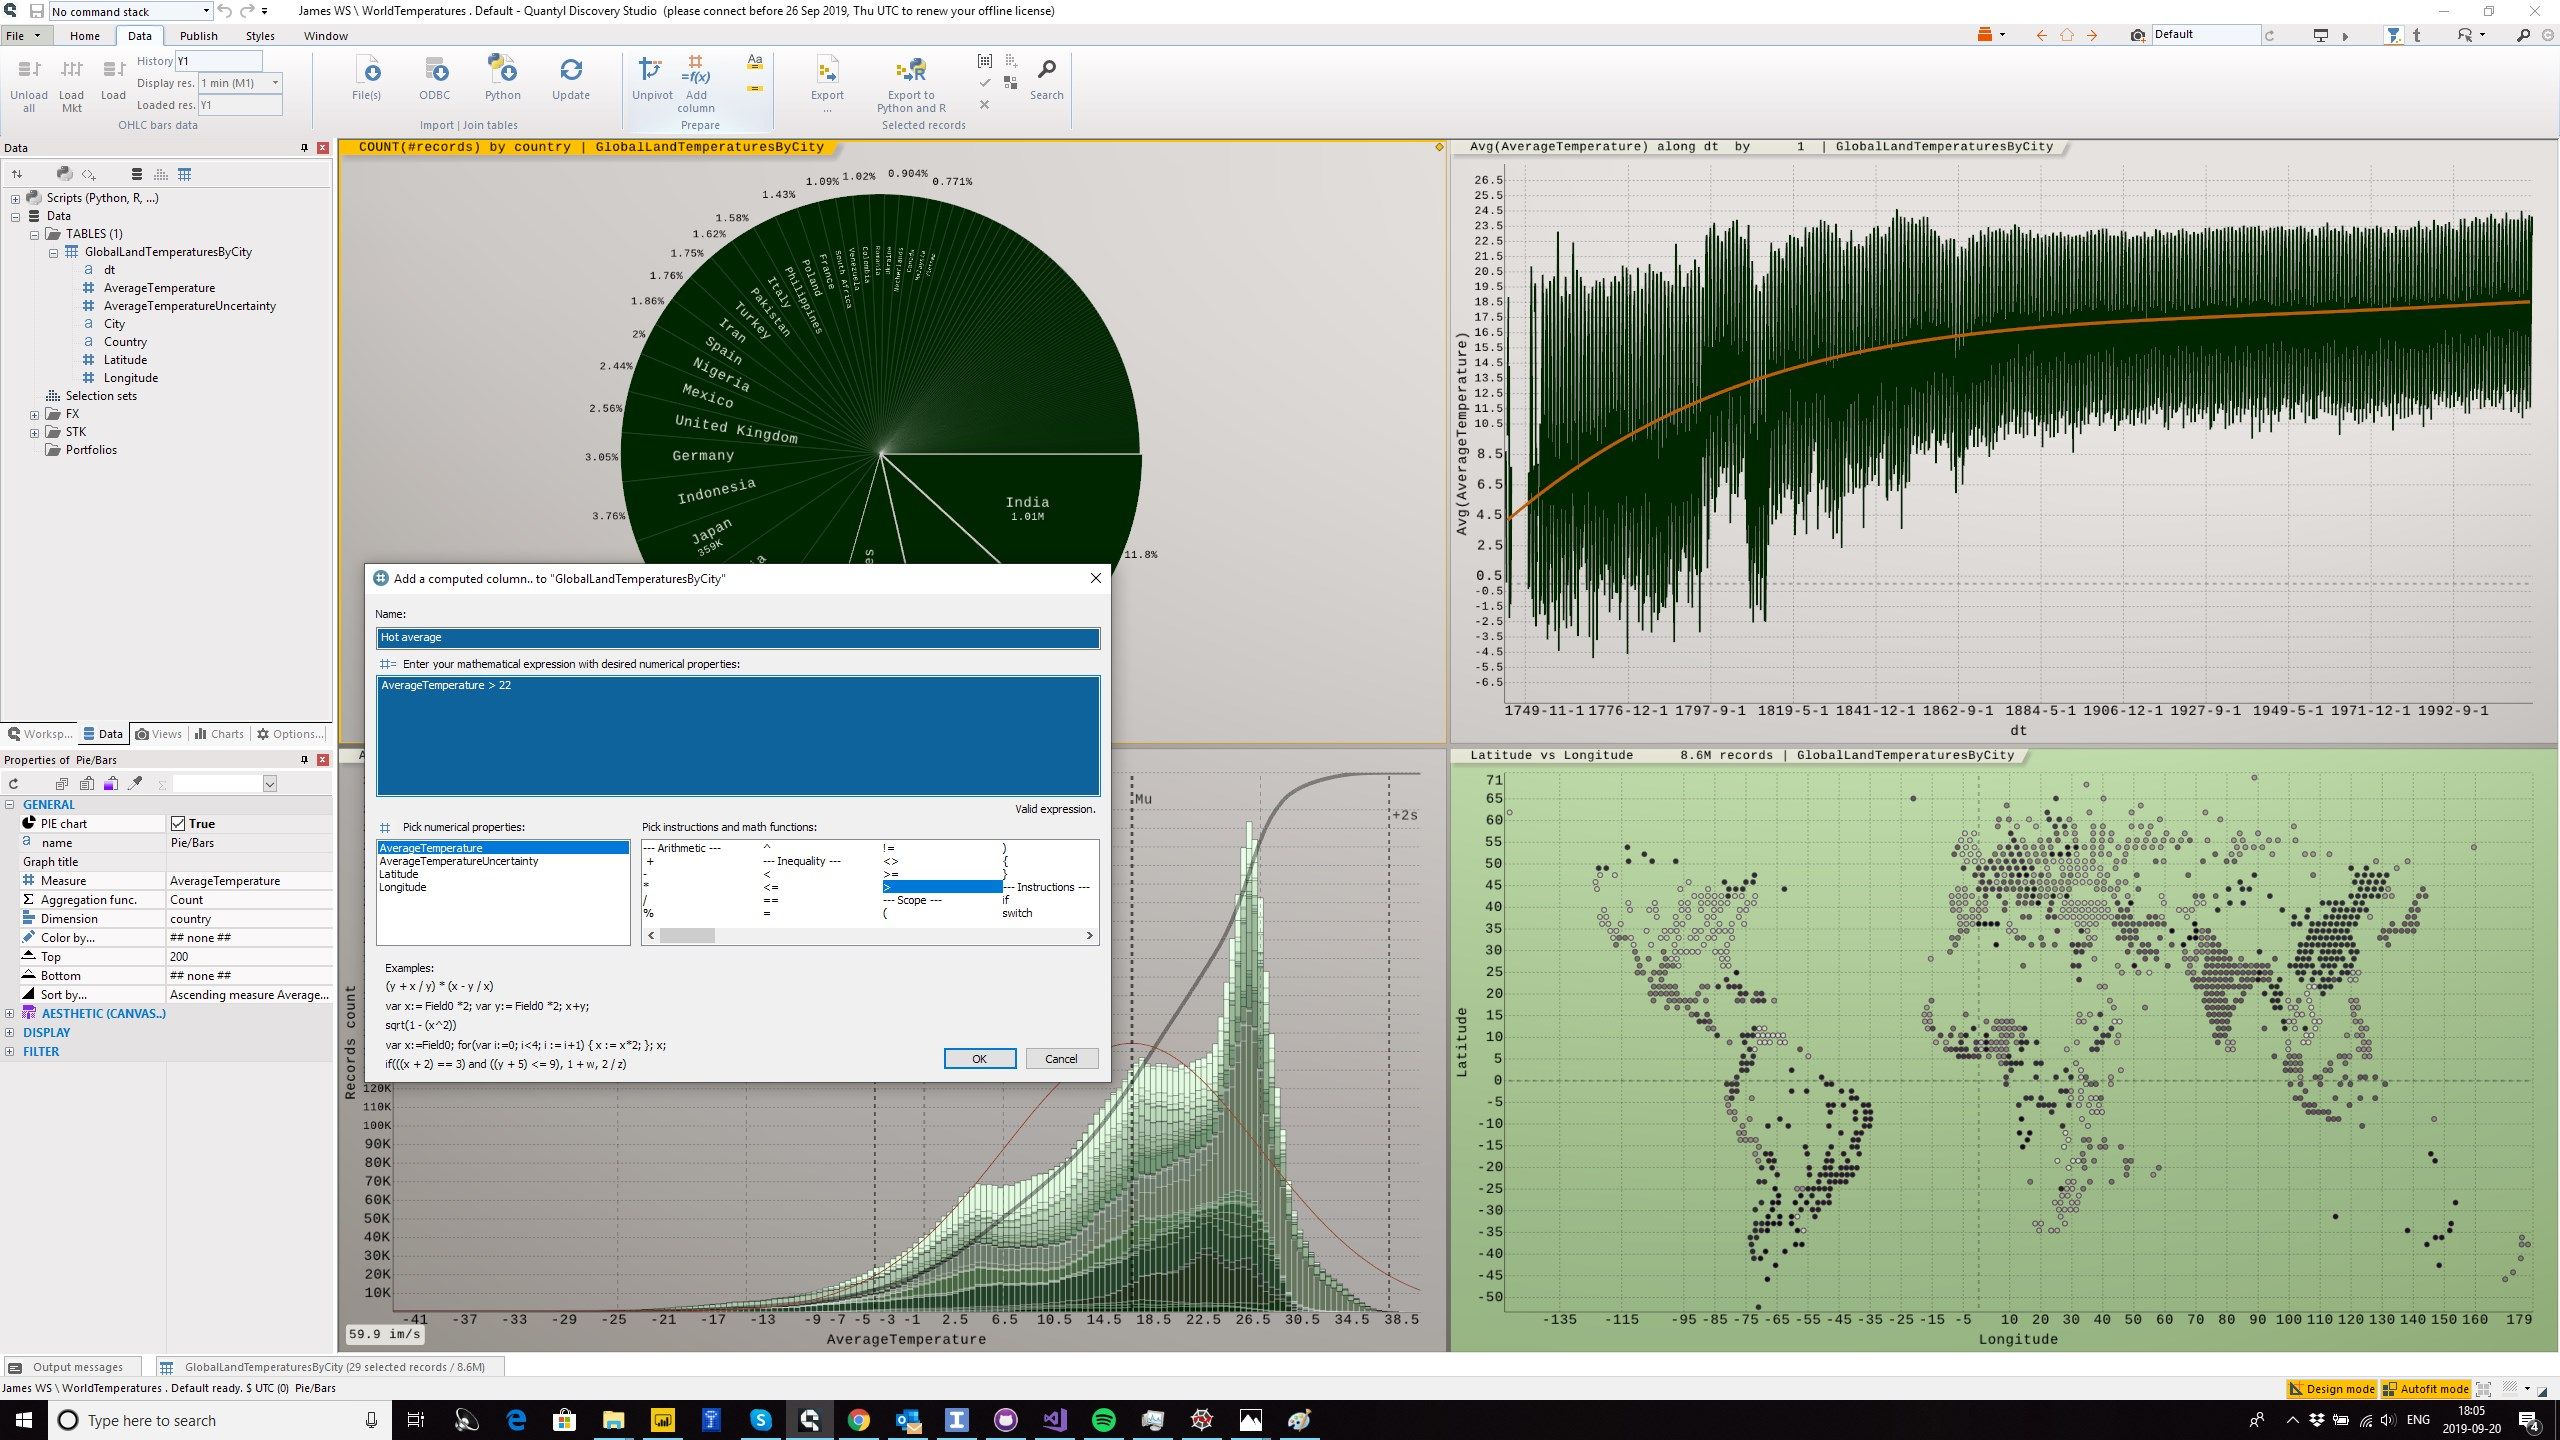
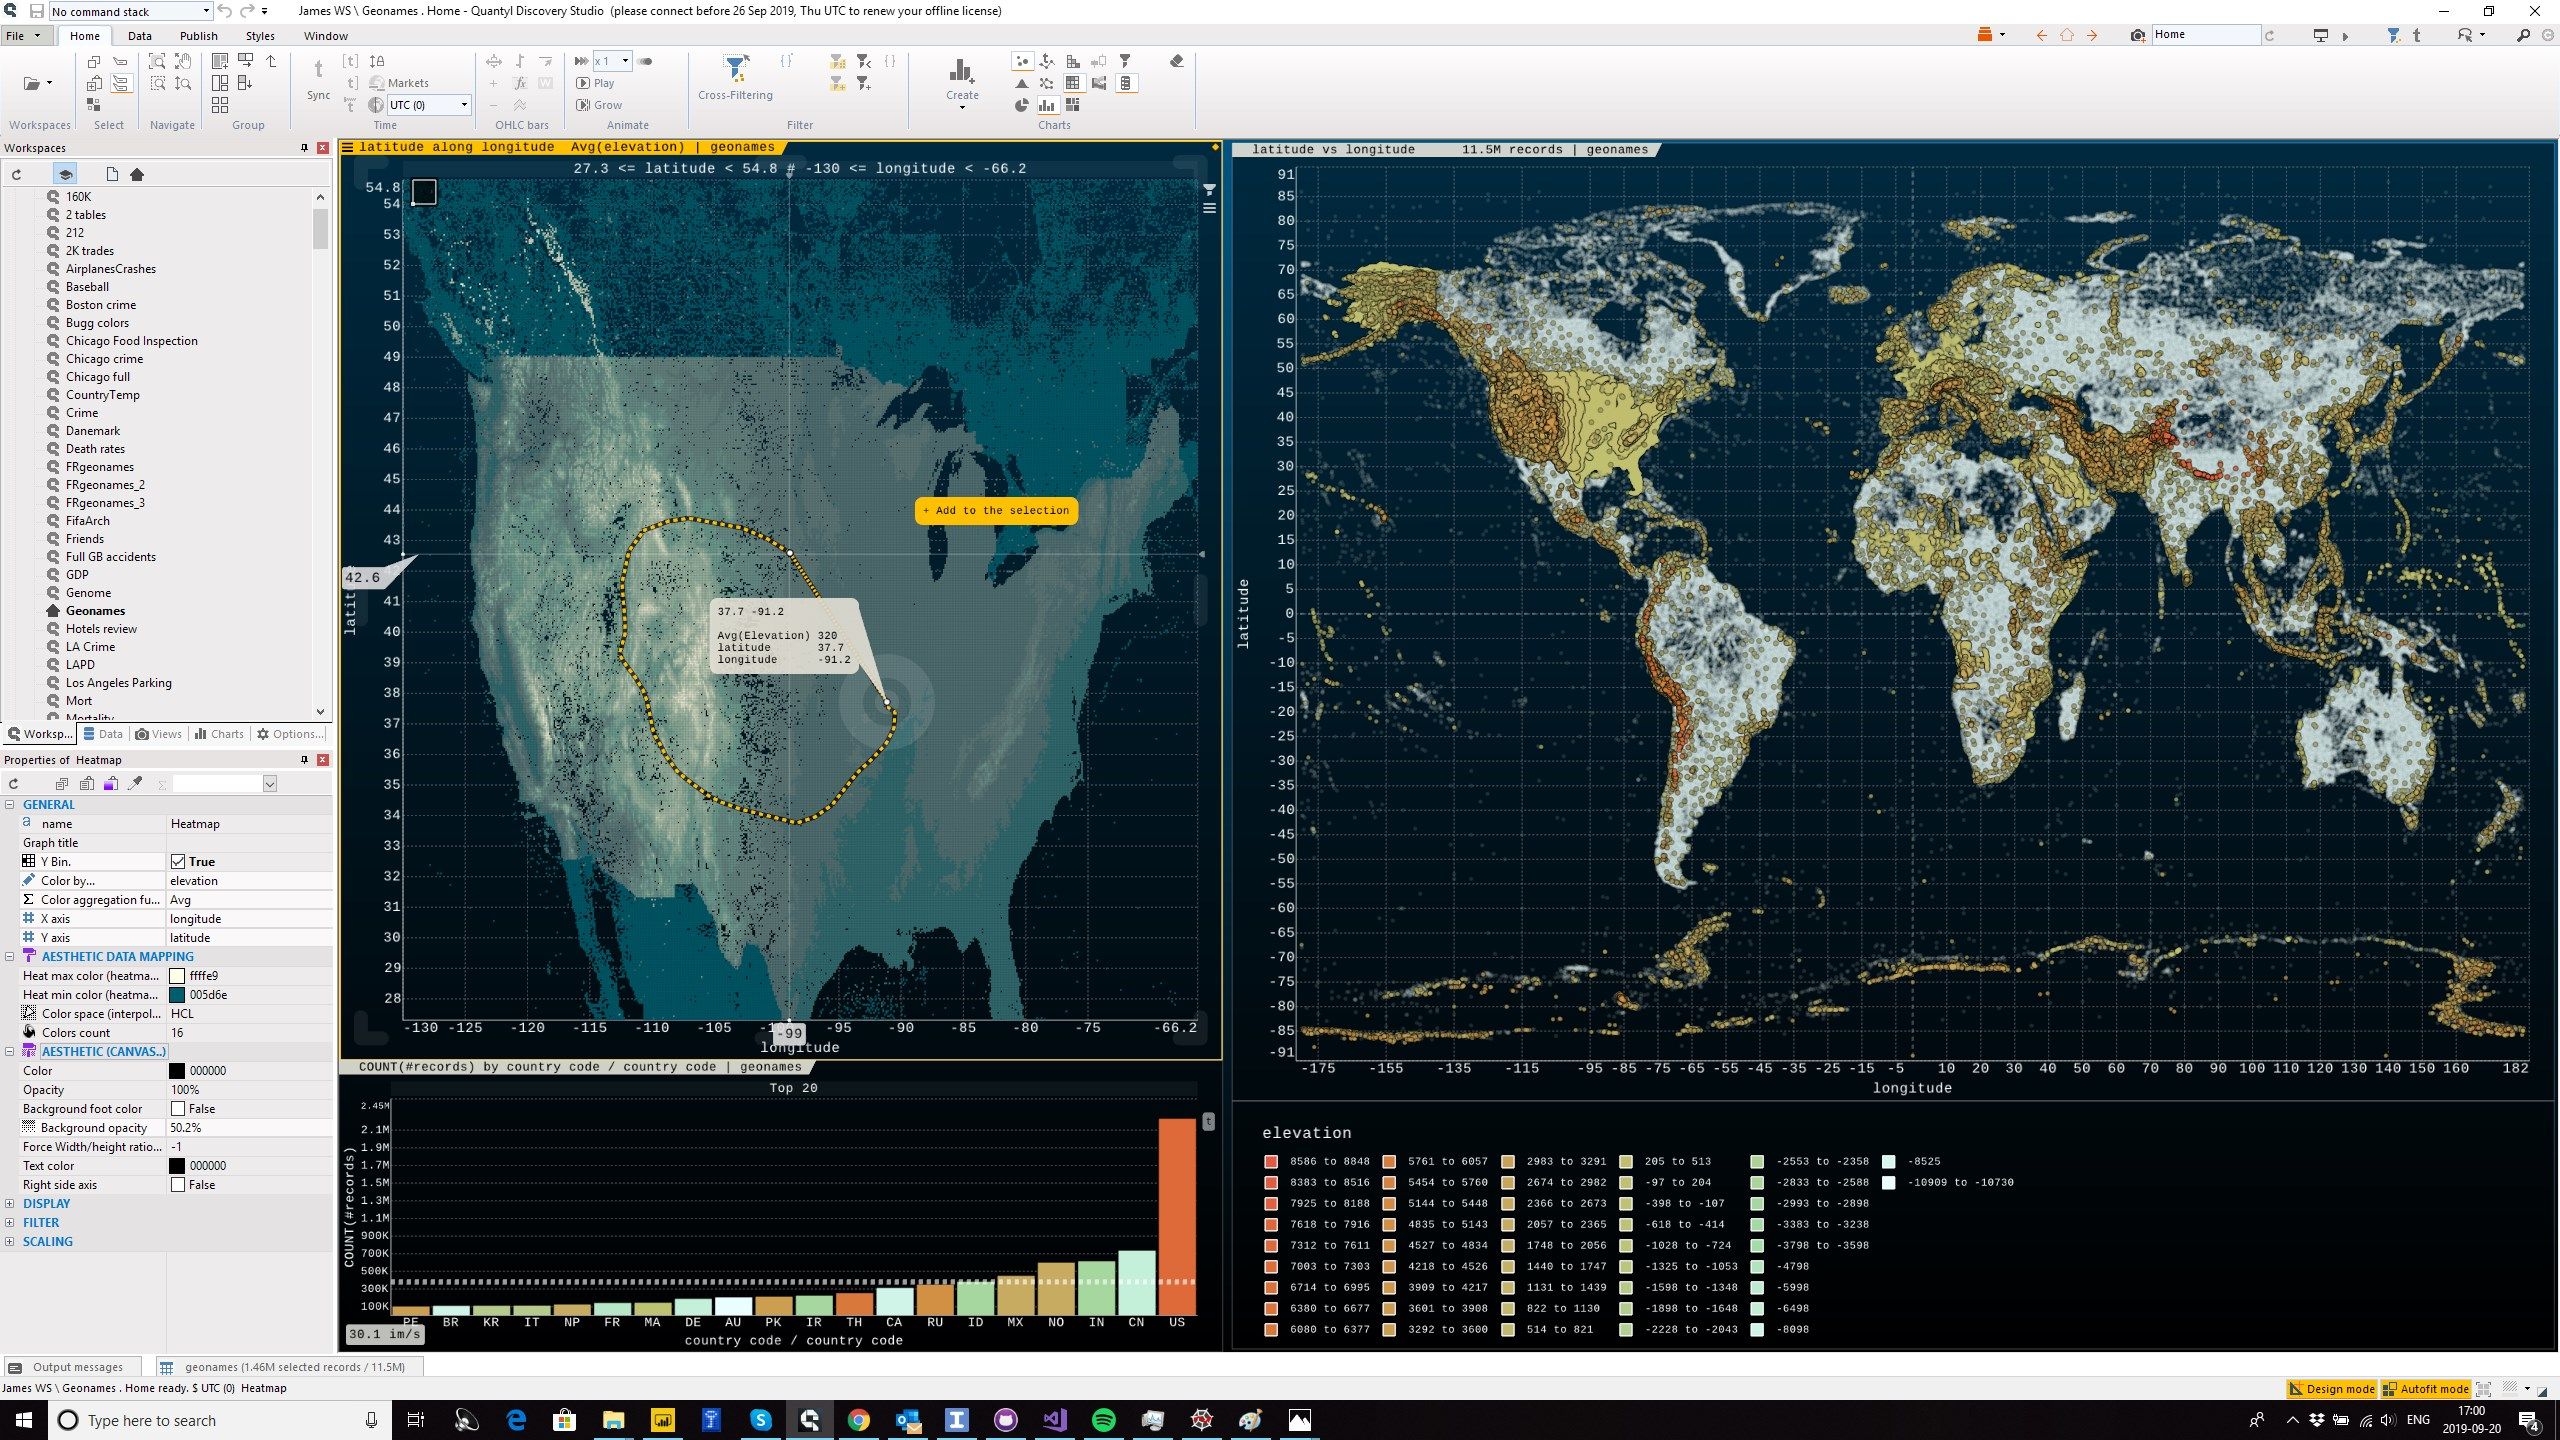
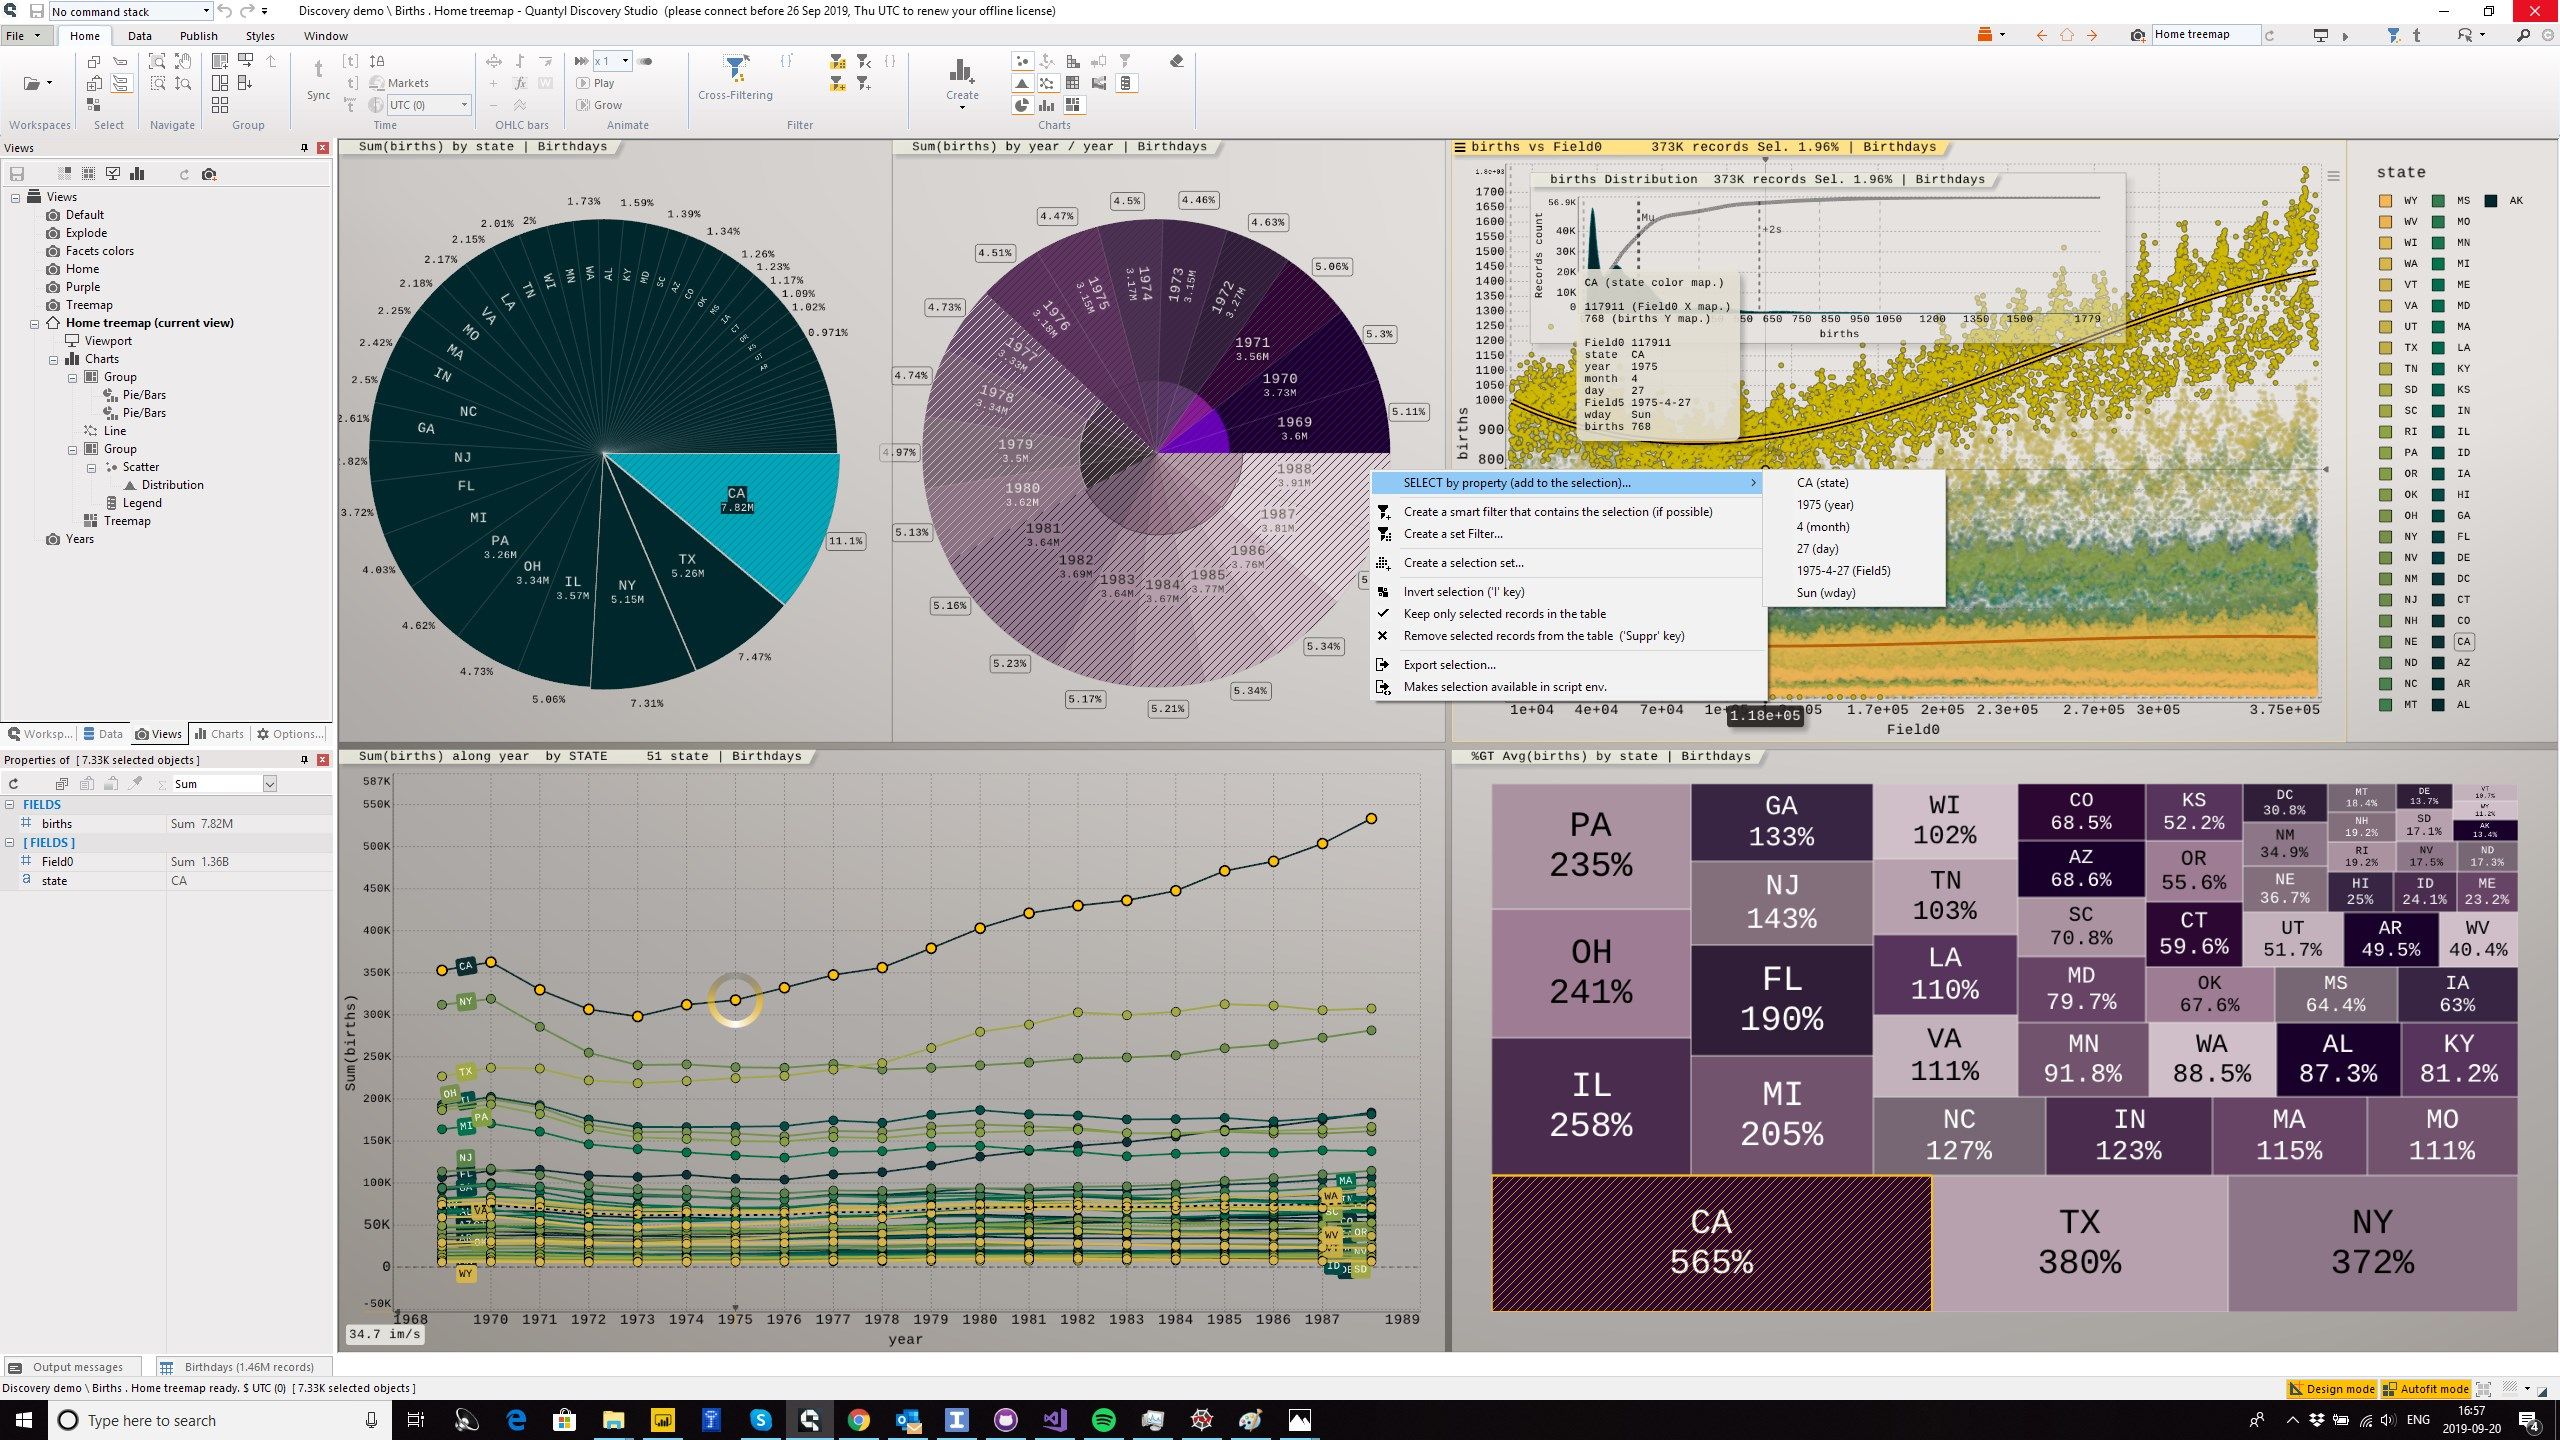
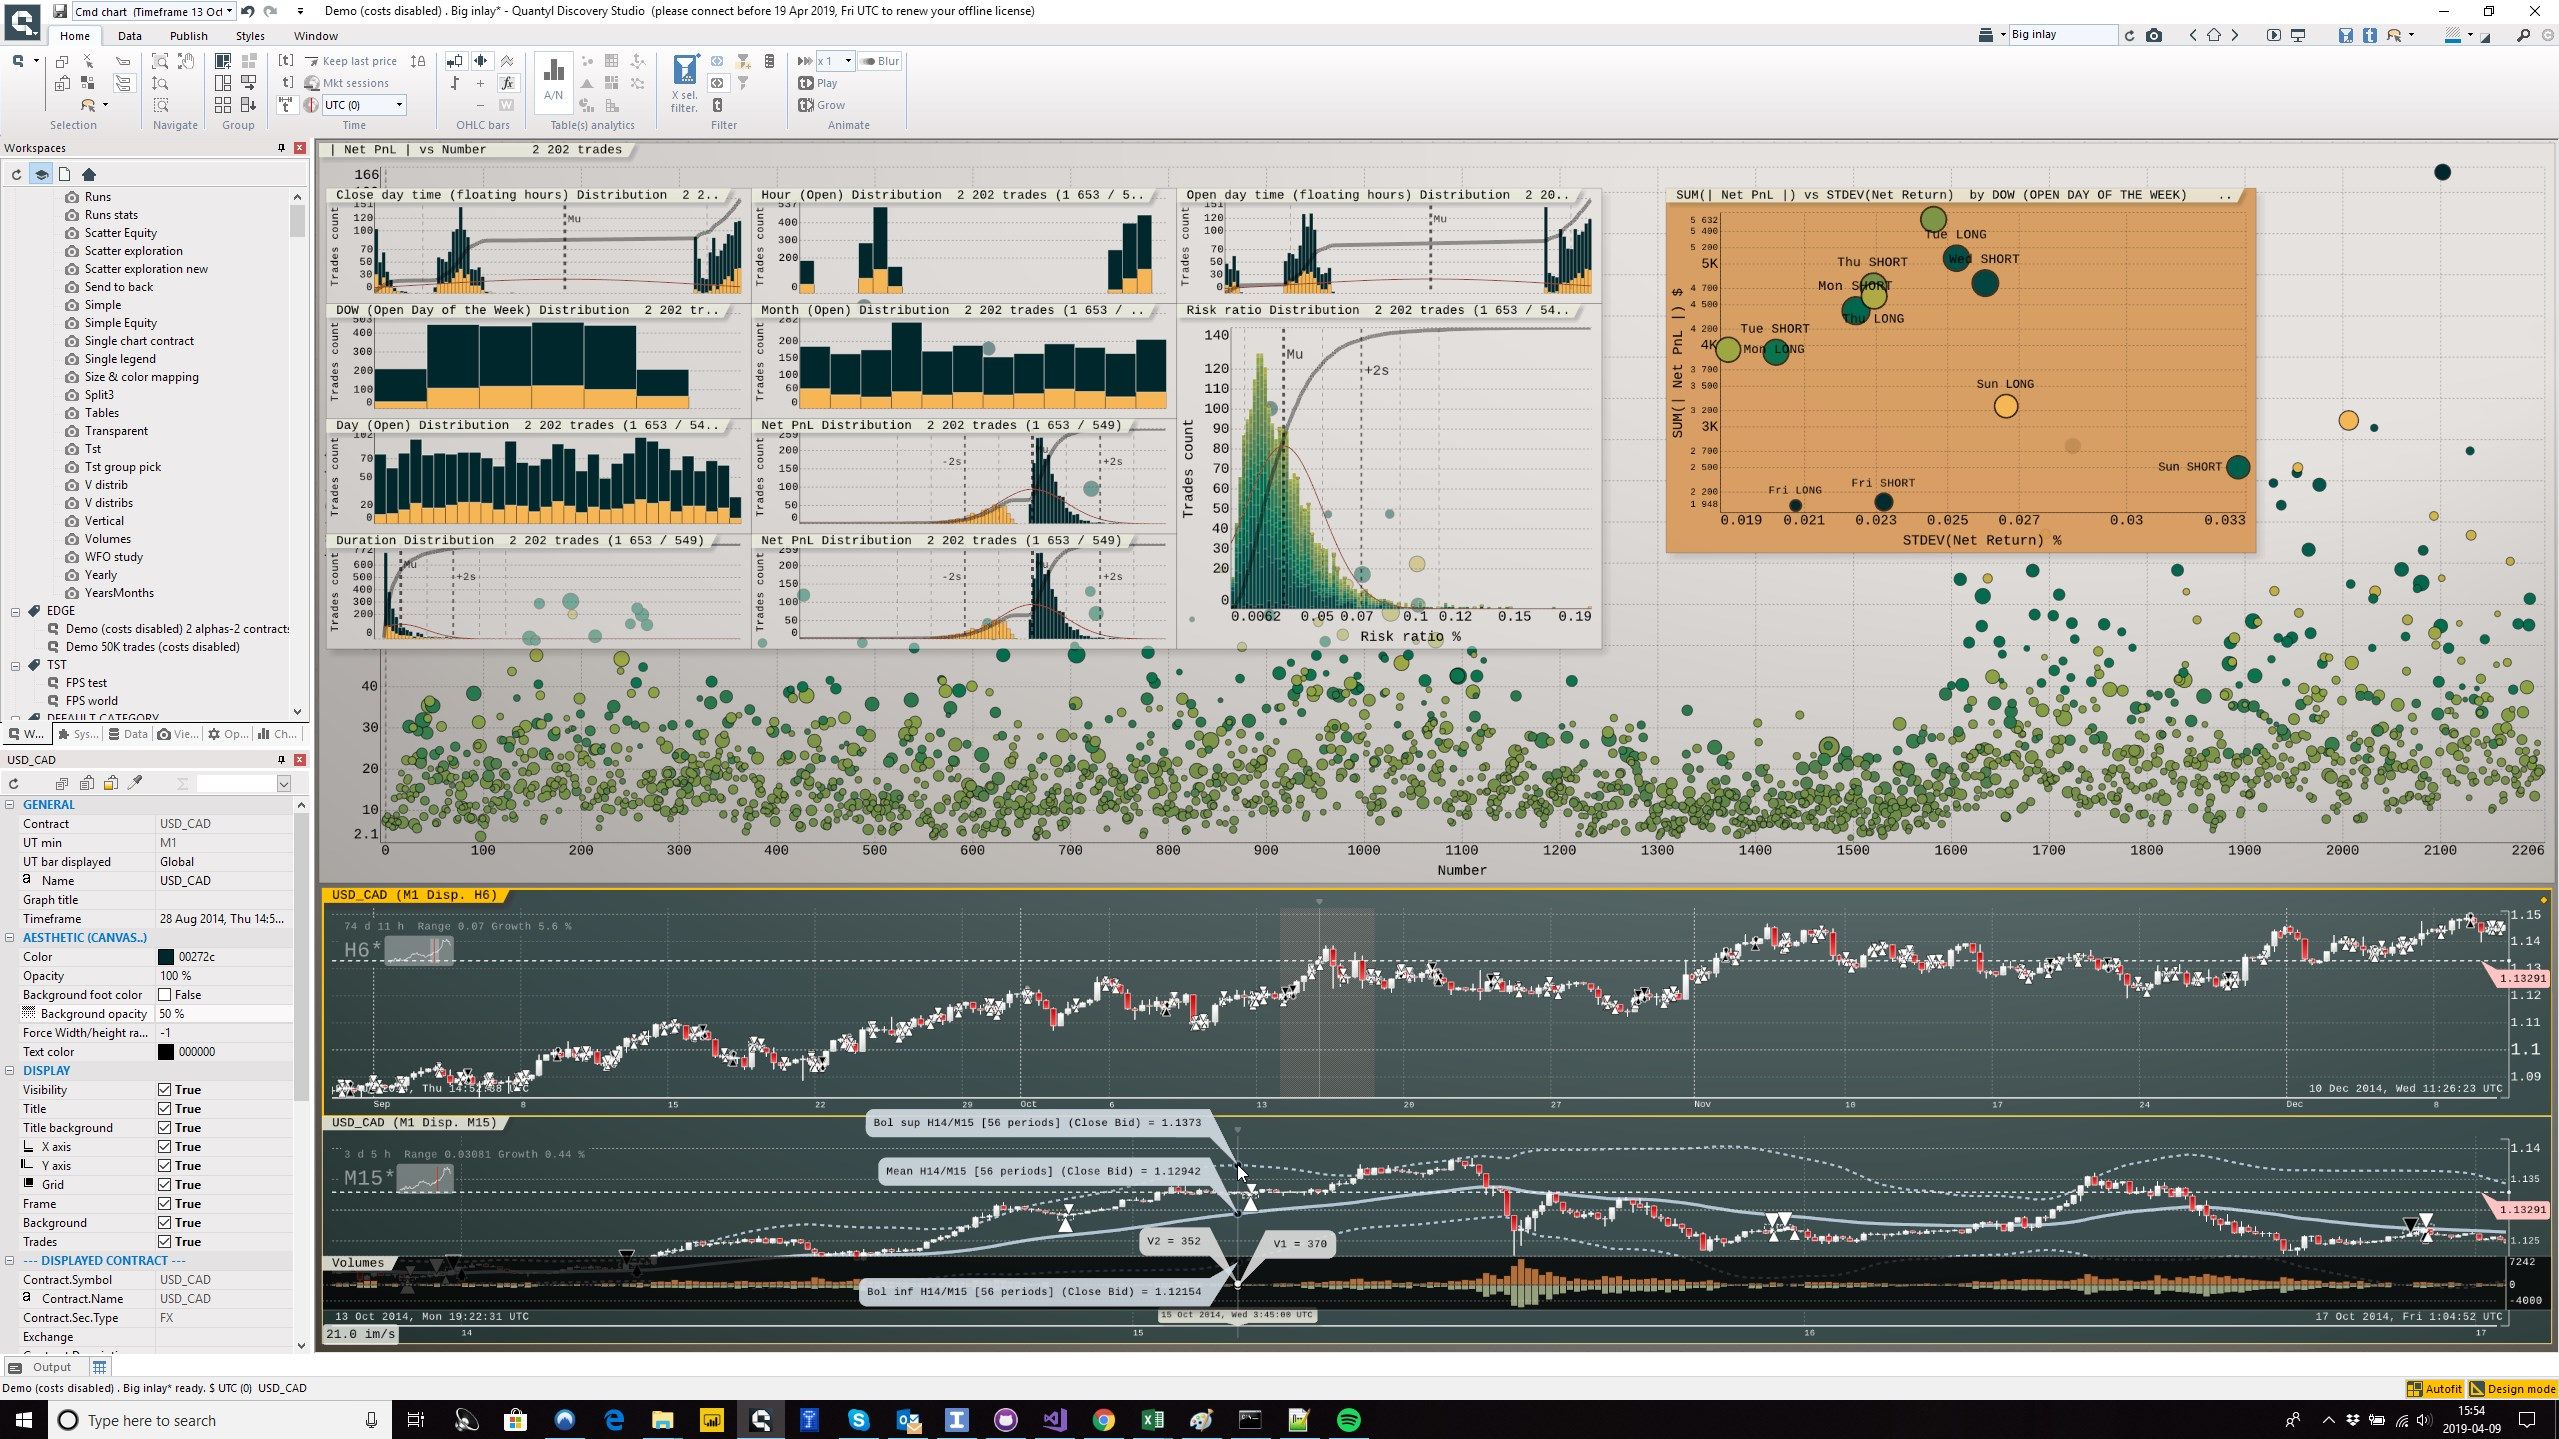
Rich chart library with thousands of properties: scatter plots, bubbles, bars, pie, lines, box, violins, heatmap, treemap, stacked histograms, timeseries, corr., sankey, time series, candle sticks etc
-
Free viewing and exploration license
-
Unlimited rows (even millions) and unlimited cores (multicore and SIMD optimized)
-
Aggregating, Data mapping, Geomapping and Selection brushing
-
Filtering, faceting, scaling and scoping
-
Advanced features: Animating any data, K-means clustering, Trend curves, Density mapping etc.
-
Multiple views creation
-
Multi touch support
-
Fast and powerful search
-
Columns adding (mathematical expressions)
-
Styling and image publishing
-
Import large data files directly (.csv, .txt etc.) or use an ODBC 64-bits database connector
-
Data update, tables join
-
Selection export to .csv
-
Include UTF8 fonts to cover more than 600 languages in graphics
-
Save your project change: charts, views and data extract
-
Your data stay with you (no upload in a cloud), works offline (license cache mechanism)
-
Use Python or R scripts to import and transform selected data
-
Interactive statistics