
Description
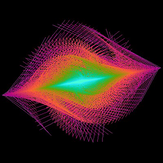
A polar graph is a math concept where the distance r from the center of the graph is determined by an equation. (r=1 would be a circle. r=sin(angle) makes loops) Polar Graph: http://en.wikipedia.org/wiki/Polar_graph Normally you start the angle from 0 and go all the way around to 360 degrees incrementing by some small amount. When you skip say every 80 degrees, you get something interesting. A Maurer Rose http://en.wikipedia.org/wiki/Maurer_rose Trigonometrics takes this maurer rose idea and puts you in control of every aspect of the design. The size, location, color palette, amount to skip, and a multiplier for the angle (to determine how many petals your maurer rose will have). Change the size and location: The first button allows you to pinch,tap, and drag to change the size/location. If you let go while pinching in, you can have the design continue to get smaller. Change the rainbow: There are basically 2 rainbow palettes. One cycles through all the colors in their proper rainbow order. The other will randomly meander from color to color. Continually pressing this button will give you different rainbow options. Control the angle: Press this button and pinching,tapping and dragging will modify the angle skip parameter. Control the wave: This button, with pinching, tapping, and dragging will allow you to change the number of petals your rose has. Bomb Button: This will clear the screen but keep all your properties. Press the Menu button to save your image.
-
Create beautiful mathematical designs
-
Change size, location, patterns, and rainbow style with simple pinch, tap, and slide controls.
-
Save your creations to your device