

Description
Visualizations is the application that scientists, hobbyists, teachers and students need to quickly visualize mathematical functions or statistical data. The application is lightweight and powerful. You can easily:
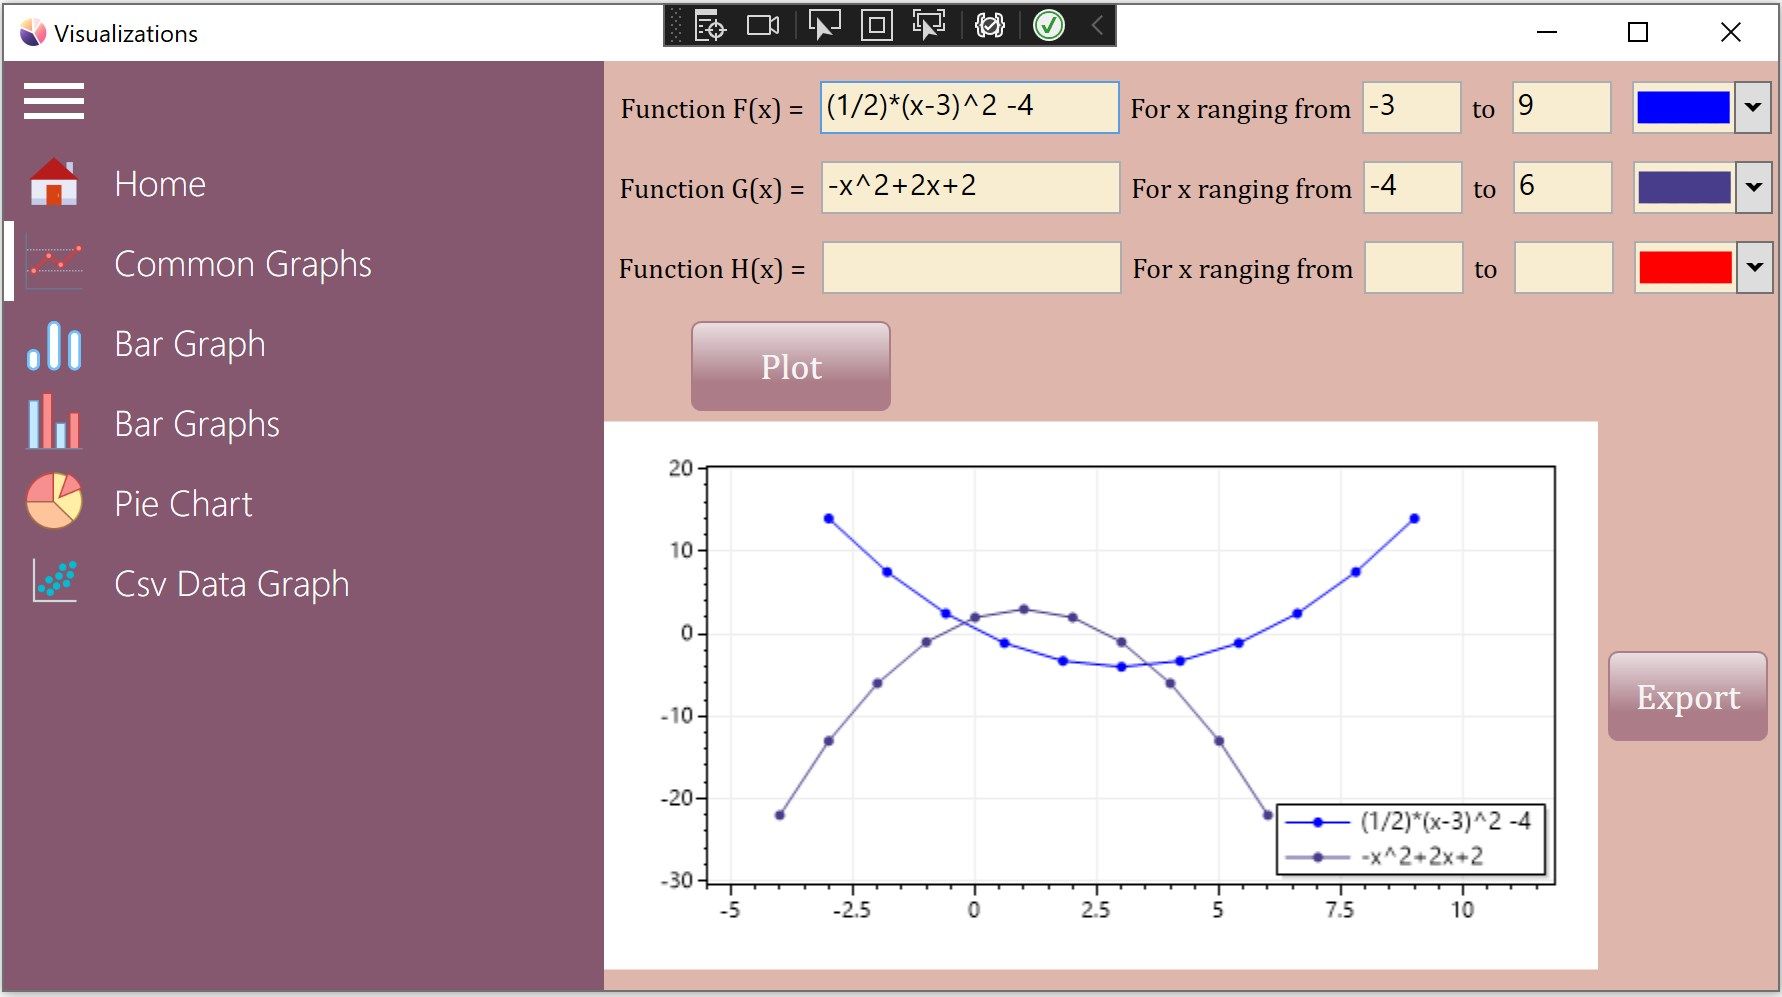
-Plot the graphs of common mathematical functions such as linear,
quadratic, cubic, trigonometric functions…
*You just type in the function, select a range of values and click plot. It is as simple as that!
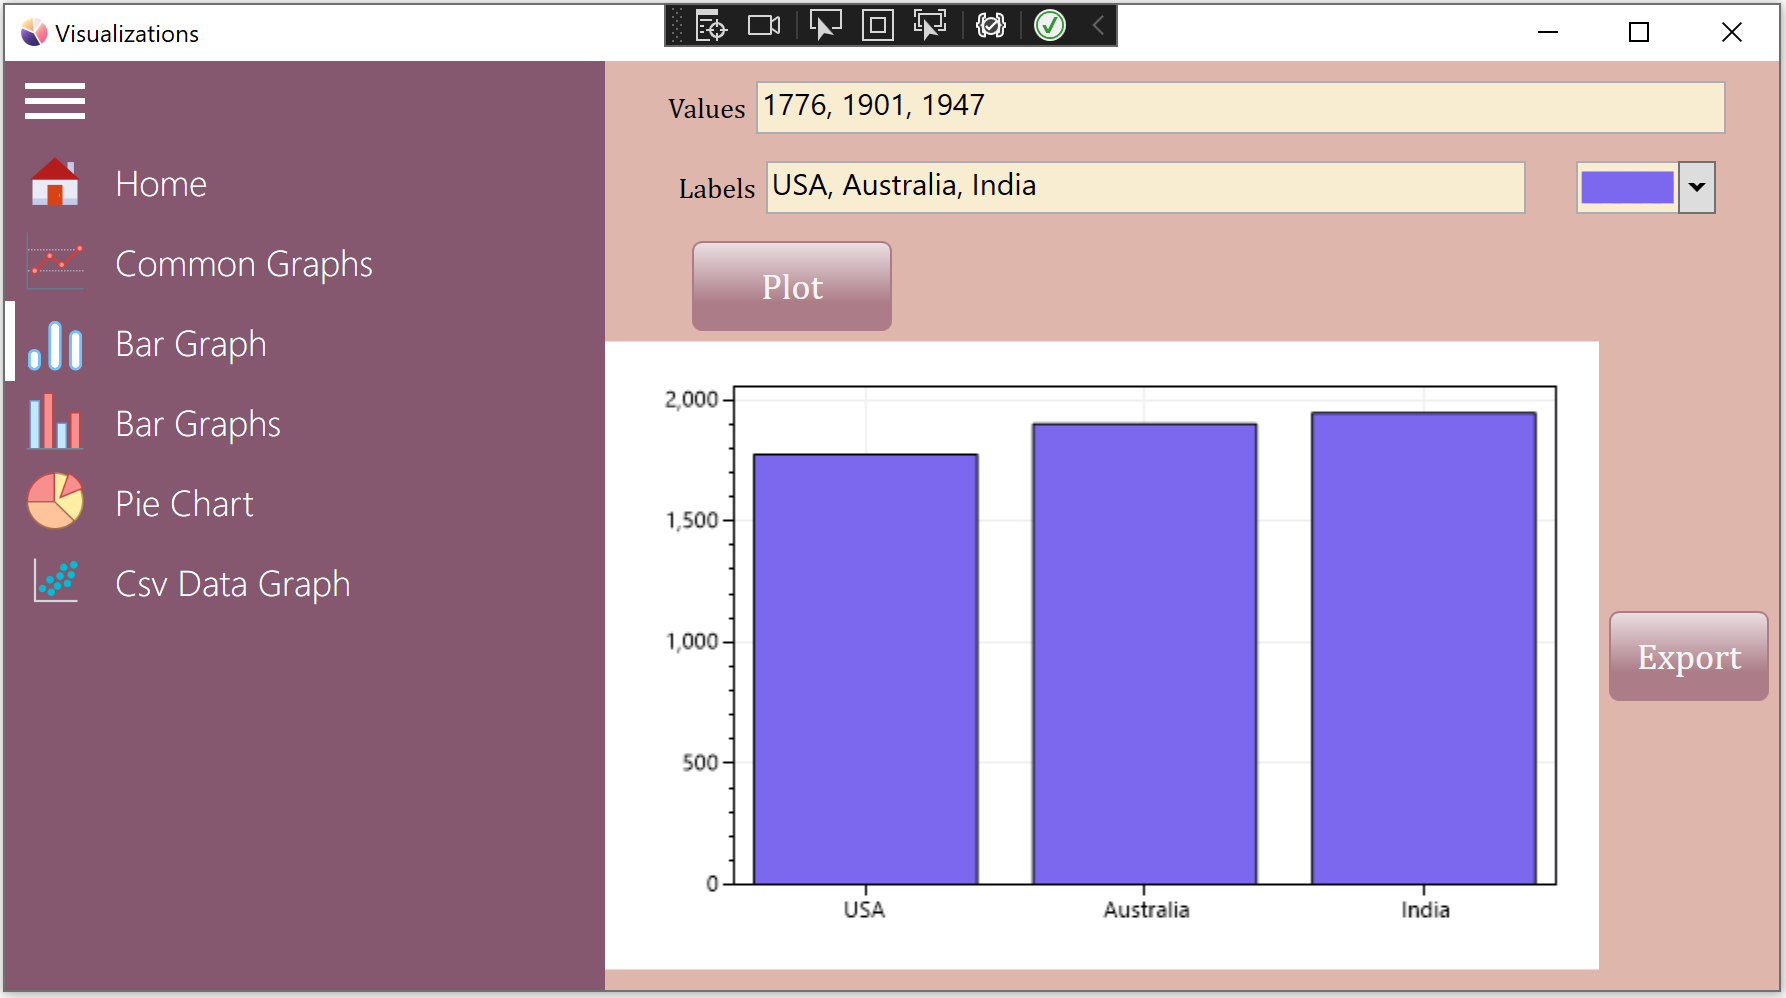
-Plot multiple bar graphs to visually compare some data
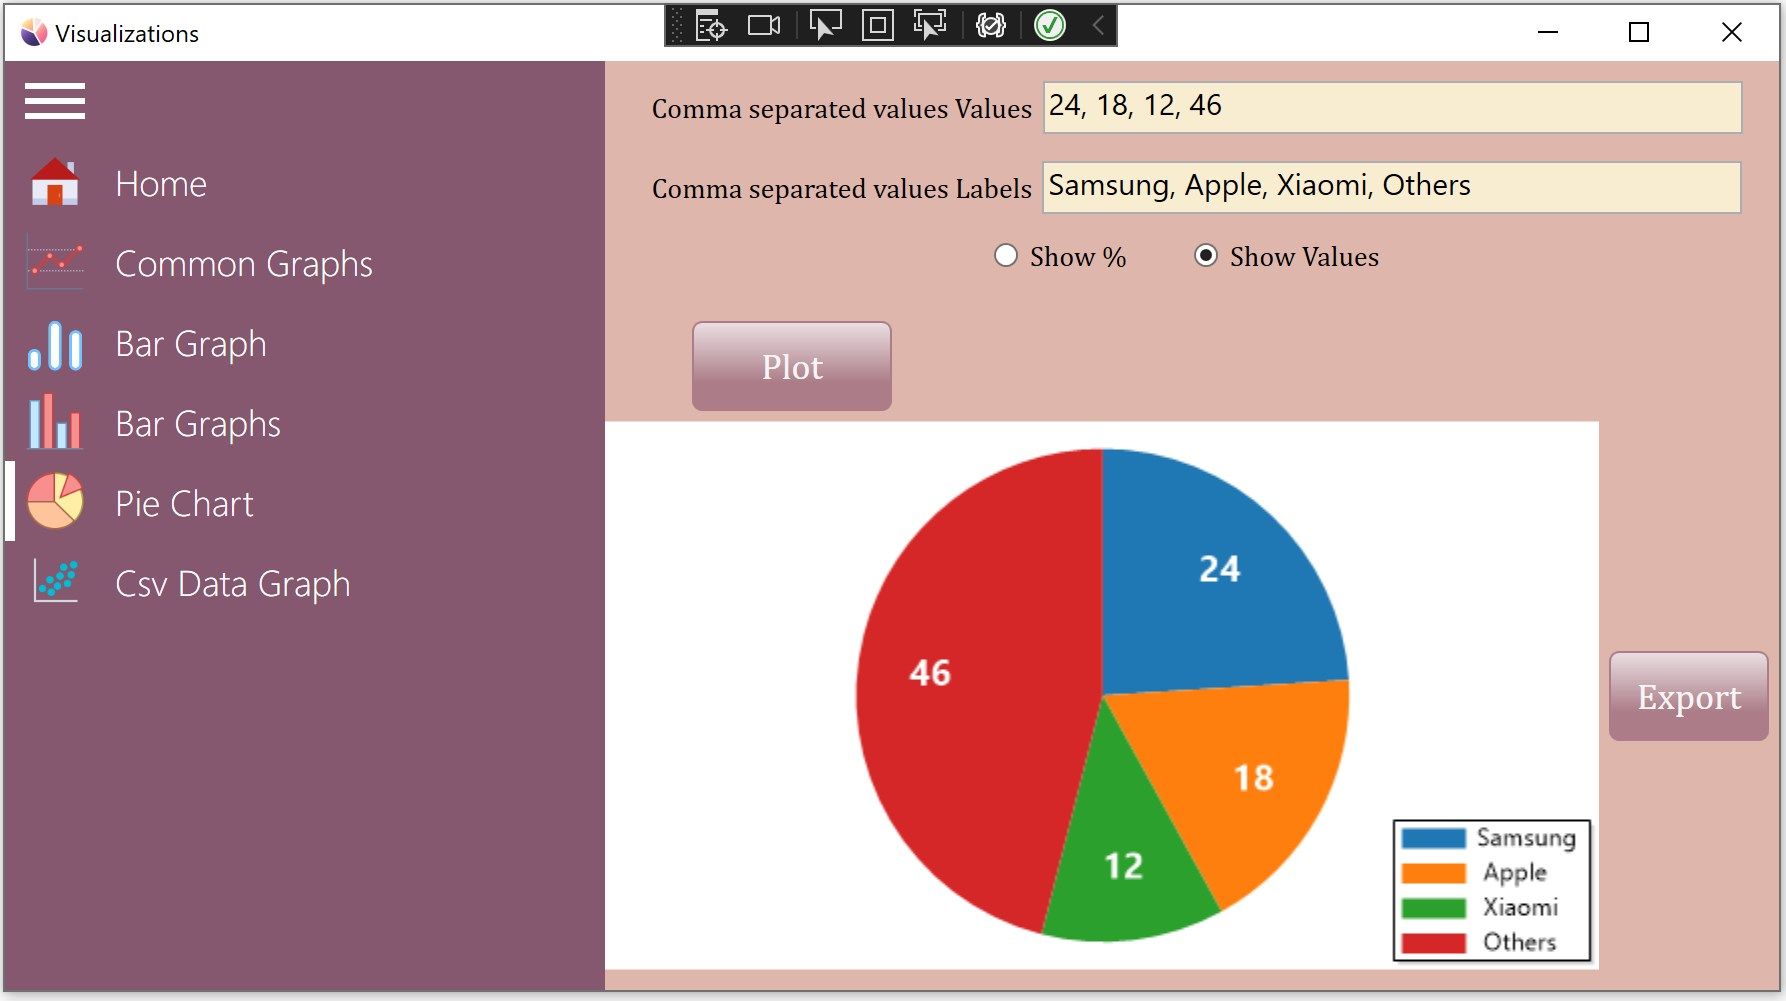
-Plot Pie Charts
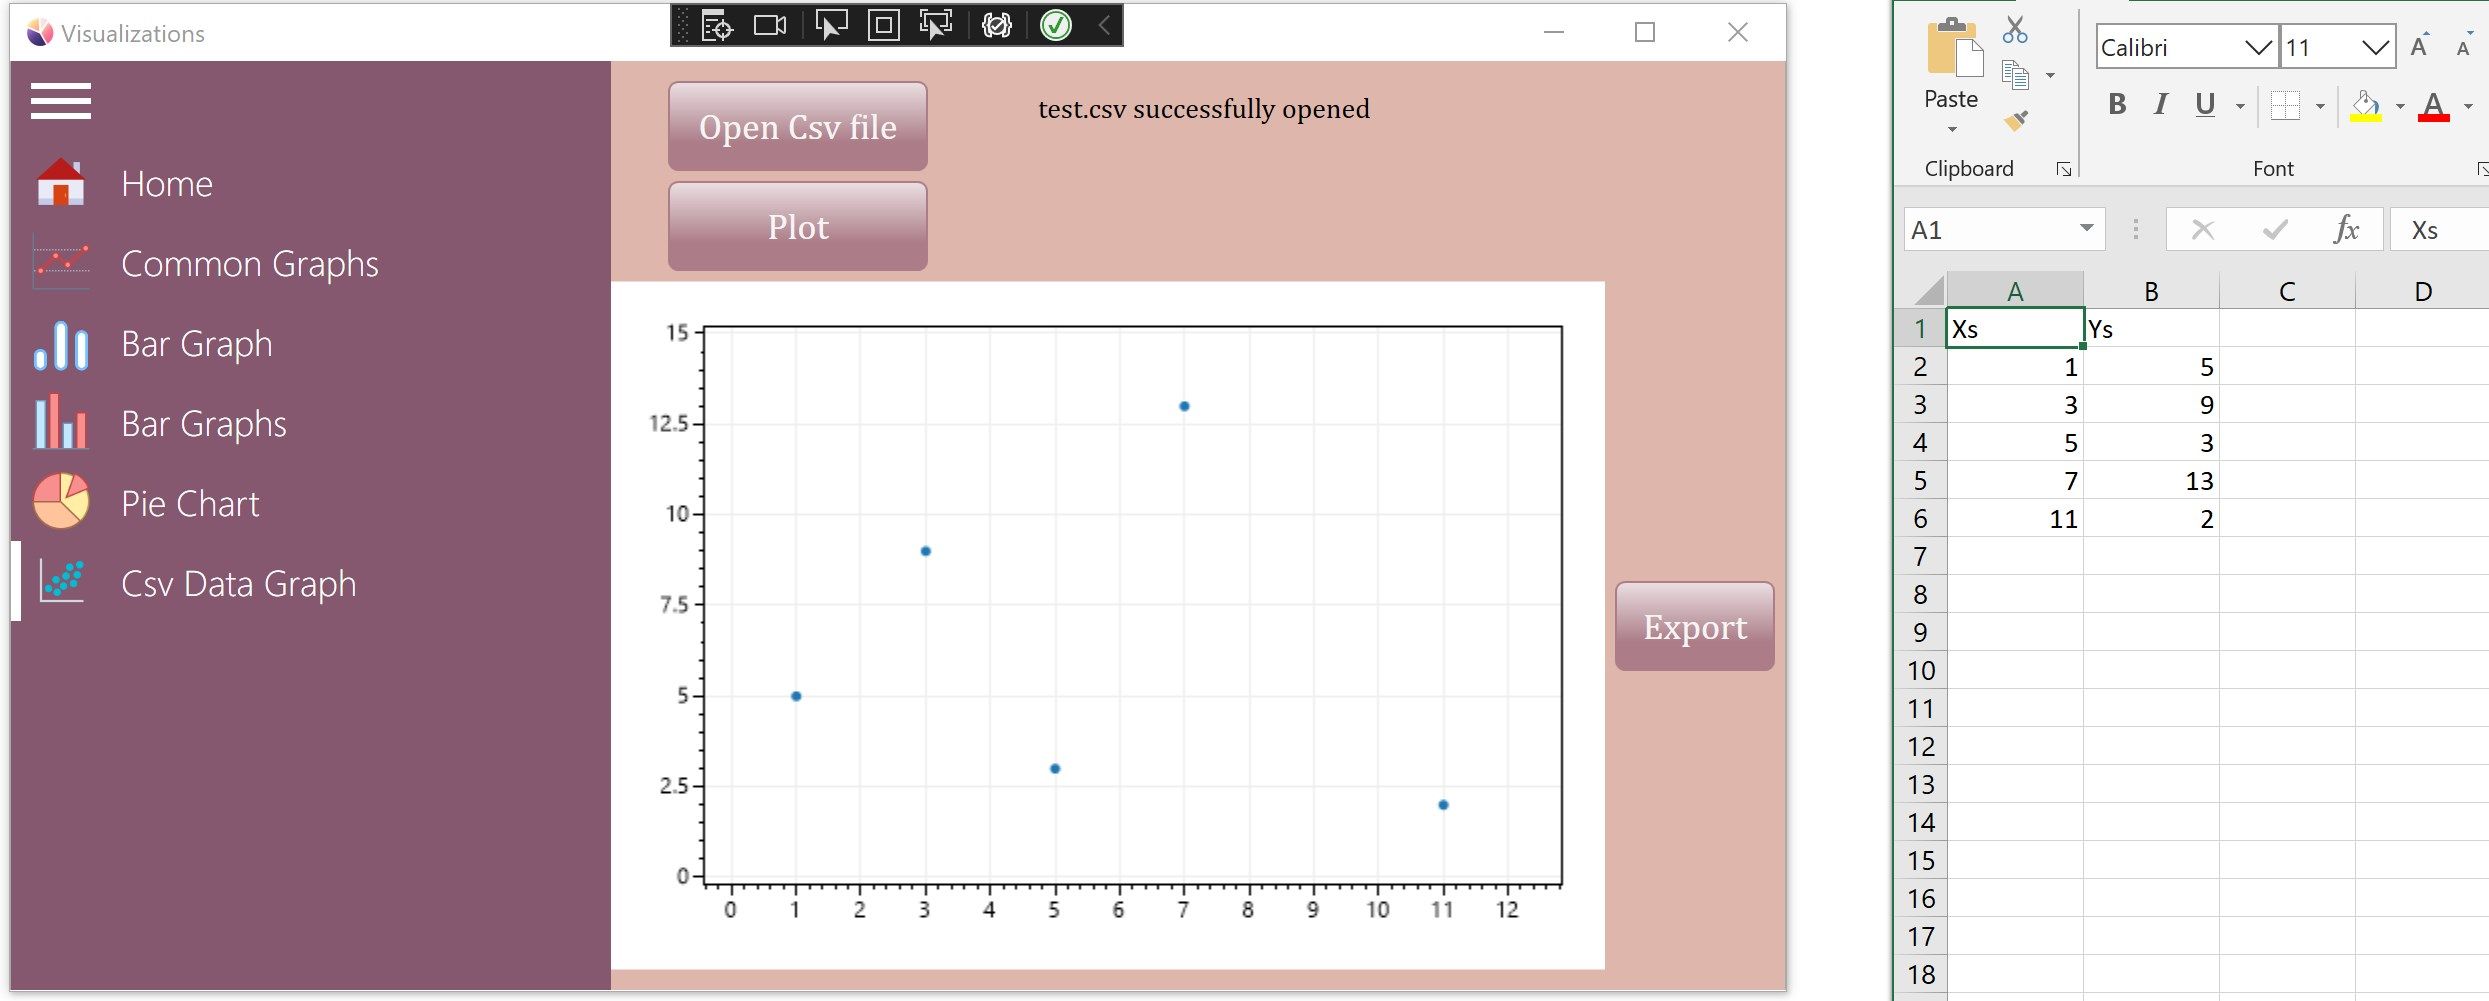
-Import CSV files and plot the data
More importantly, you can save the plotted graph as a high resolution image file
in order to use it later in other applications.
In order to ease the use of the application, a concise user manual is included.
It explains the simplest steps to plotting graphs.
-
Ease of Use
-
Plot any function
-
Bar graphs
-
Pie Charts
-
Save graphs as images