

Description
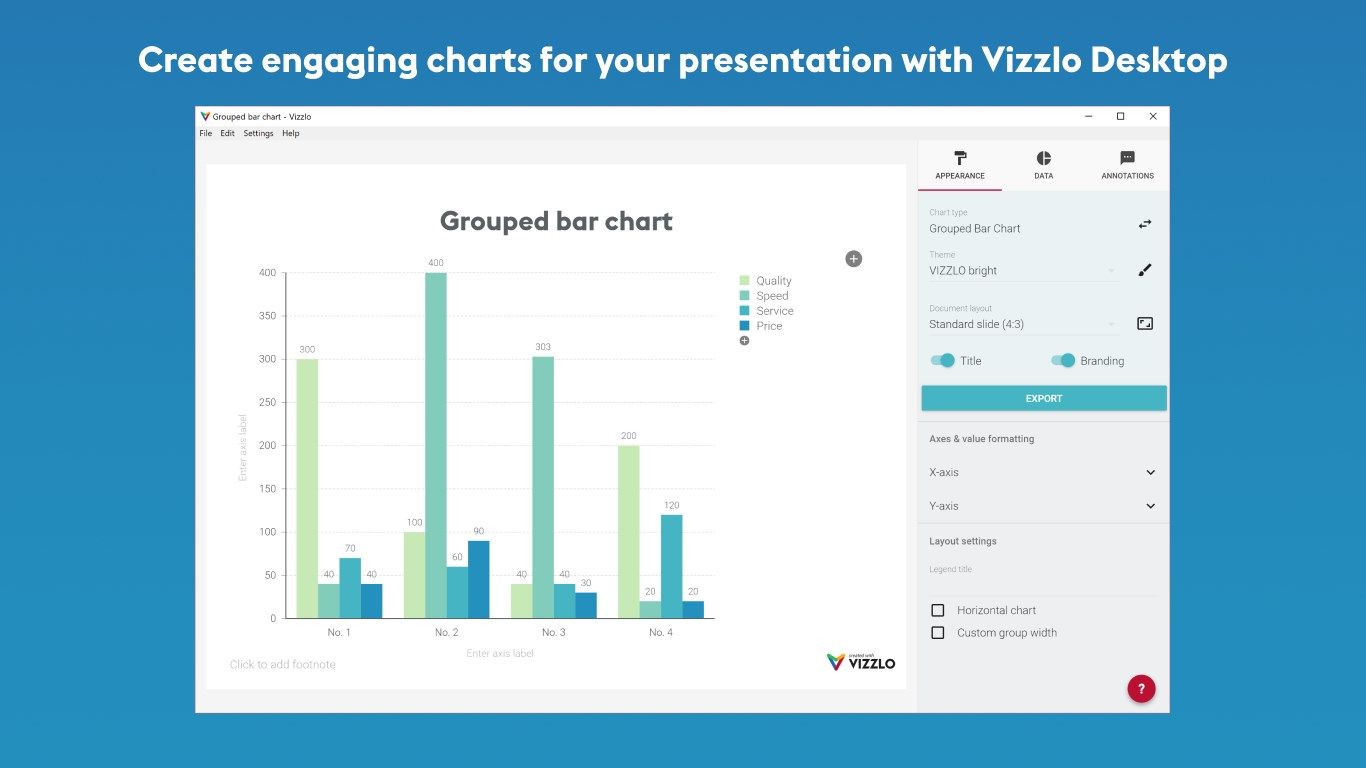
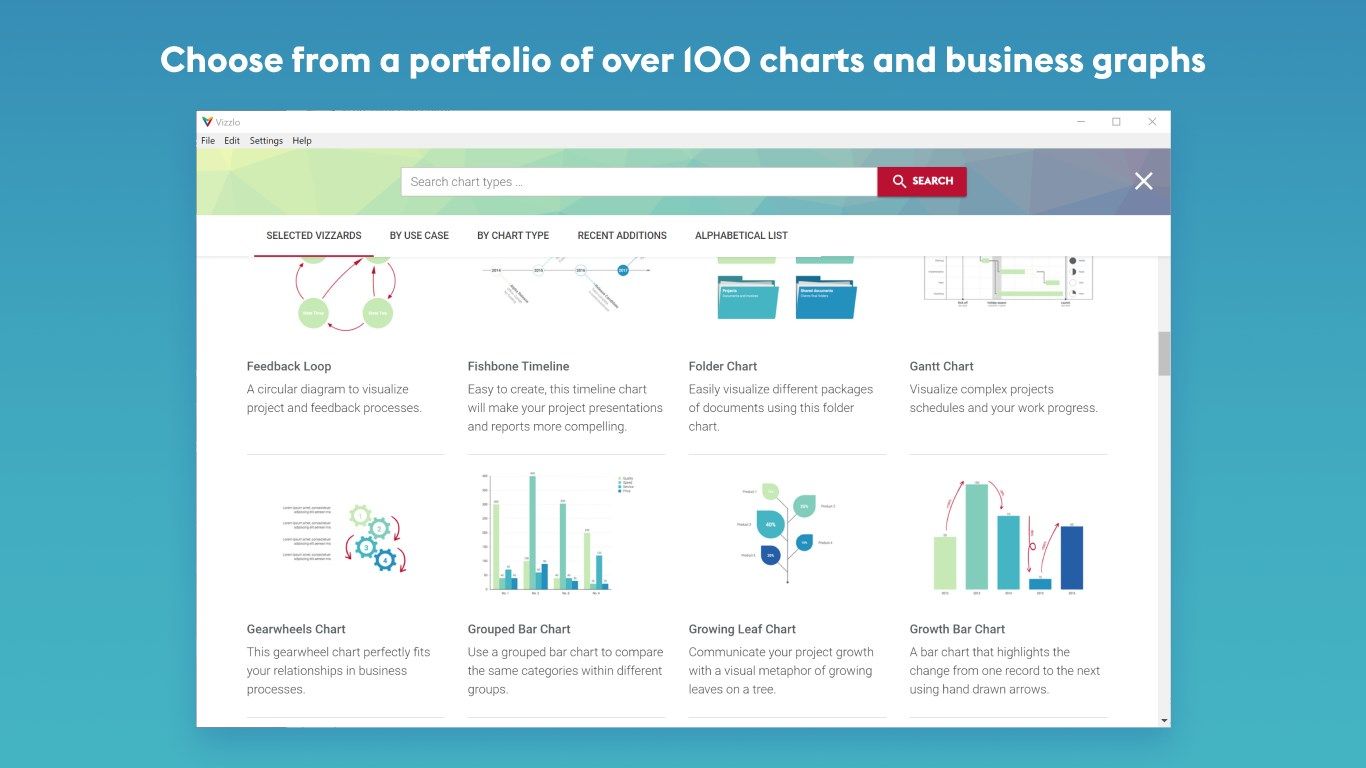
The Vizzlo Desktop app offers a portfolio of beautiful and engaging charts and business graphics for your presentation. Incorporating the application into your workflow is easy, thanks to a growing number of integrations and a fully functional offline mode. Vizzlo is also available as a web-based tool for maximum flexibility.
Use Vizzlo to:
- Create different types of charts and business graphics, including: timelines, Gantt charts, bar, and circular graphs, and much more.
- Customize your visualizations to match your brand identity
- Save time while preparing visual aids for presentations and reports
- Collaborate with teammates
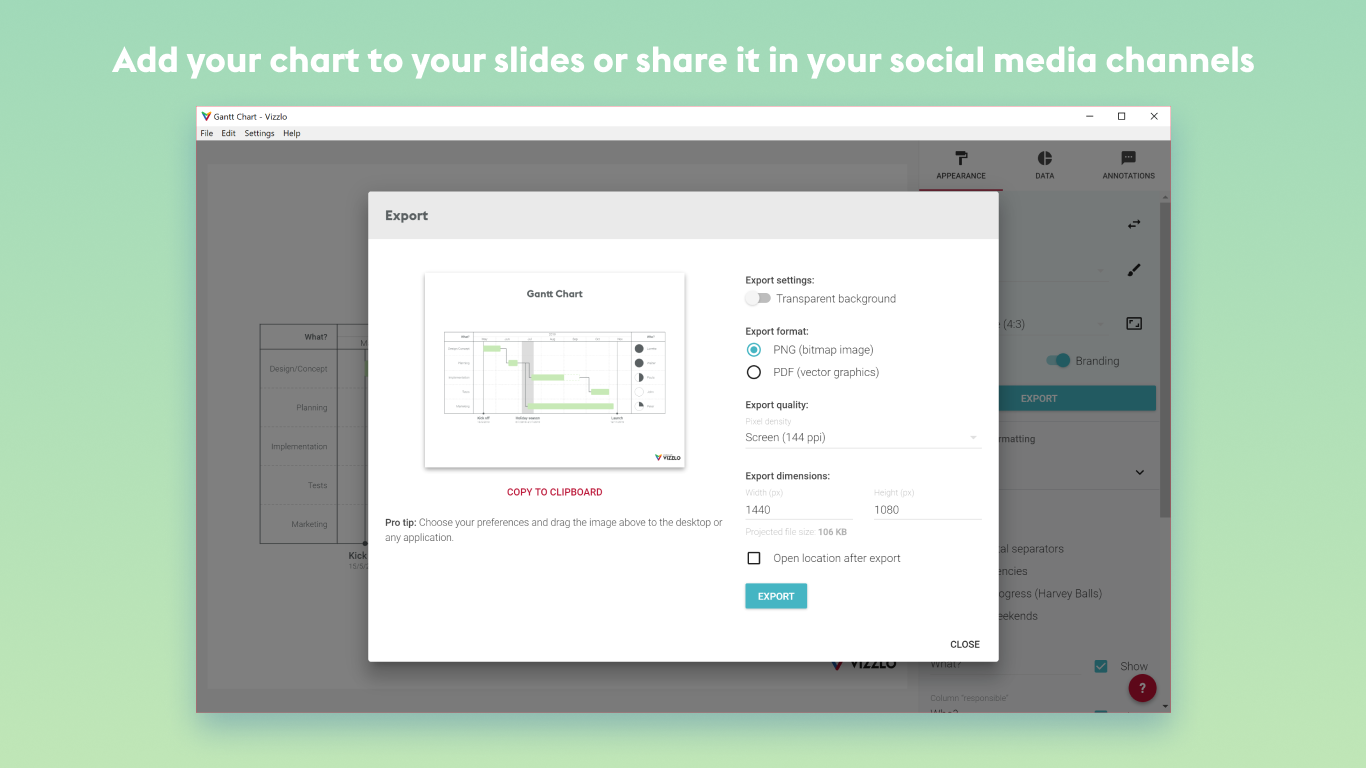
- Integrate into your workflow and tools you already use, including PowerPoint and Google Slides.
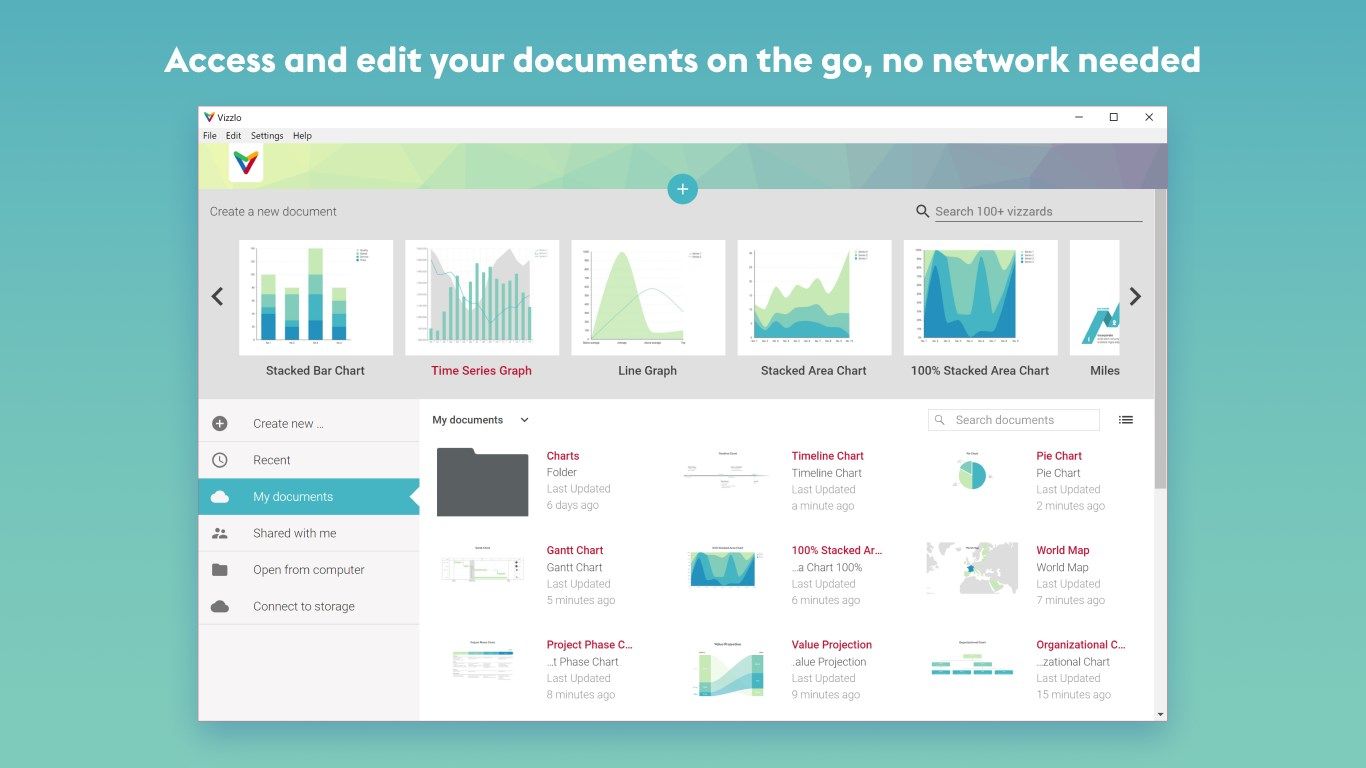
- Work offline in a native desktop environment
Designer-grade quality:
- No designer-skills needed, all charts and graphics have been professionally designed to deliver precise and beautiful results
- Create themes to keep all your visualizations consistent
- Export high-quality PNGs and, as a premium user, vectors PDF.
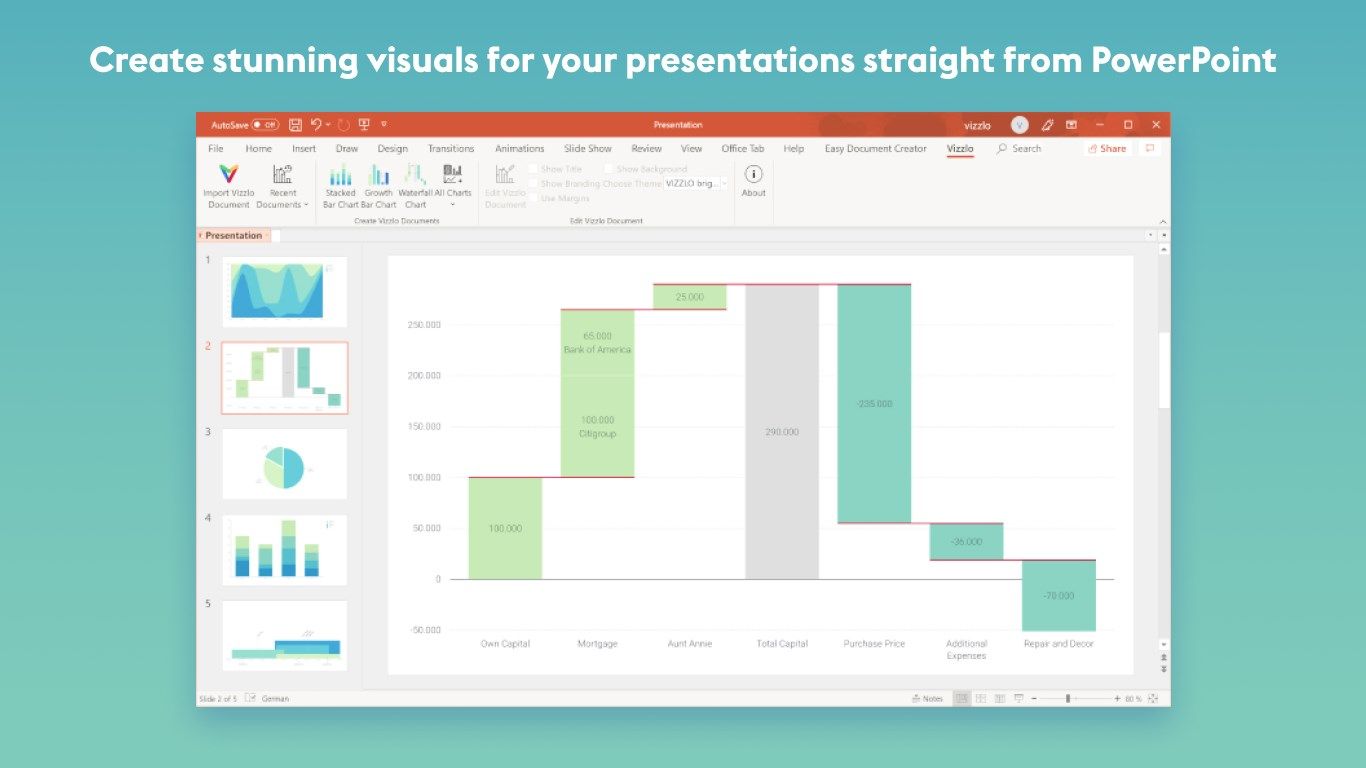
PowerPoint add-in:
Install the Vizzlo PowerPoint add-in along the app to work on your visualizations straight from PowerPoint. Get it for free—just click on the button in the bottom-left corner of the app’s dashboard to add the power of Vizzlo to your PowerPoint ribbon.
Choose from Vizzlo’s versatile portfolio and start creating captivating charts with the free version. Upgrade to Pro to export your charts in high-quality without the watermark and add your own branding.
Get the app, start visualizing, present and impress!
-
Create, open and update local and cloud documents
-
100+ charts, tailored for different use-cases, e.g., project management, finance and economics, sales and marketing, etc.
-
Corresponding web app
-
A growing list of integrations
-
Collaboration with shared folders and documents
-
Easy data import (CSV and XLSX)