
Brainf*ck#
App details
About Brainf*ck#
Brainfck# is the world’s most advanced console/IDE and debugger for the Brainfck programming language, exclusively on Windows 10.
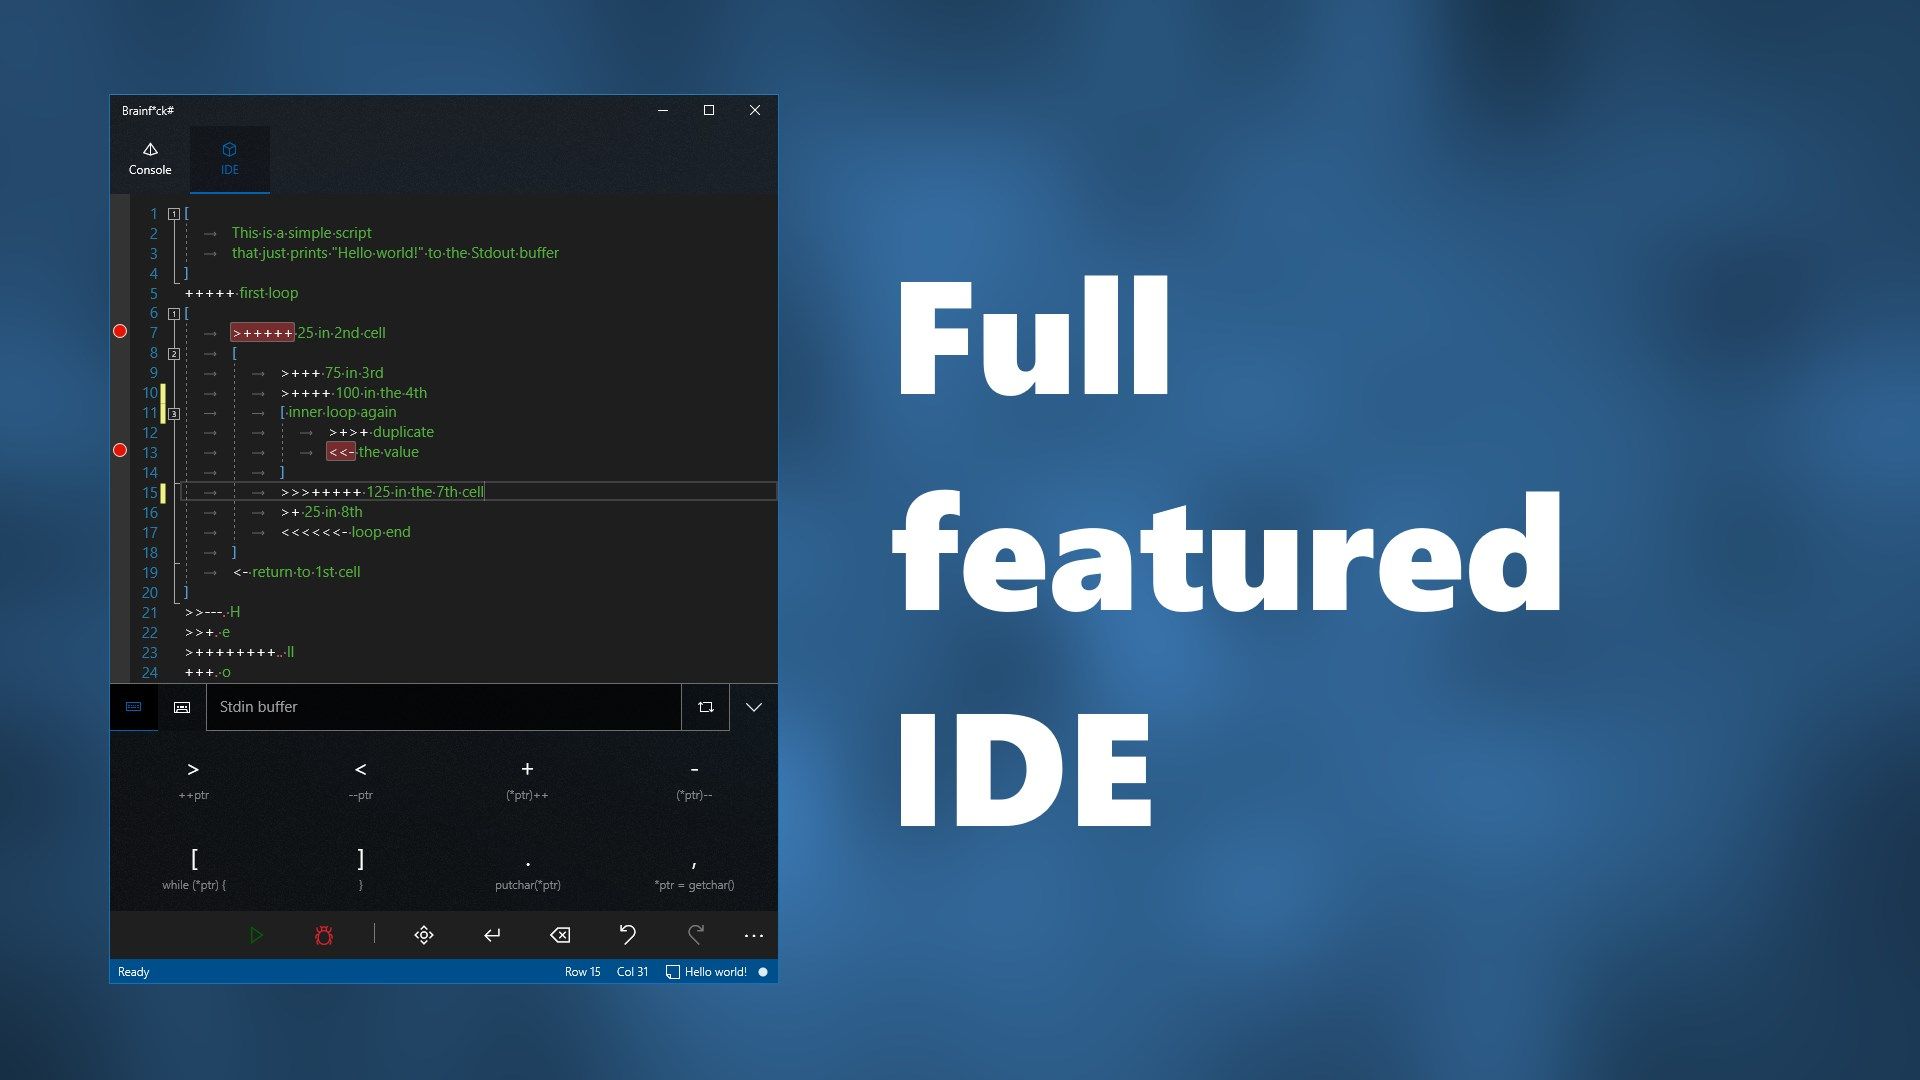
With a fully featured IDE that supports breakpoints, syntax highlight, autocompletion and more, an interactive console and lots of other features, this app offers the most complete programming experience in Brainf*ck on any platform.
If your are a developer who knows how to write in C and you want to try something different, if you’re just curious about this language, or if you’ve heard about it and you want to use it to create something crazy, this app offers everything you need to get you started.
// The Brainfck language
This language is easy to understand but difficult to use. Every program starts with an array of caracters (16 bit values in this app) that has every cell set to 0, and a pointer on the first cell. You can move the pointer back and forth with the < and > operators and increment and decrement the value of the cell that is actually pointed with + and -. The operator . prints the Unicode char corresponding to the value of the cell that is pointed, and the , operator assigns to the actual cell the value of the first character in the Stdin buffer. You can also create loops with [ and ]. The loop starts if the value of the current cell is greater than 0, and ends if the cell that is pointed at the end of it is 0. If the source code contains characters that are not the Brainfck operators, they are ignored by the interpreter, so you can write your comments inside the code without any problems.
// You can send me an email from the info window if you have a feature suggestion or if you found a bug
Key features
-
IDE with syntax highlight and code autocompletion
-
Indentation depth indicators and column guides
-
Git diff markers to see the changes in the current code file
-
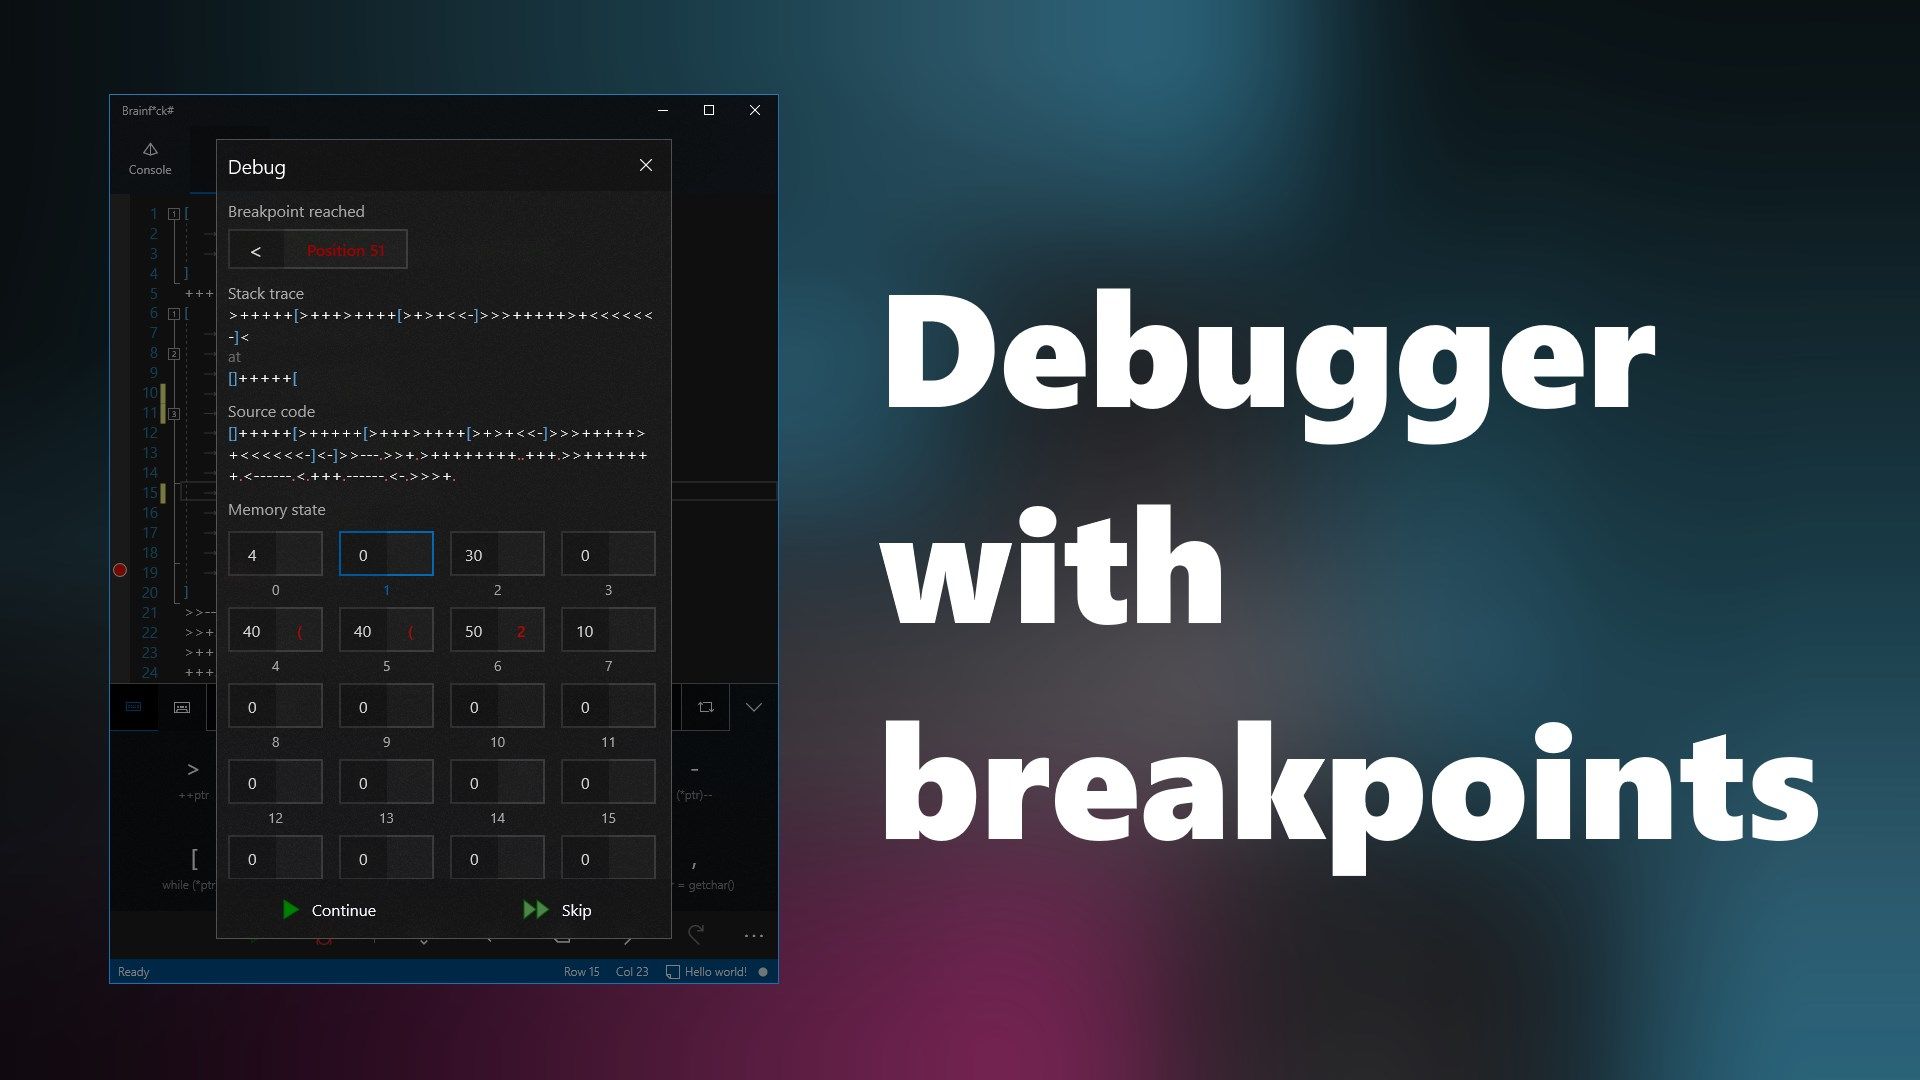
Breakpoints support with complete debugging experience
-
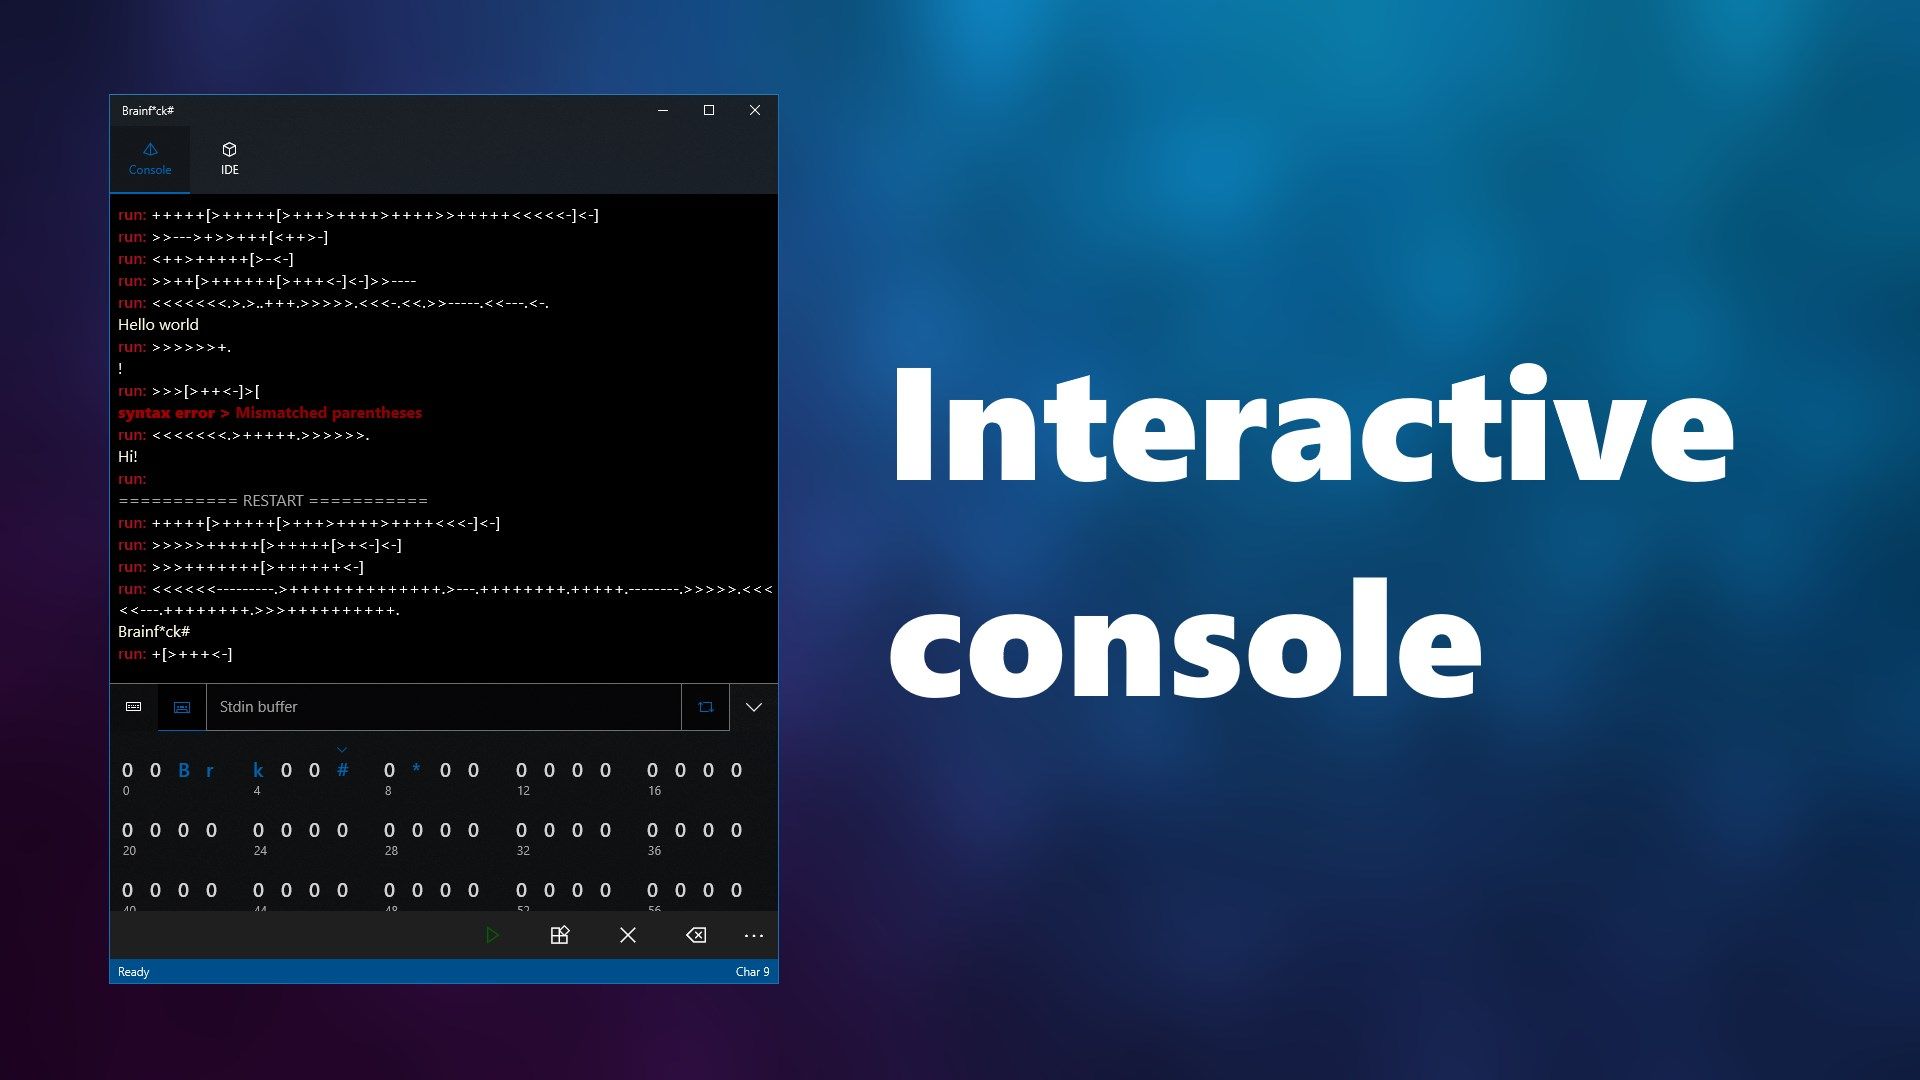
Full featured console to test your scripts and improve your coding level
-
Real time memory state with the all the info about every cell (value and Unicode character) and the pointer actual position
-
Exceptions handler, infinite loops auto suppression
-
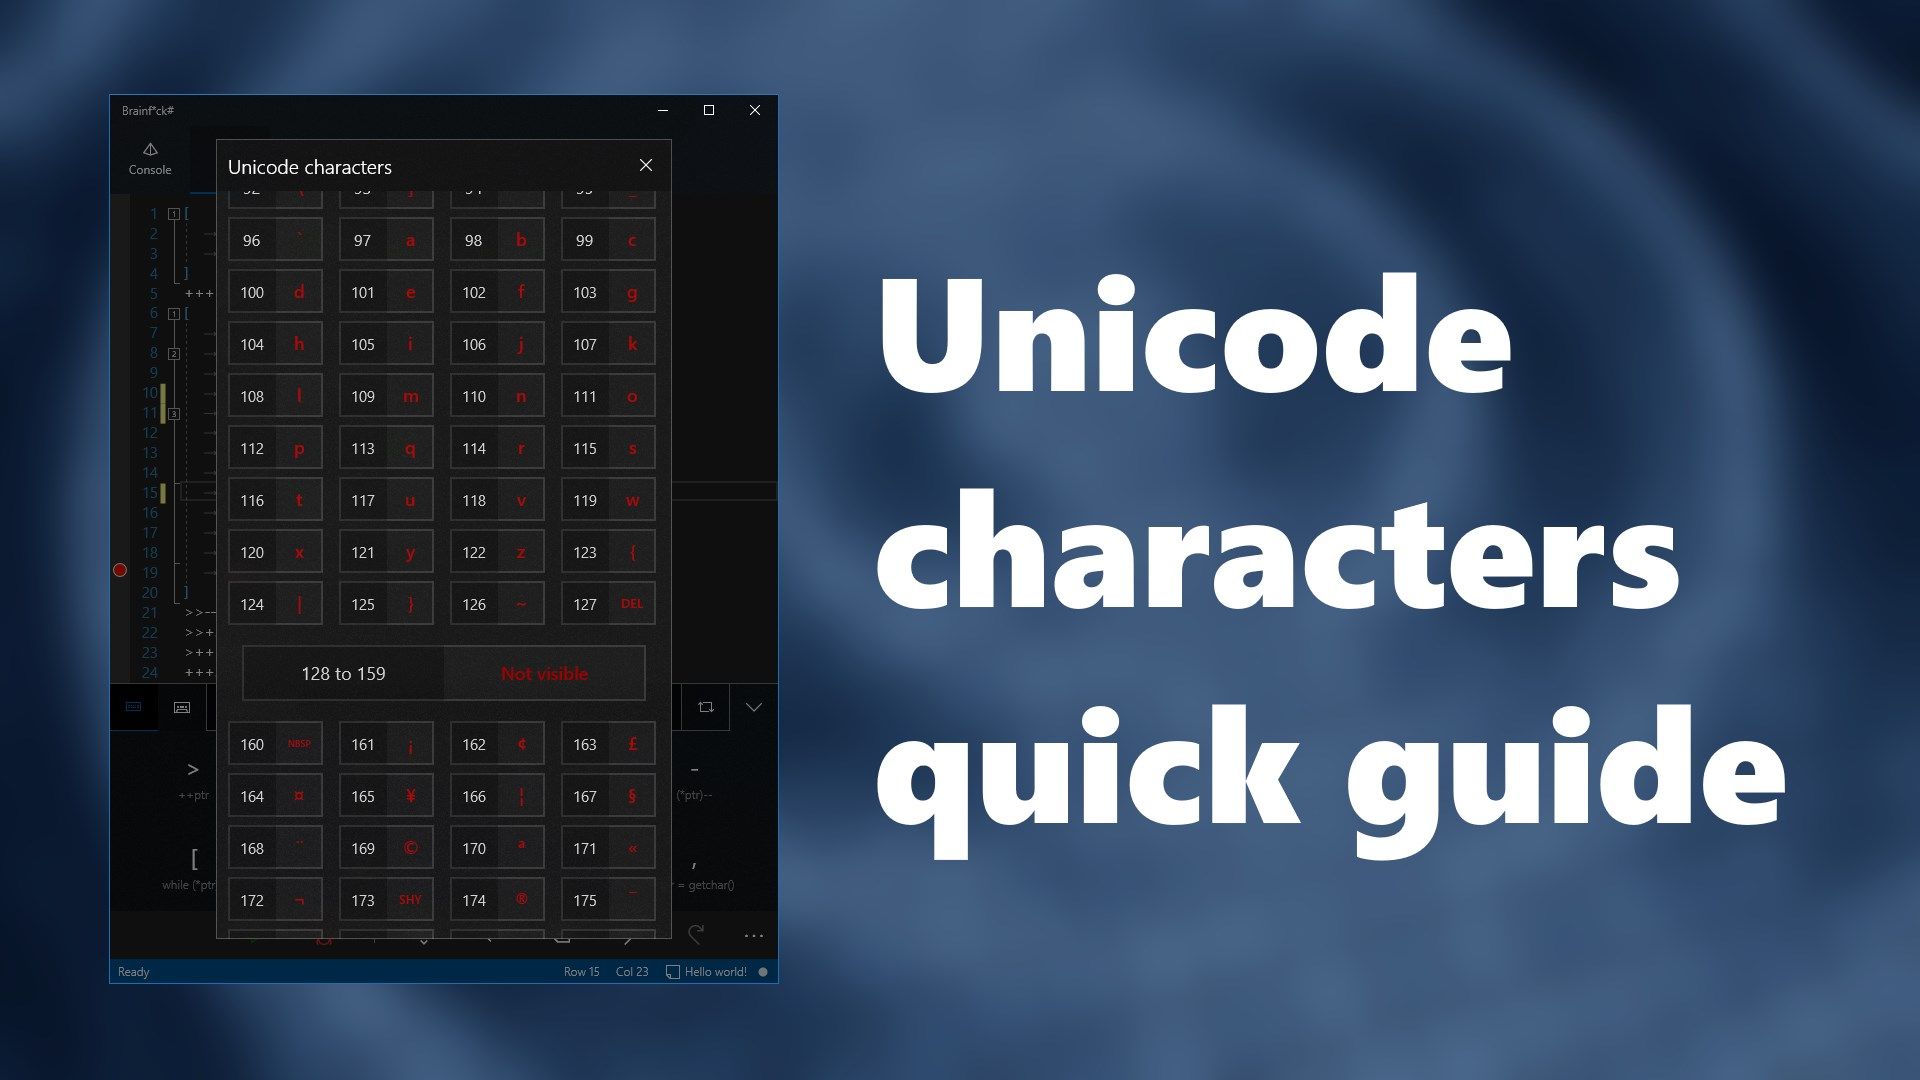
Complete 8 bit Unicode char table to help you code text prints and see the values of the characters in the Stdin buffer
-
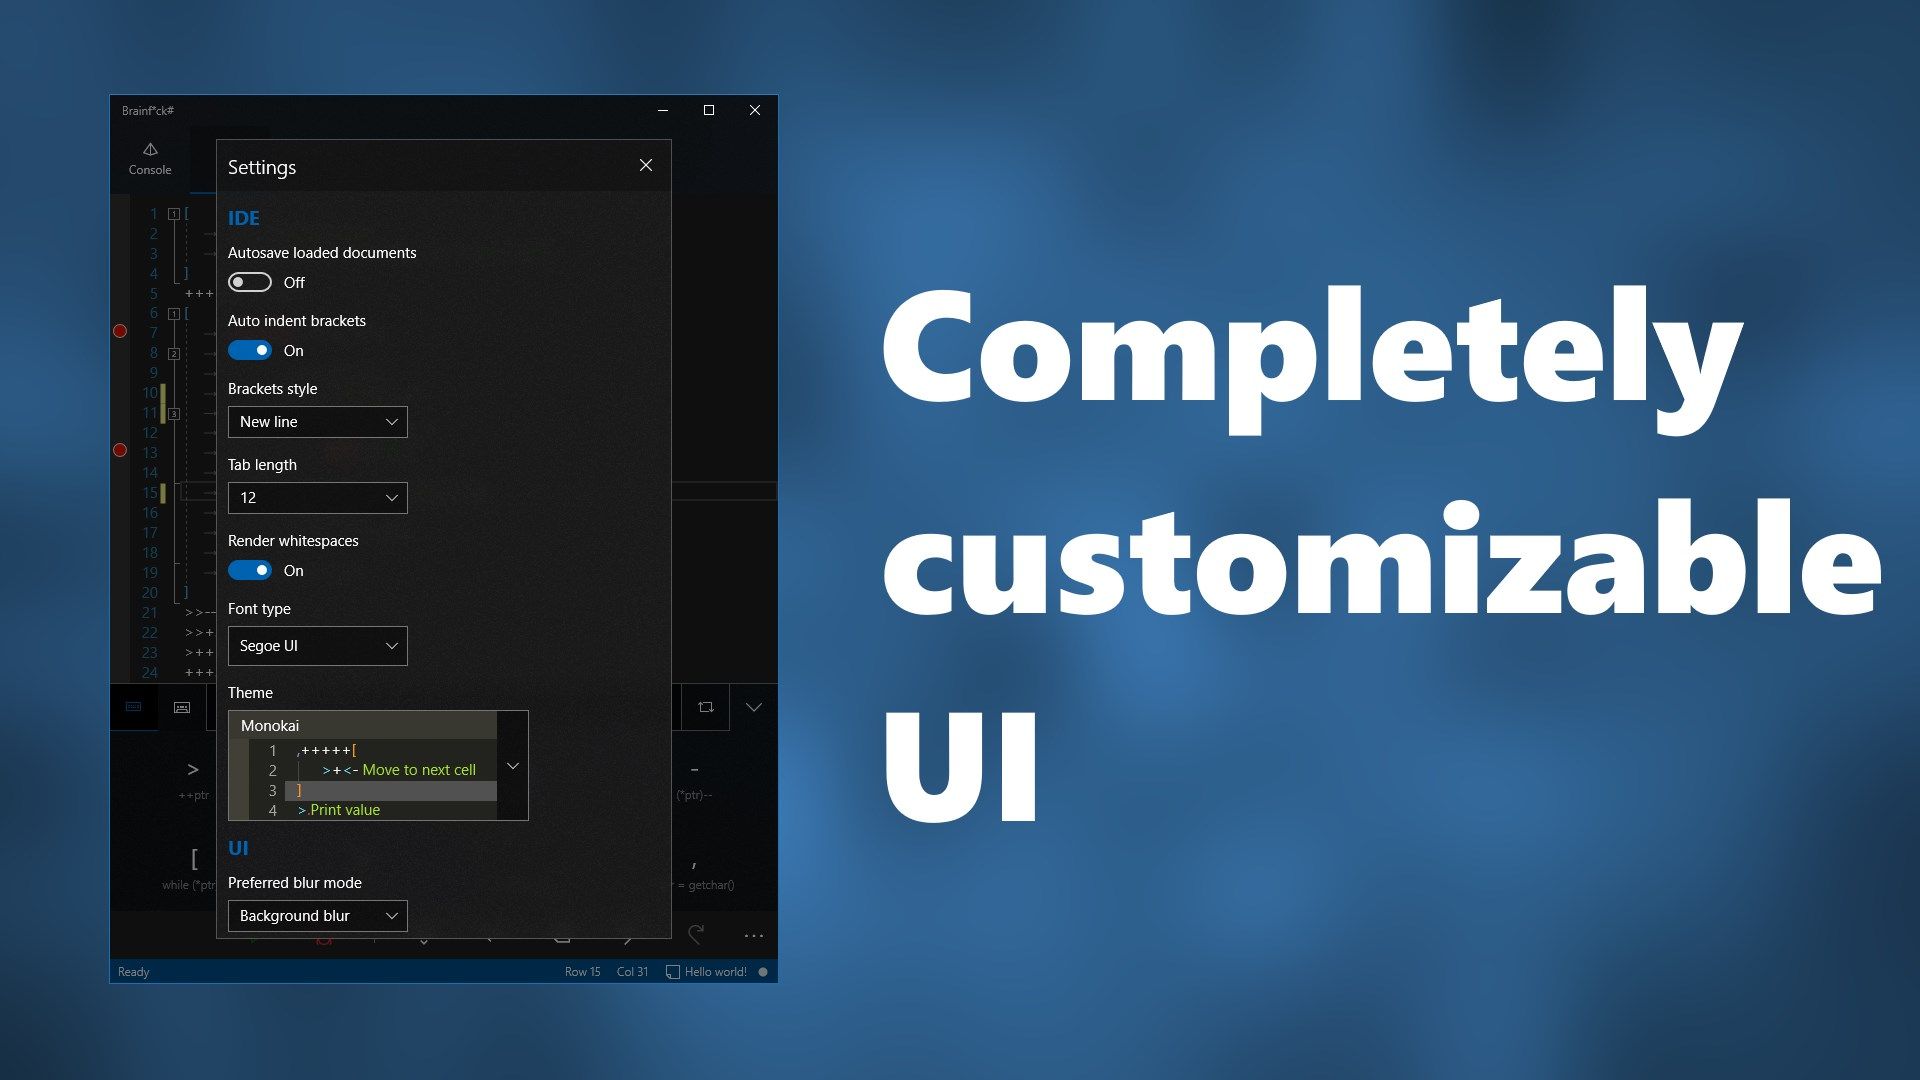
Touch friendly UI with on screen custom keyboard and dedicated text navigation buttons
-
Undo/redo features to help you write your code more easily
-
The interpreter debugger tells you the position of the operator that caused an exception and displays the complete stack trace
-
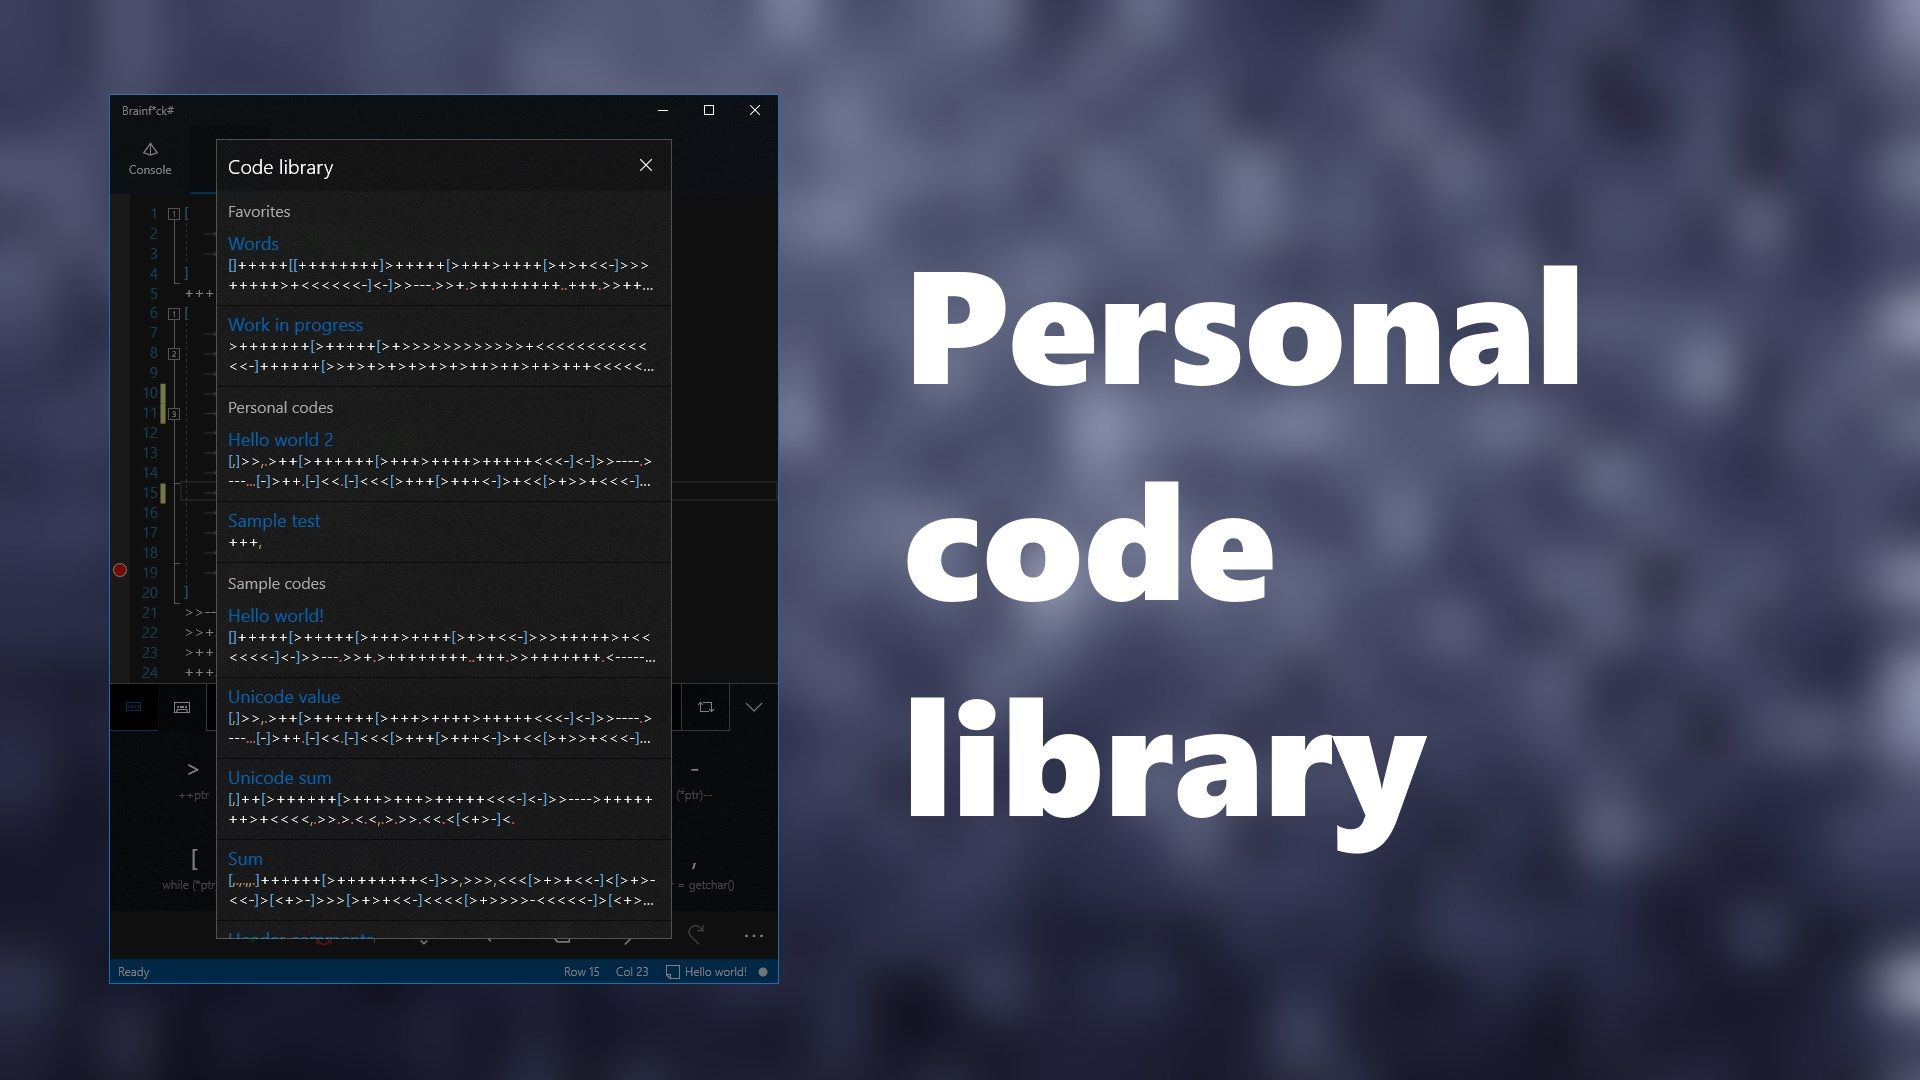
Save your scripts in your personal library shared across devices and edit them whenever you want
-
Custom overflow mode for the memory state
-
PBrain extensions support to declare and call functions
-
Windows Timeline support to quickly continue working on other devices