
Chart Geany
Rating
1
Reviews
2
App details
About Chart Geany
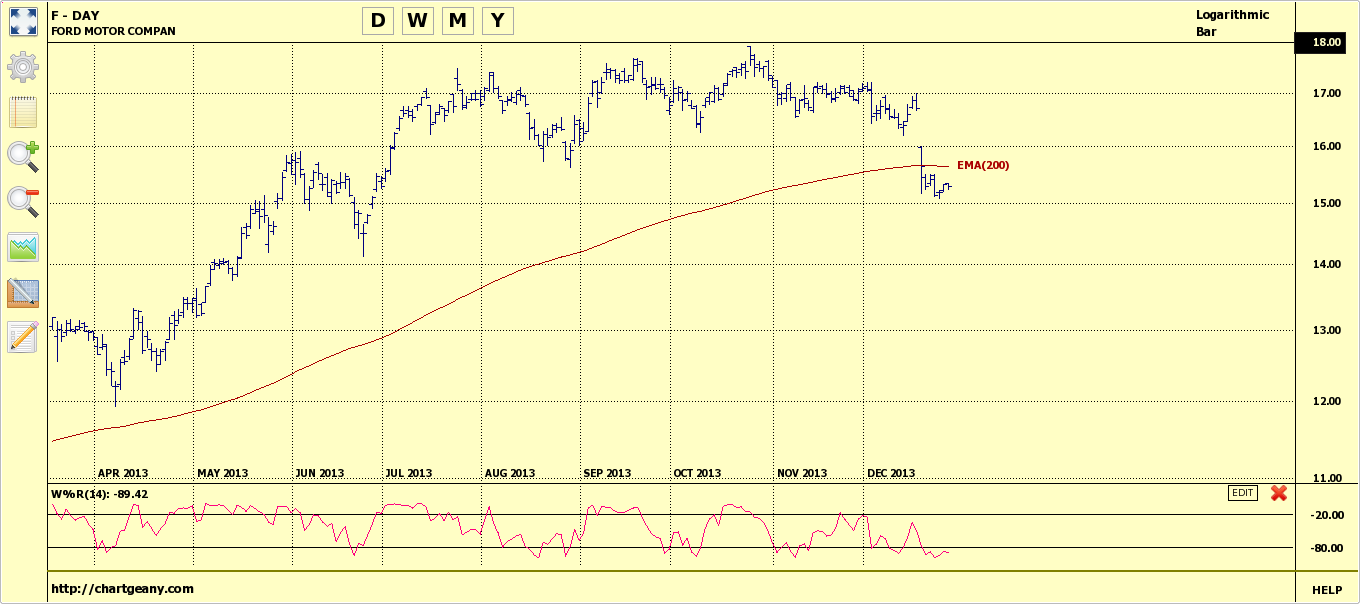
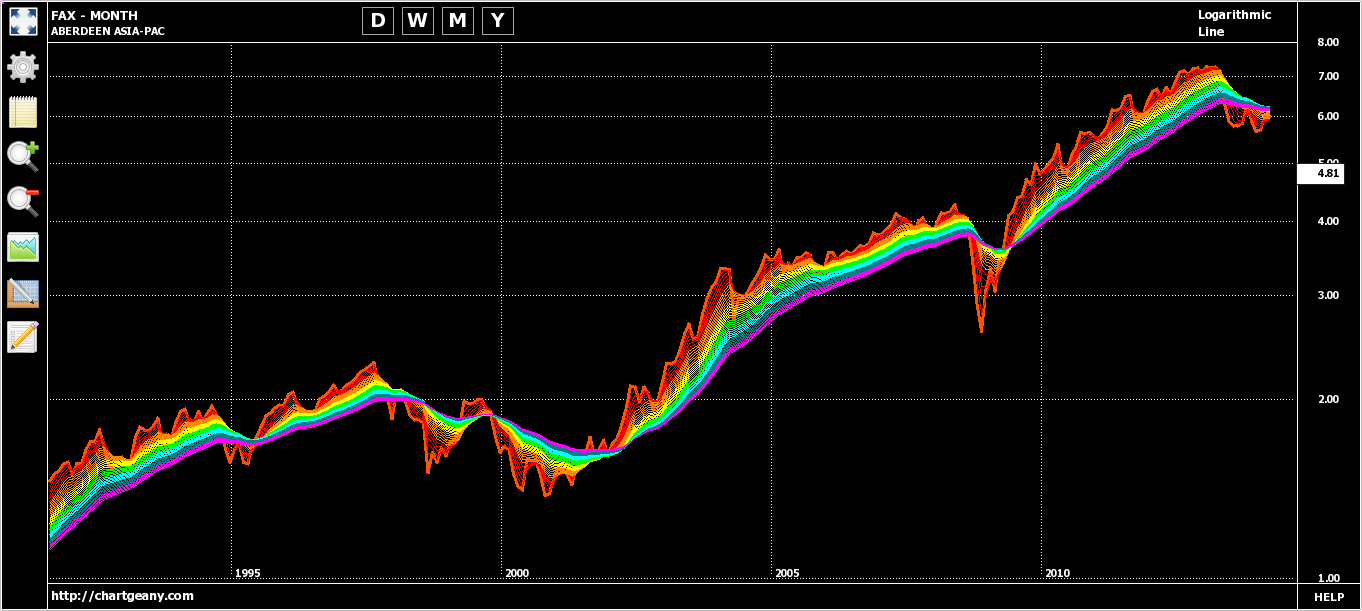
Chart Geany is a software solution for market technical analysis and charting. It depends on Direct X and Visual C++ Runtime Libraries. Novice and experienced investors will find a fast and easy tool to analyze stocks and other financial instruments on their desktop, and take the right decisions. Visually enhanced charts, along with eighteen technical indicators and various drawing objects, provide a unique working environment for every technical analyst.
Windows Store trial comes without any restrictions but it will expire after two weeks.
Key features
-
Compatible with stocks, mutual funds, futures, indices
-
Major technical analysis indicators: Simple Moving Average, Exponential Moving Average, MACD, Fast and Slow Stochastics, Money Flow Index, Rate of Change, Relative Strength Index and more
-
Indicator templates with import and export
-
Easy download of quotes from Yahoo Finance or AlphaVantage
-
Statistics and fundamental data if available from the data feed
-
Tab-based graphical user interface. You can manage the charts the same way you manage the pages of your web browser
-
Line, Bar, Candle and Trend Candle (Heikin-Ashi) charts
-
Linear or semi-logarithmic price scaling
-
Stock ticker
-
Time-frames: Day, Week, Month and Year
-
One click screen shots for charts
-
Periodical price updates, along with chart refresh. Must be available from the data feed
-
Portfolio manager for multiple portfolios and multiple currencies
-
CGScript, an ISO C99 dialect, which allows you to design custom technical indicators and objects from scratch
-
Bitcoin and cryptocurrency charts from Yahoo Finance