Graph Tack
App details
Release date
2016-08-11
Last update
2022-03-12
Product ID
9NBLGGH4TLJS
Categories
Government & politicsAbout Graph Tack
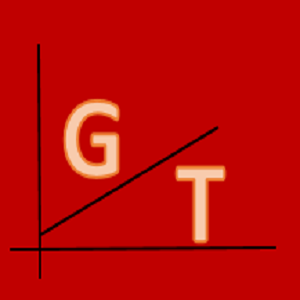
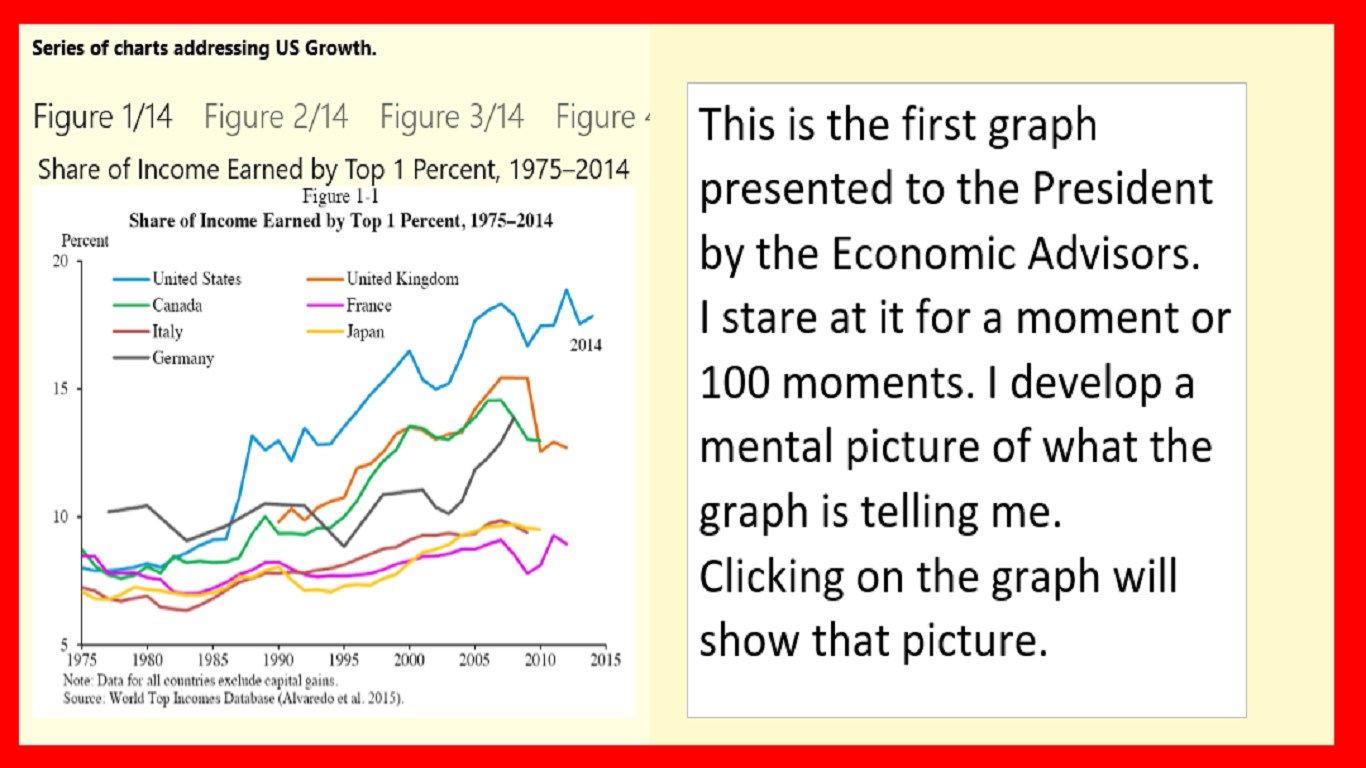
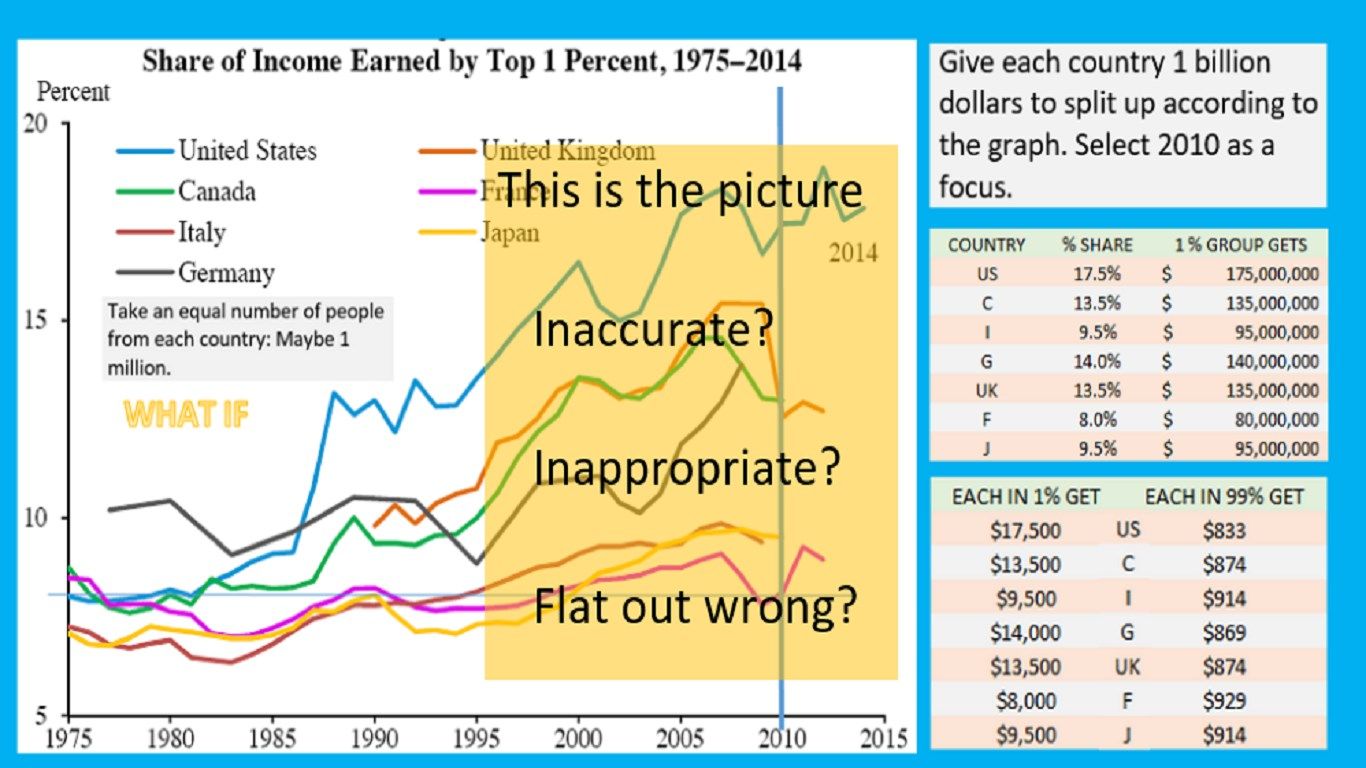
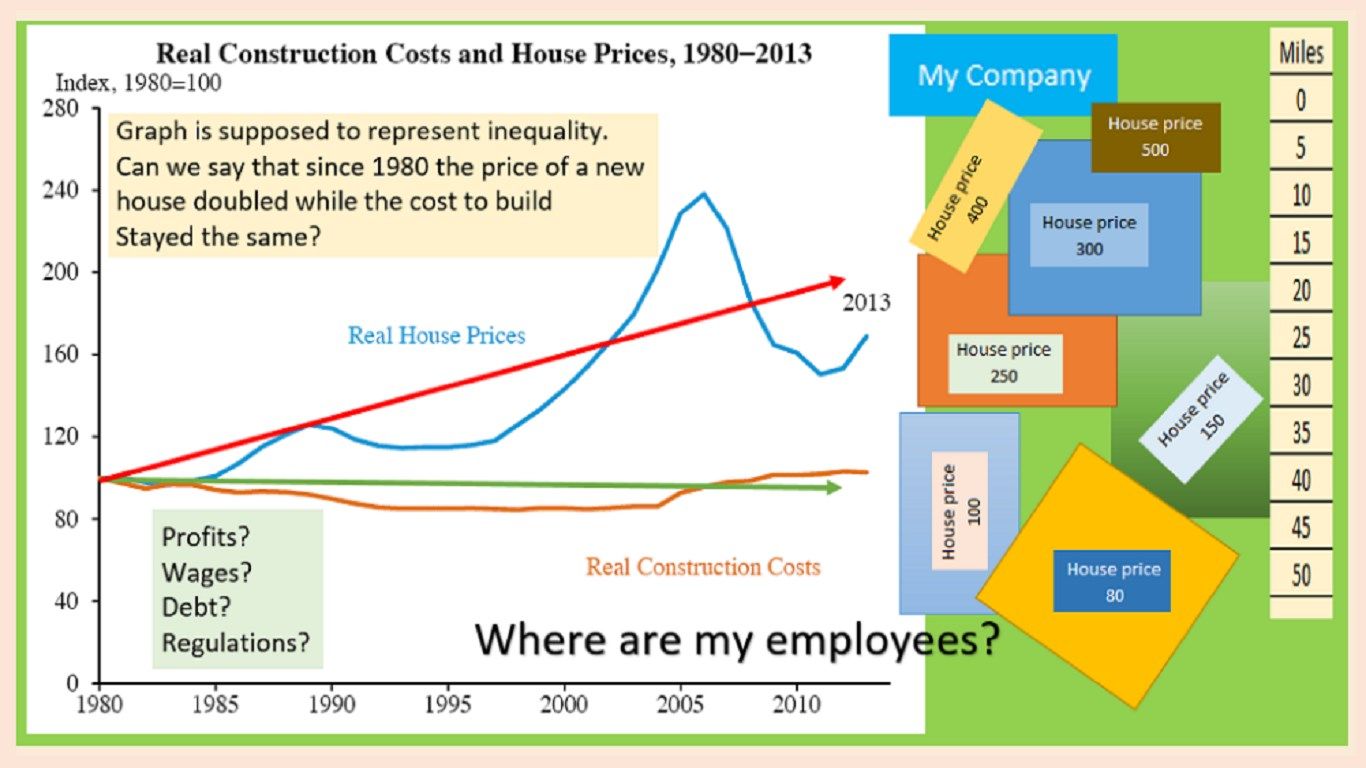
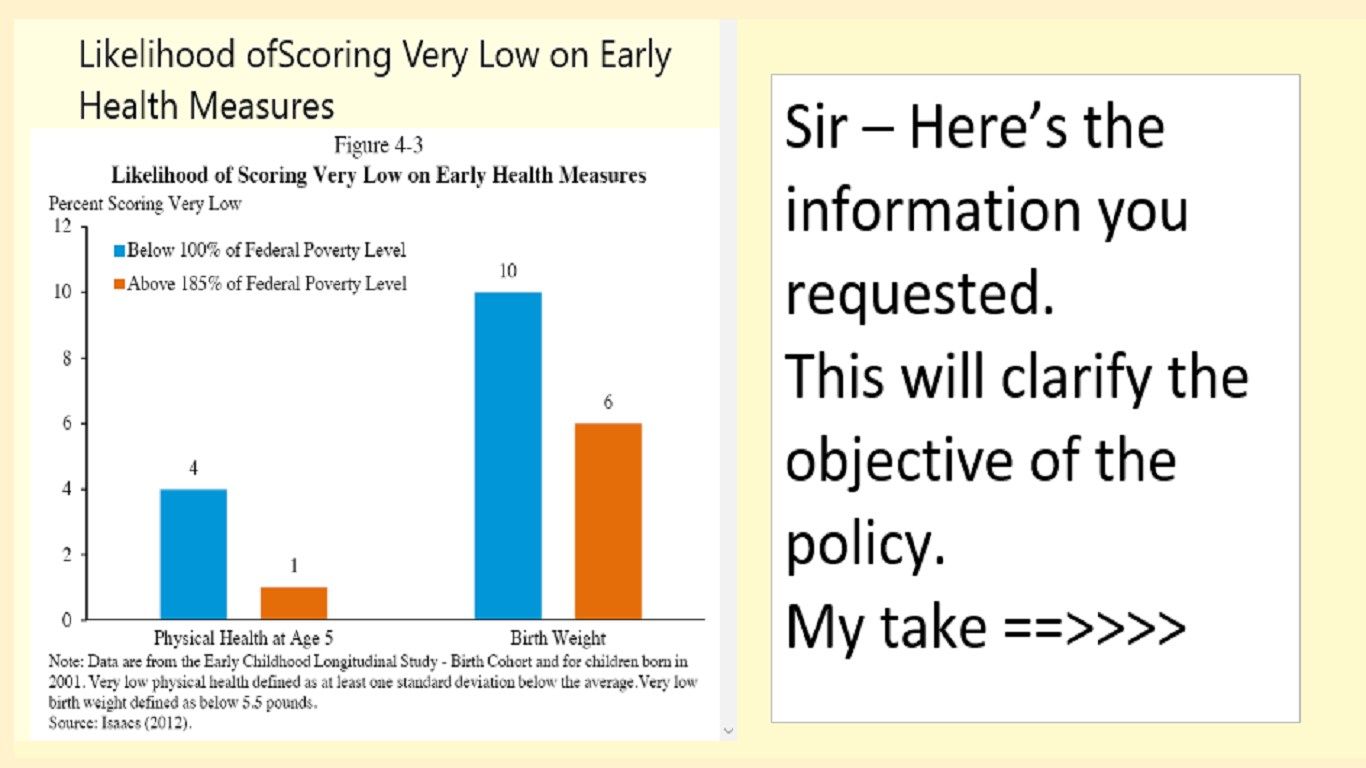
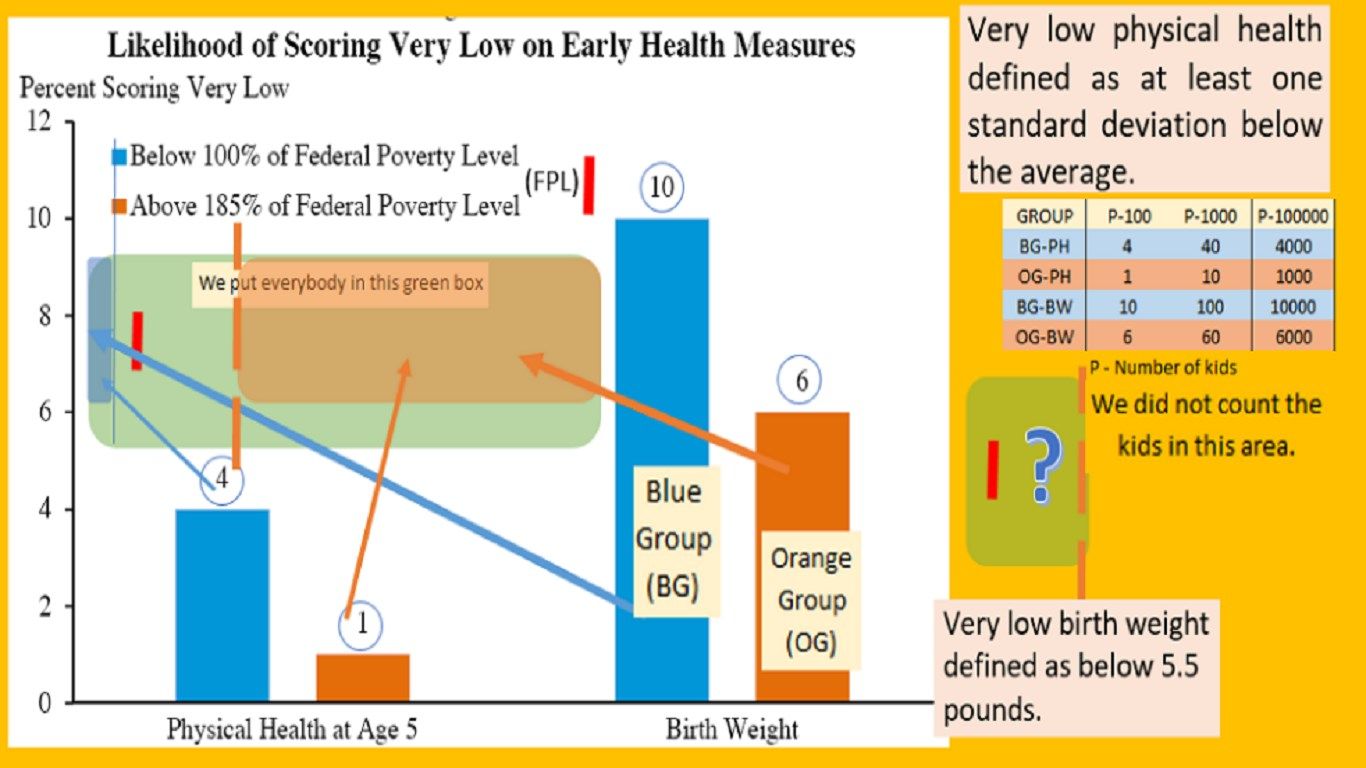
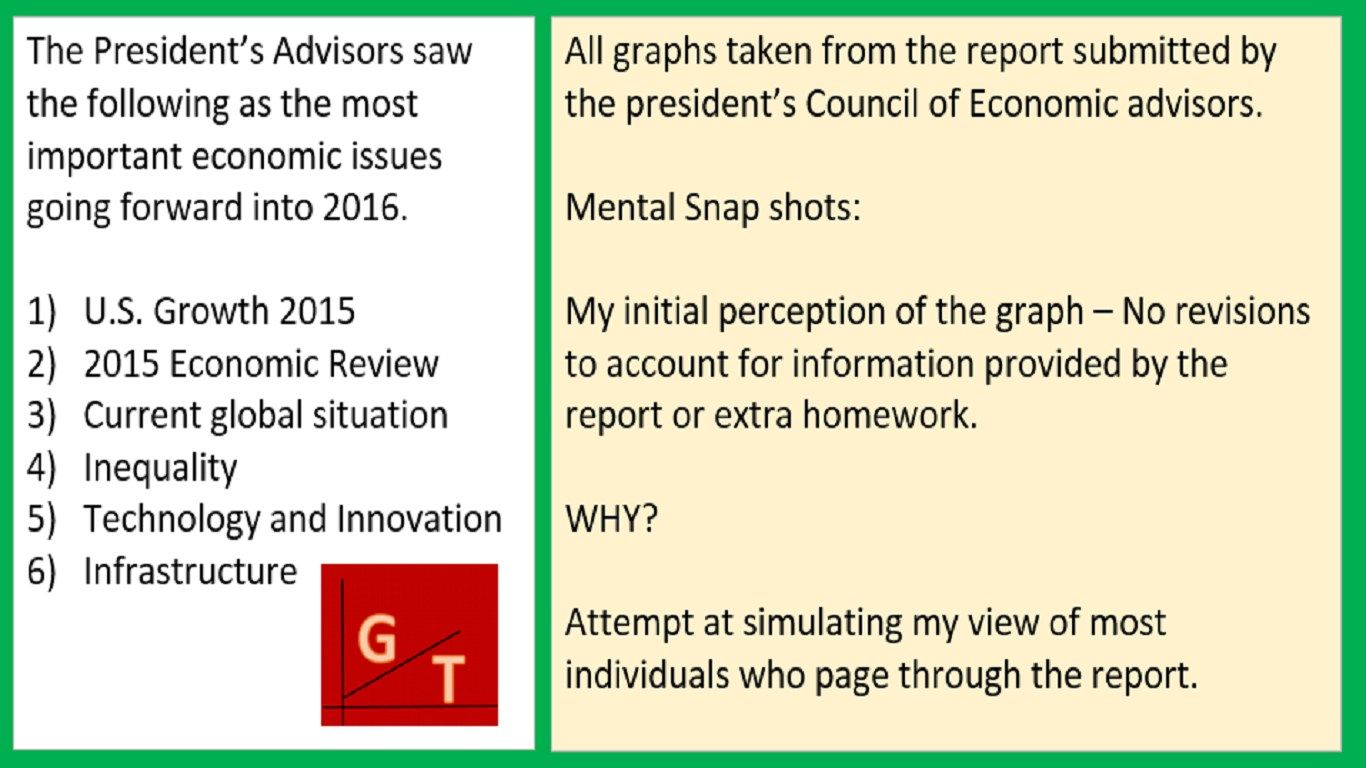
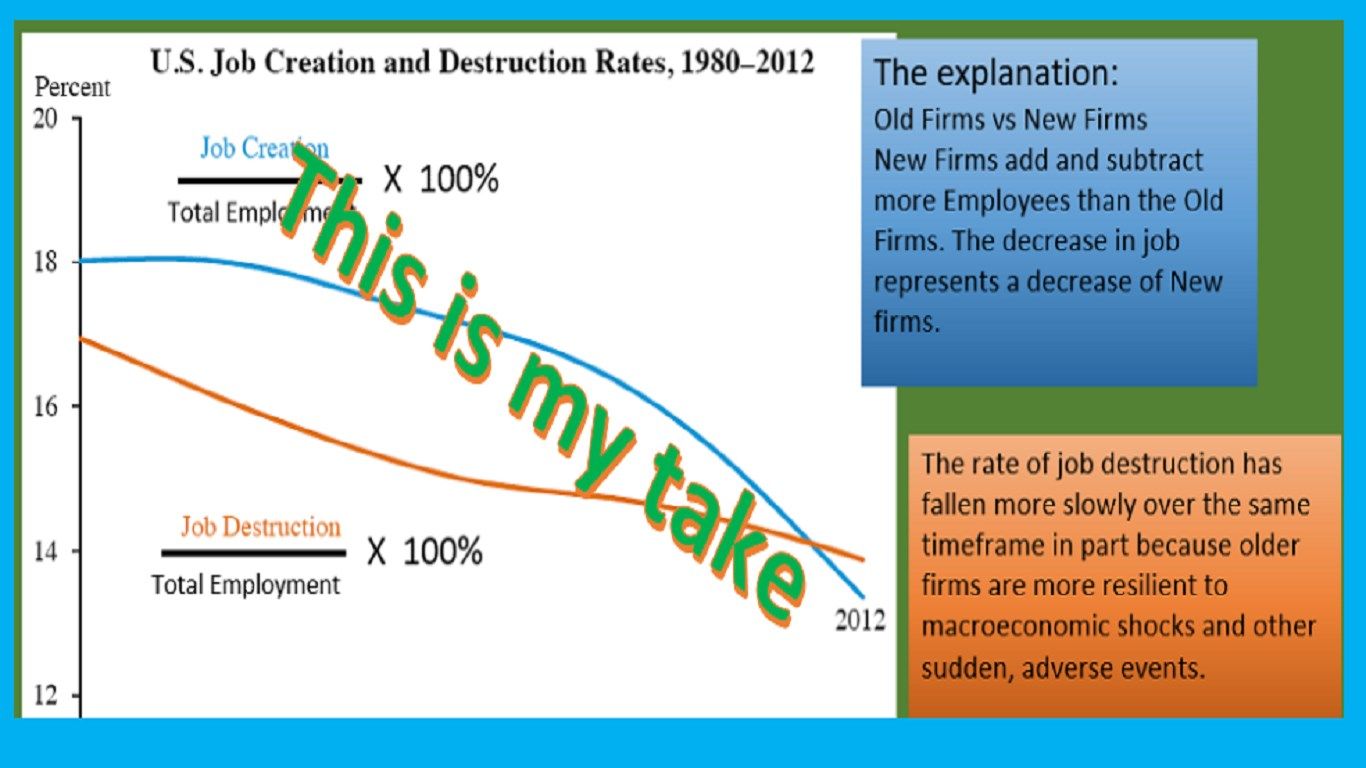
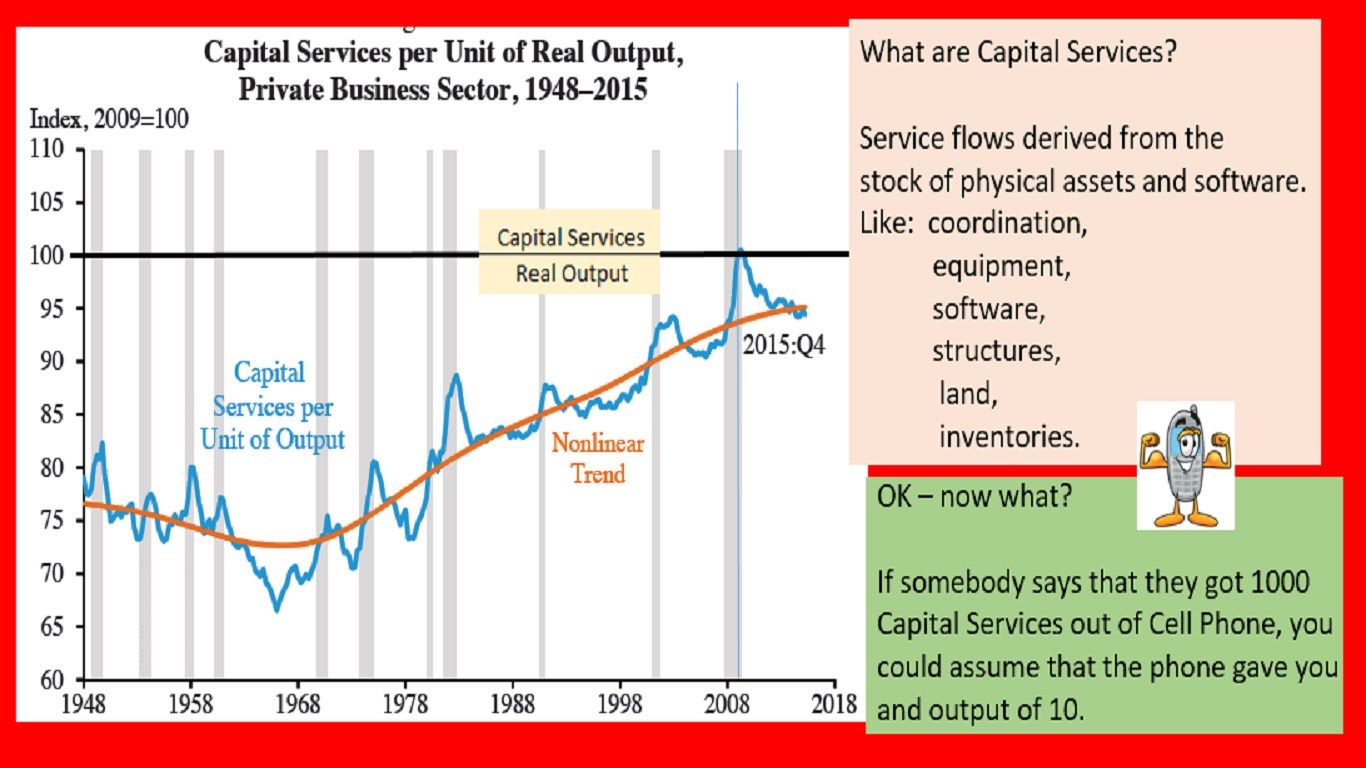
Here’s what you get. A bunch of charts Passed on to the U.S. President for policy clarification. Tap on the chart of interest and get a second chart with my initial view of what the chart is telling us. Note: each chart observation is a view of an instant in time (the initial mental snap shot). You see that first take before corrections. Hint: Every chart required at least one update. Most – Several. Knowing that the U.S. Congress and Senate are expected to use this information what are the odds that the 10 to 15 seconds of study will provide them the clarity they need.
January 2017 - added another group of graphs that council submitted Highlighting economic progress from 2008 thru 2016.
Key features
-
Straight forward navigations. Tap on a chart. Get an interpretation.