LabPlot
Rating
4.6
Reviews
5
App details
About LabPlot
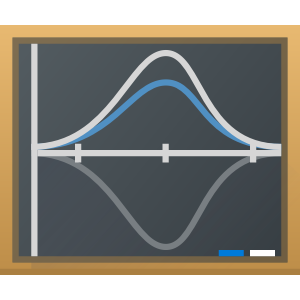
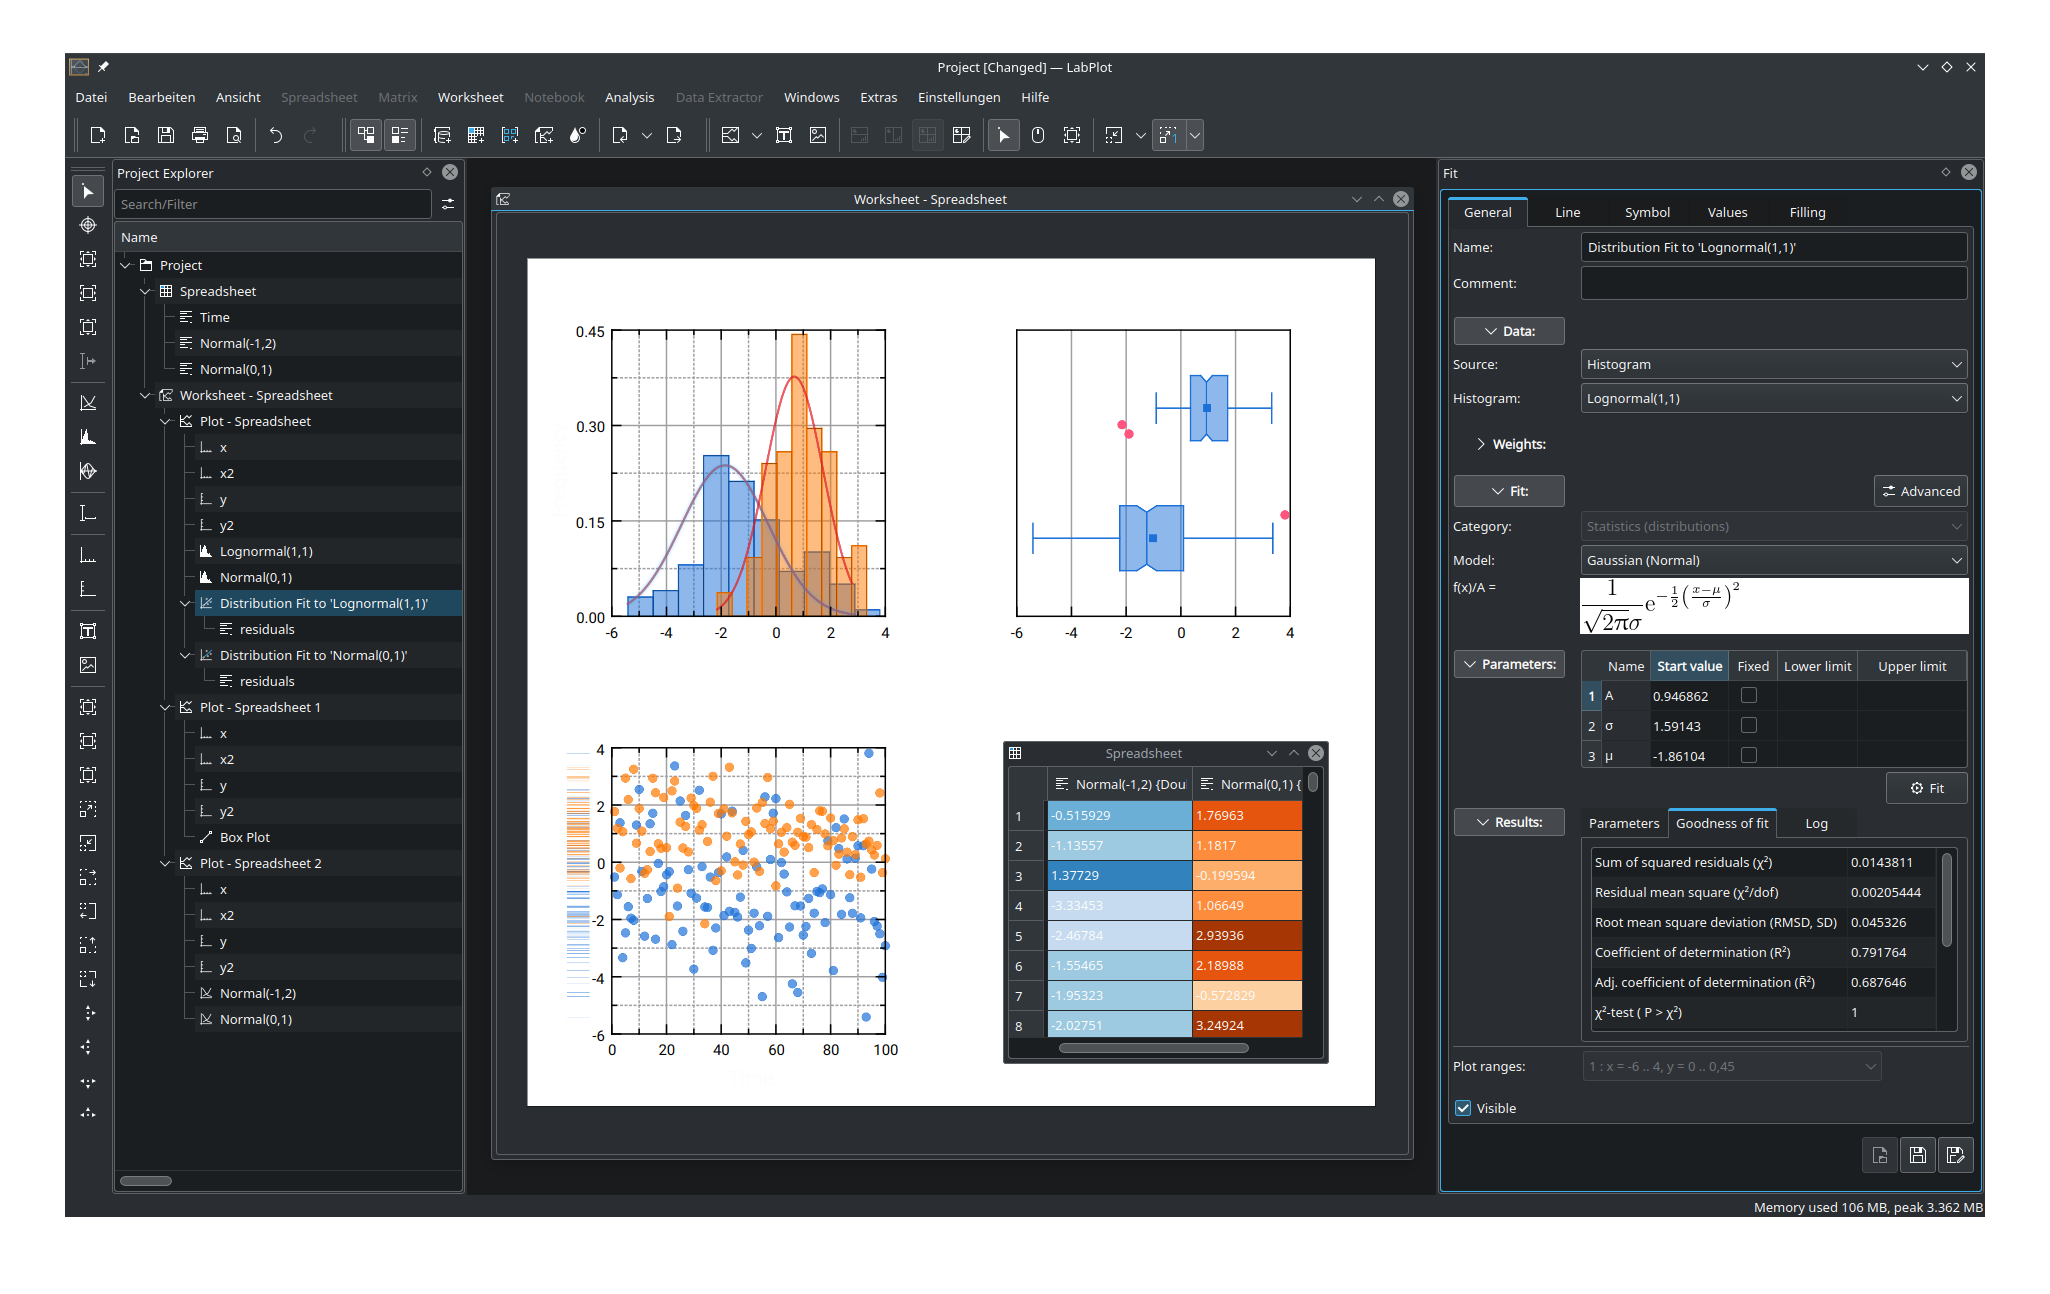
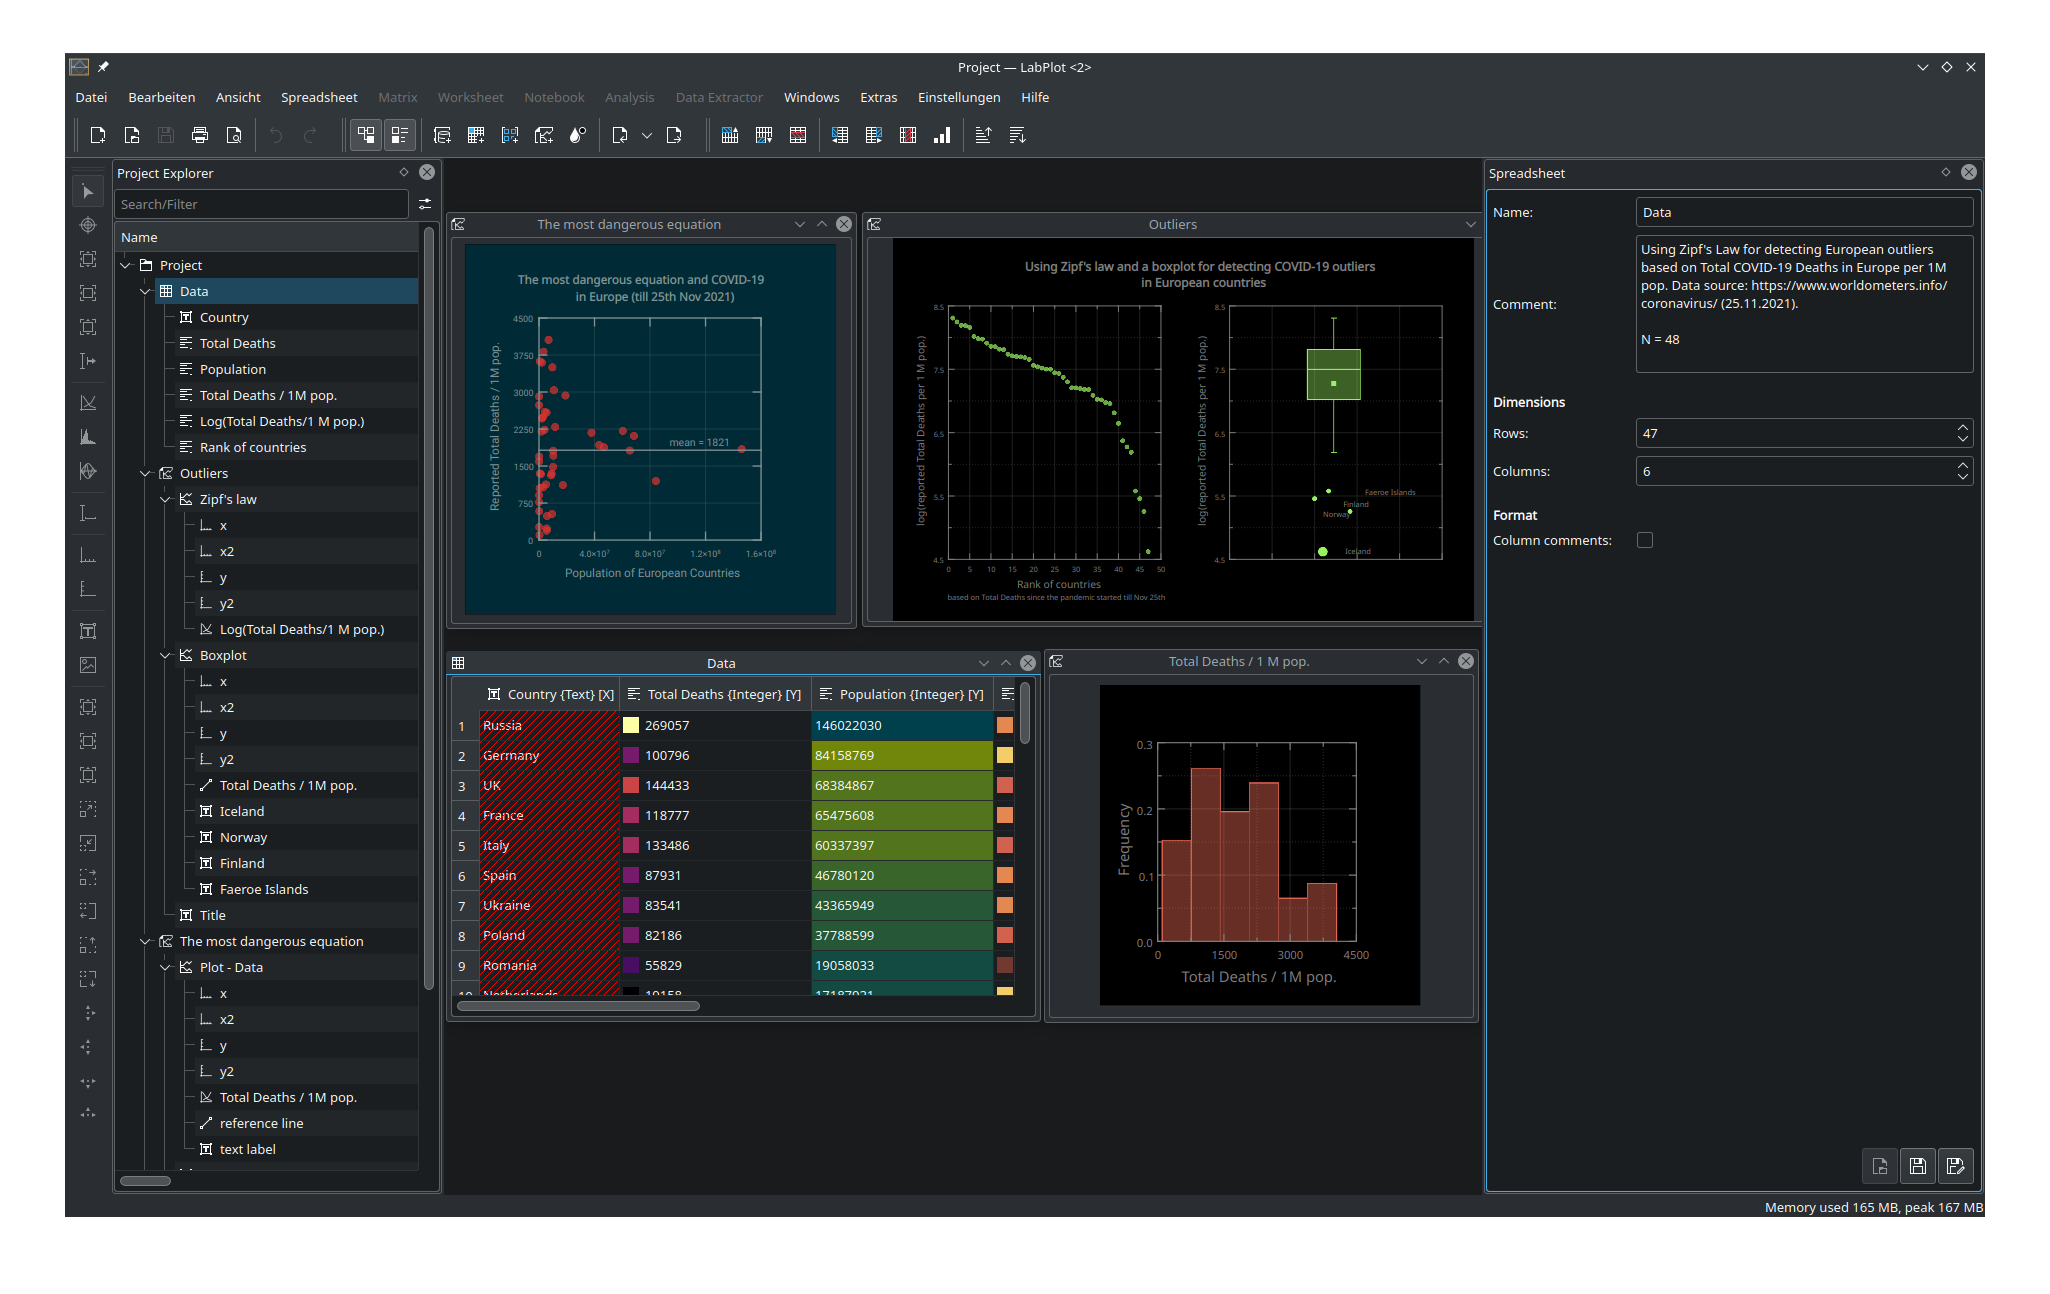
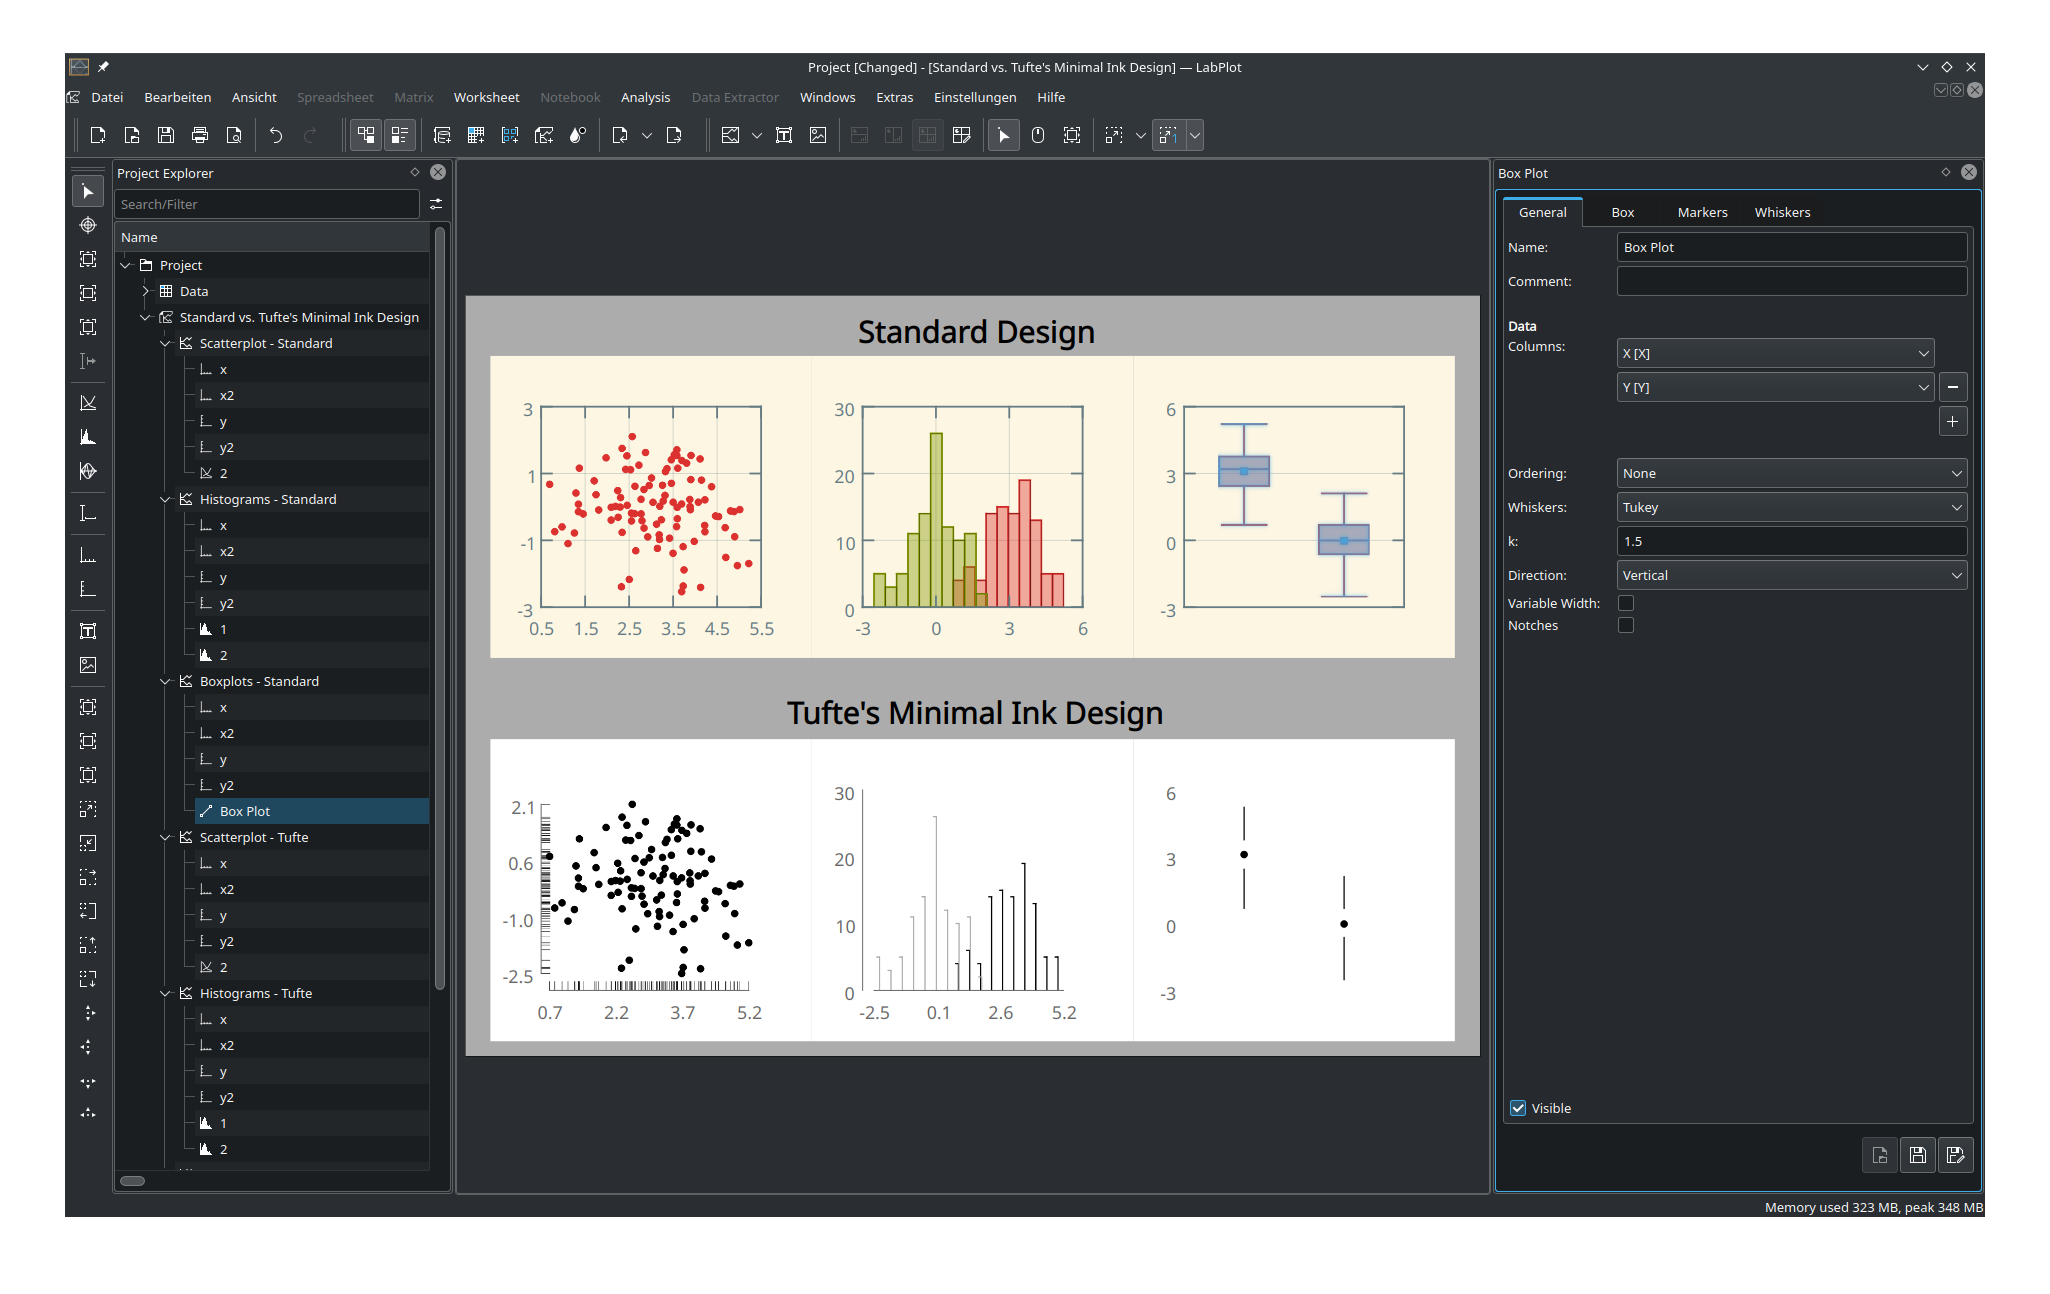
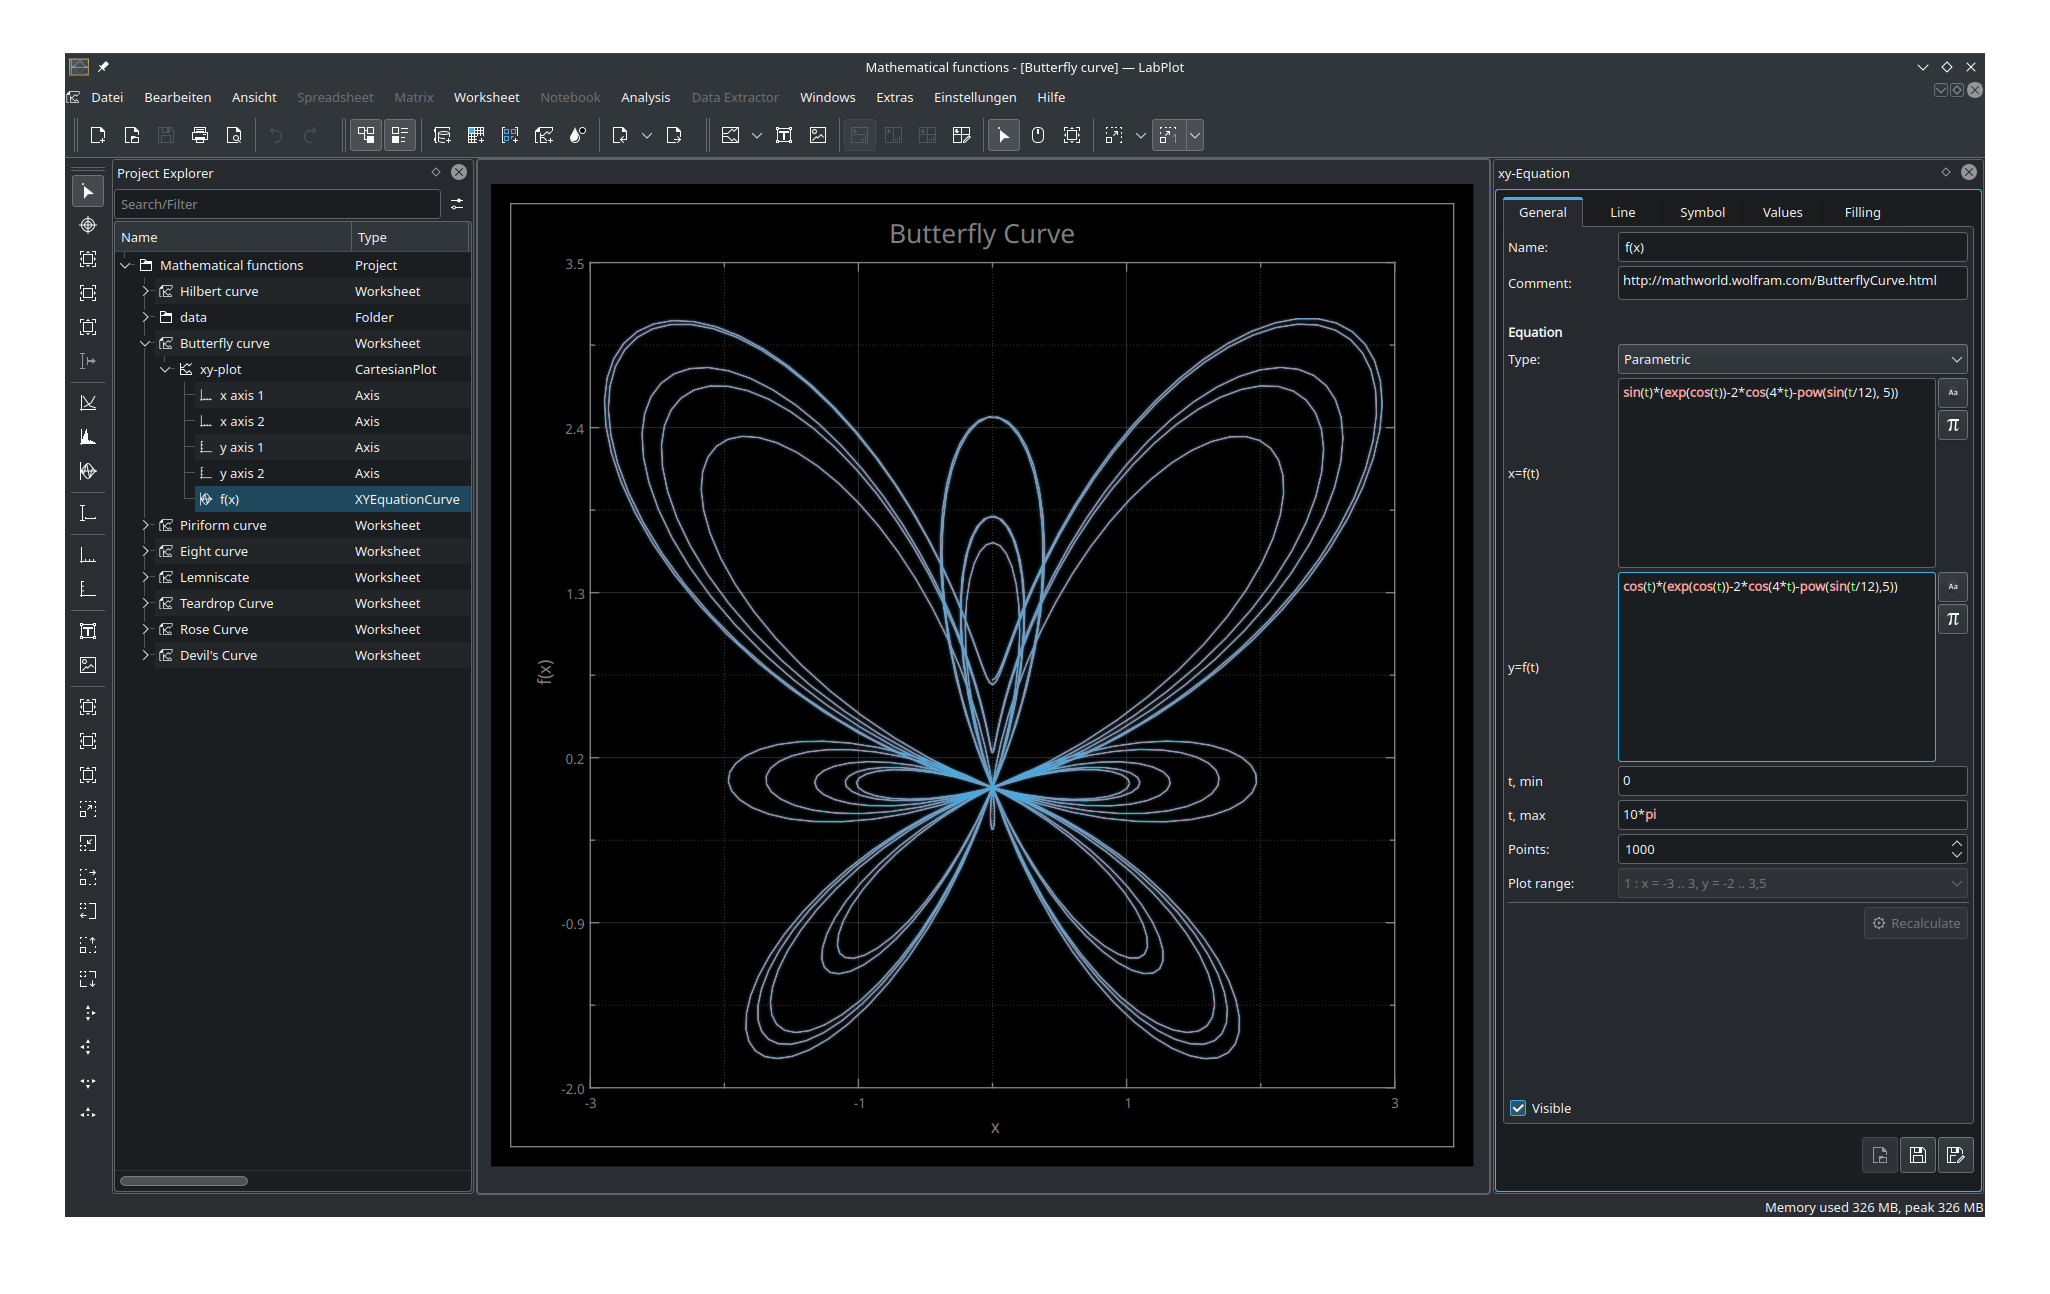
LabPlot is a FREE, open source and cross-platform Data Visualization and Analysis software accessible to everyone.
Key features
-
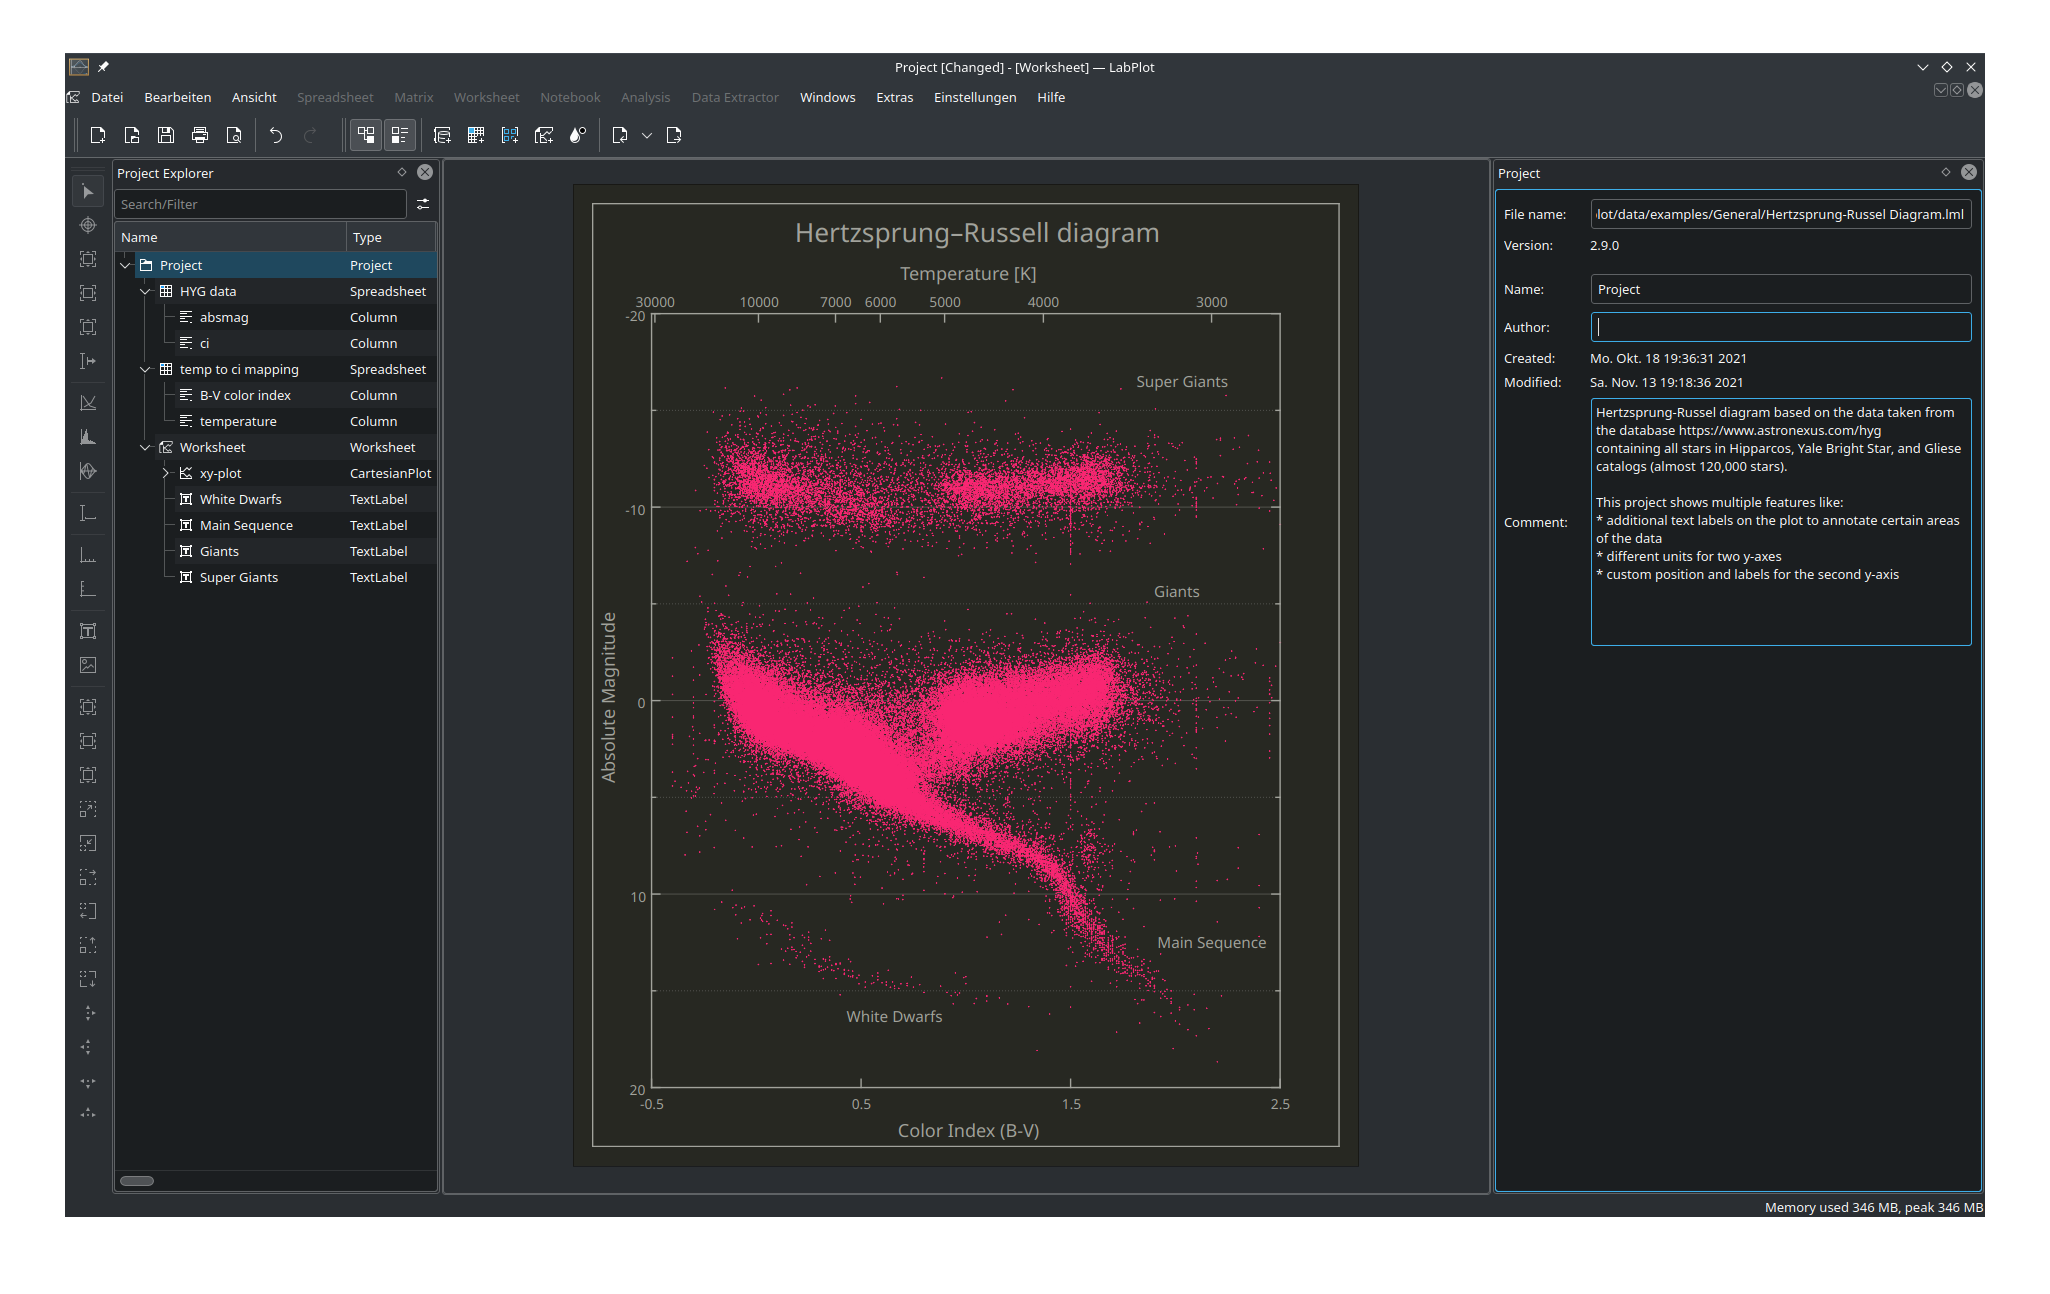
High-quality Data Visualization and Plotting with just a few clicks
-
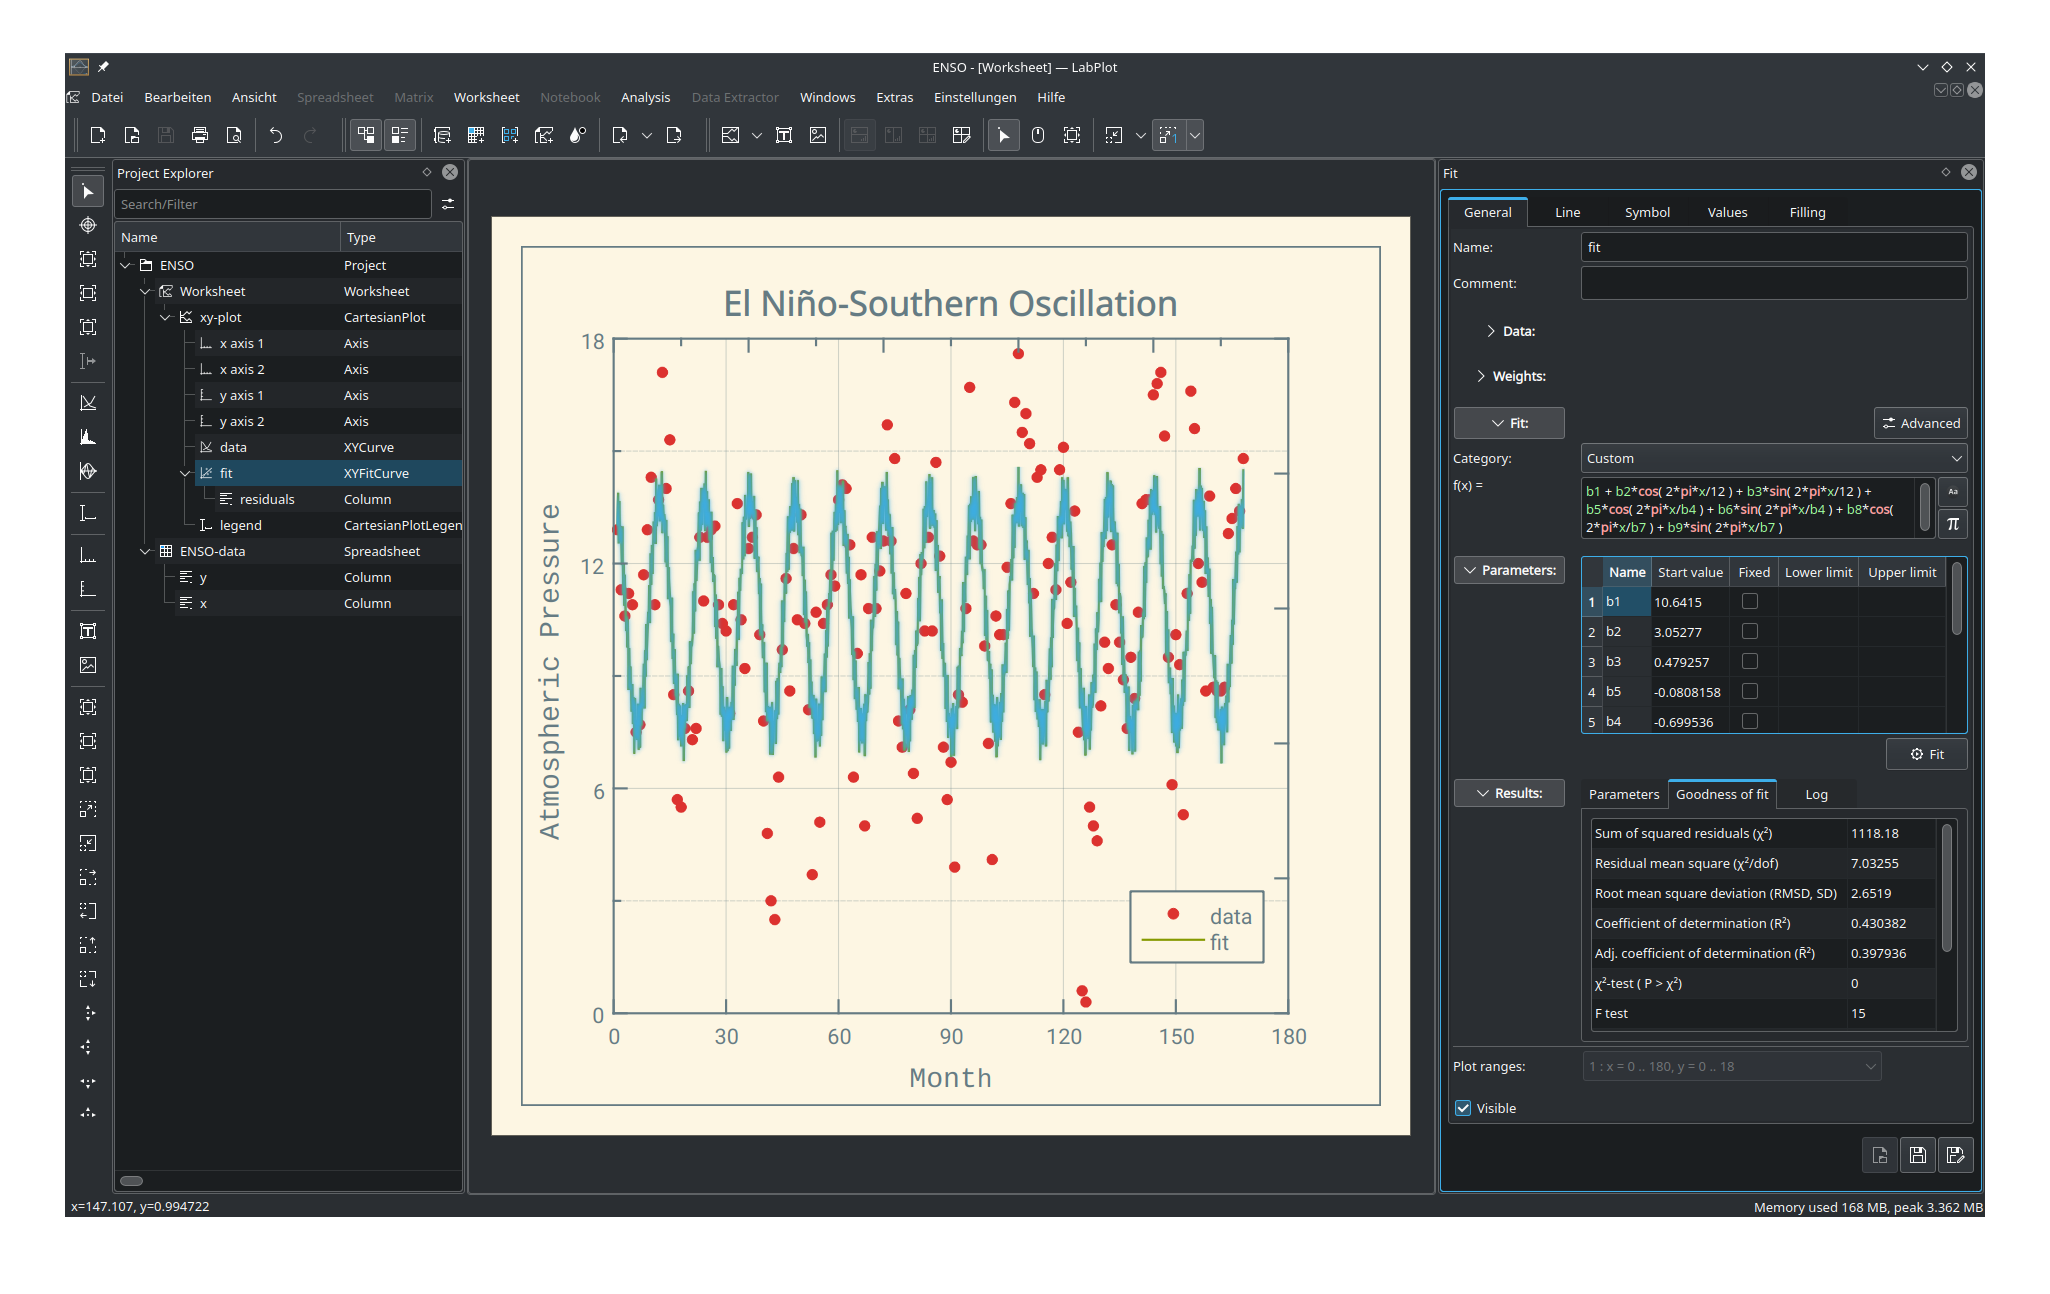
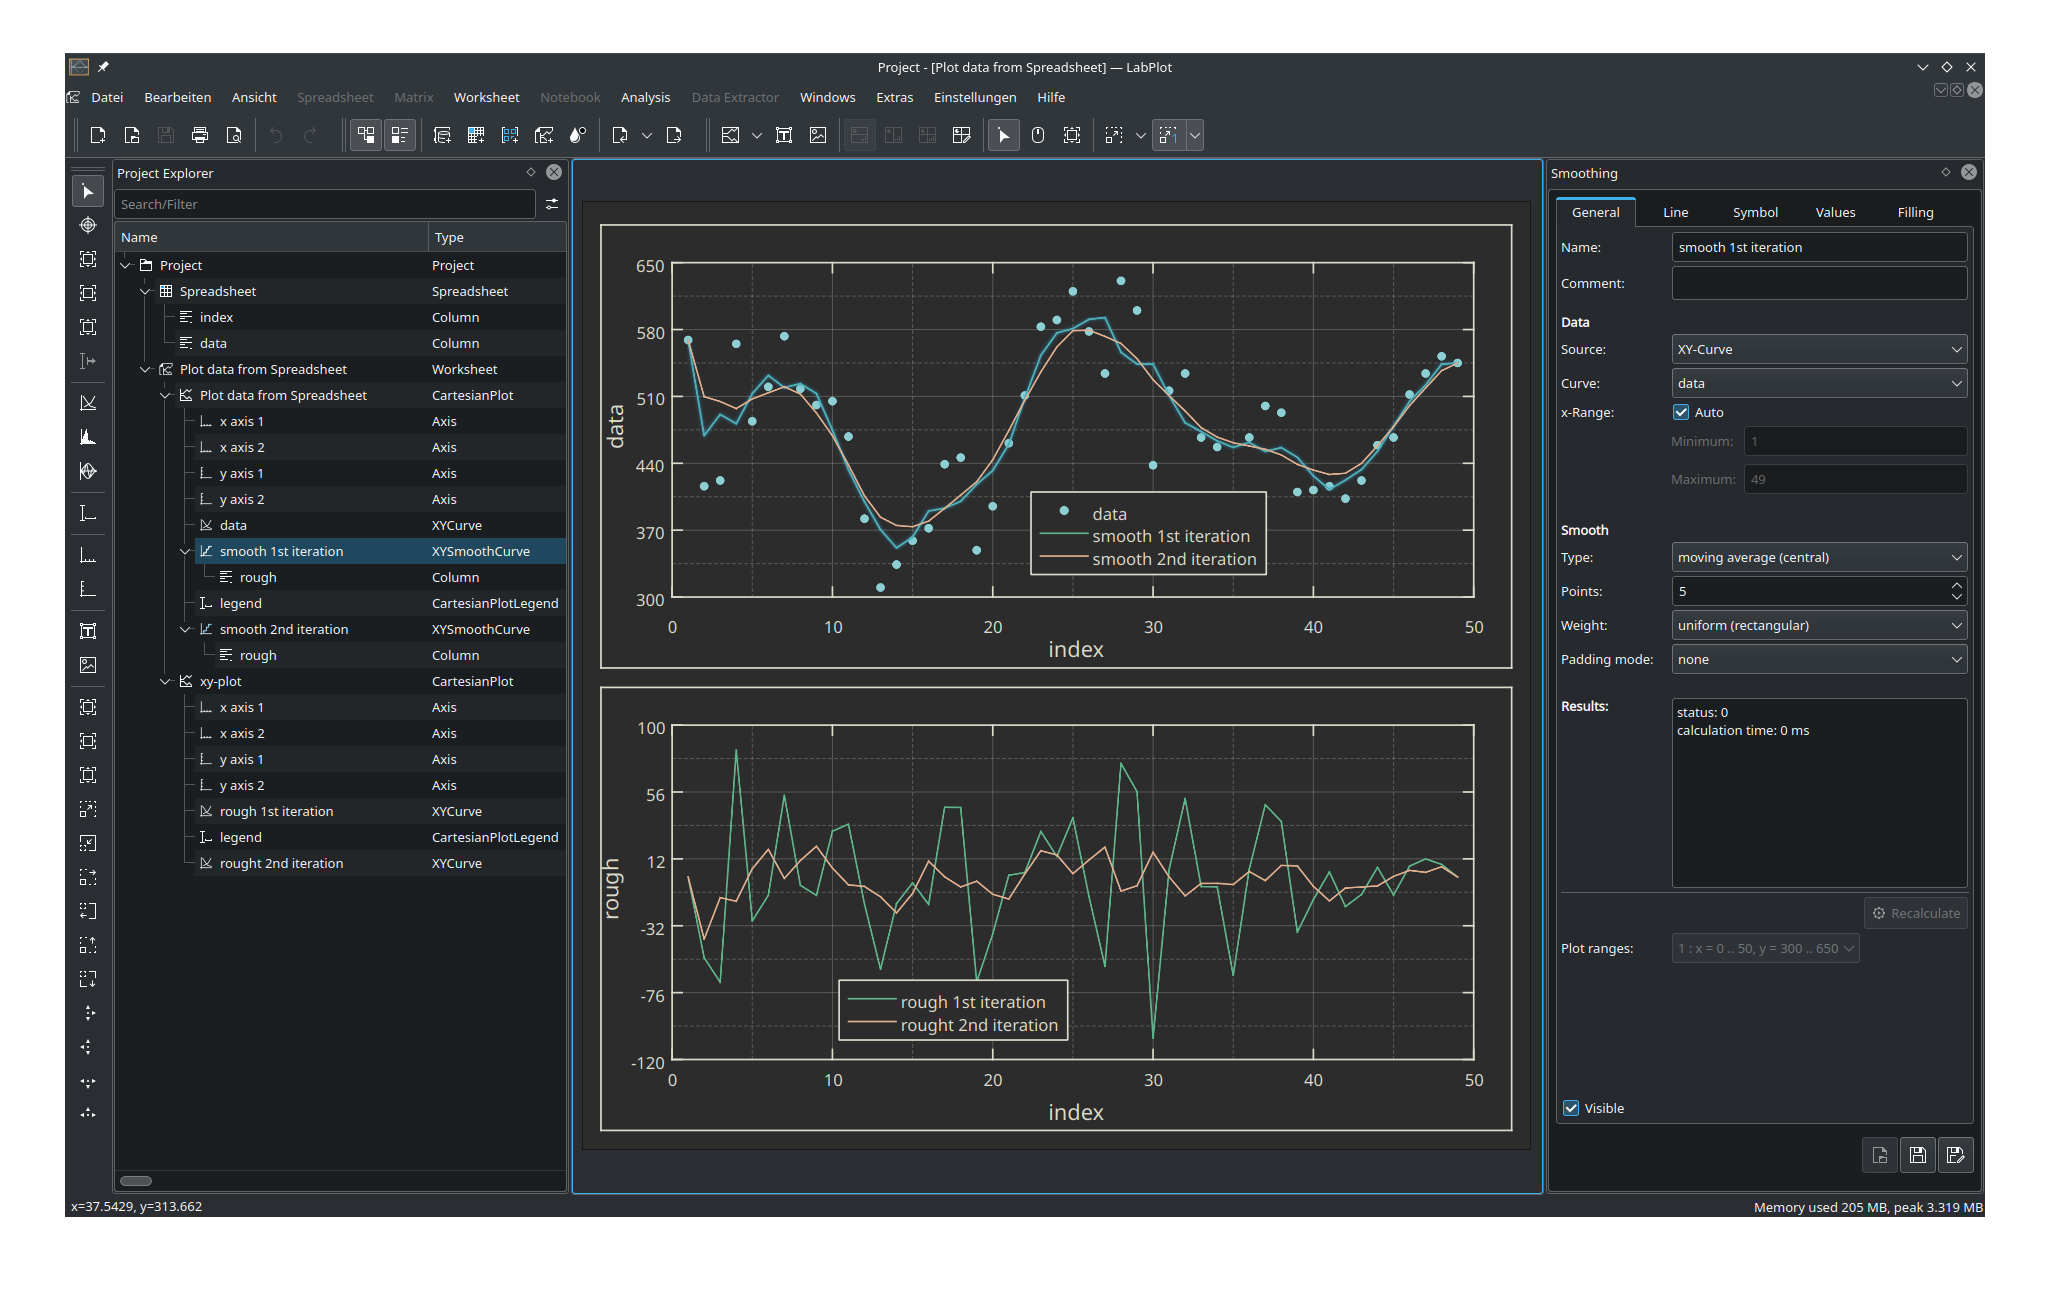
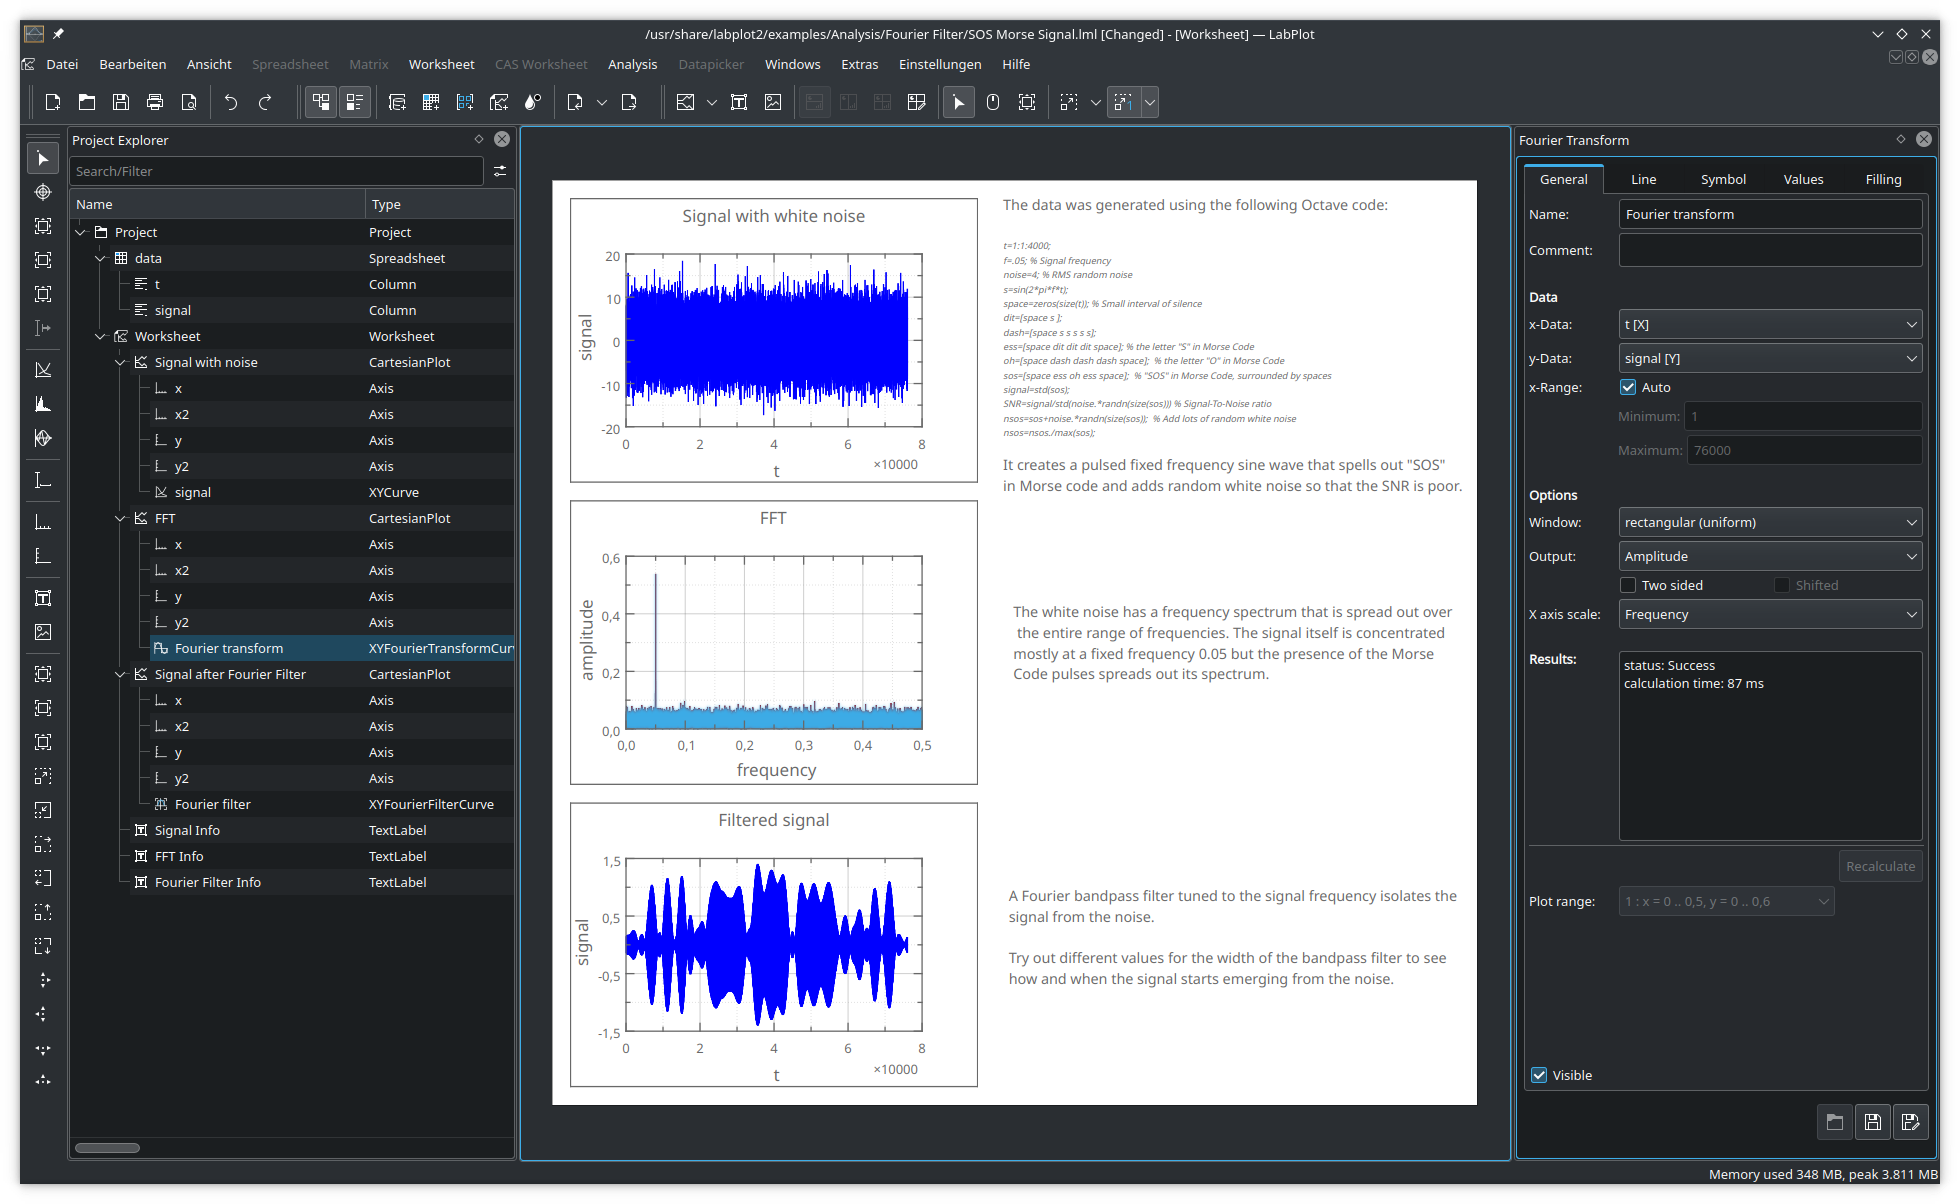
Reliable and easy Data Analysis and Statistics, no coding required!
-
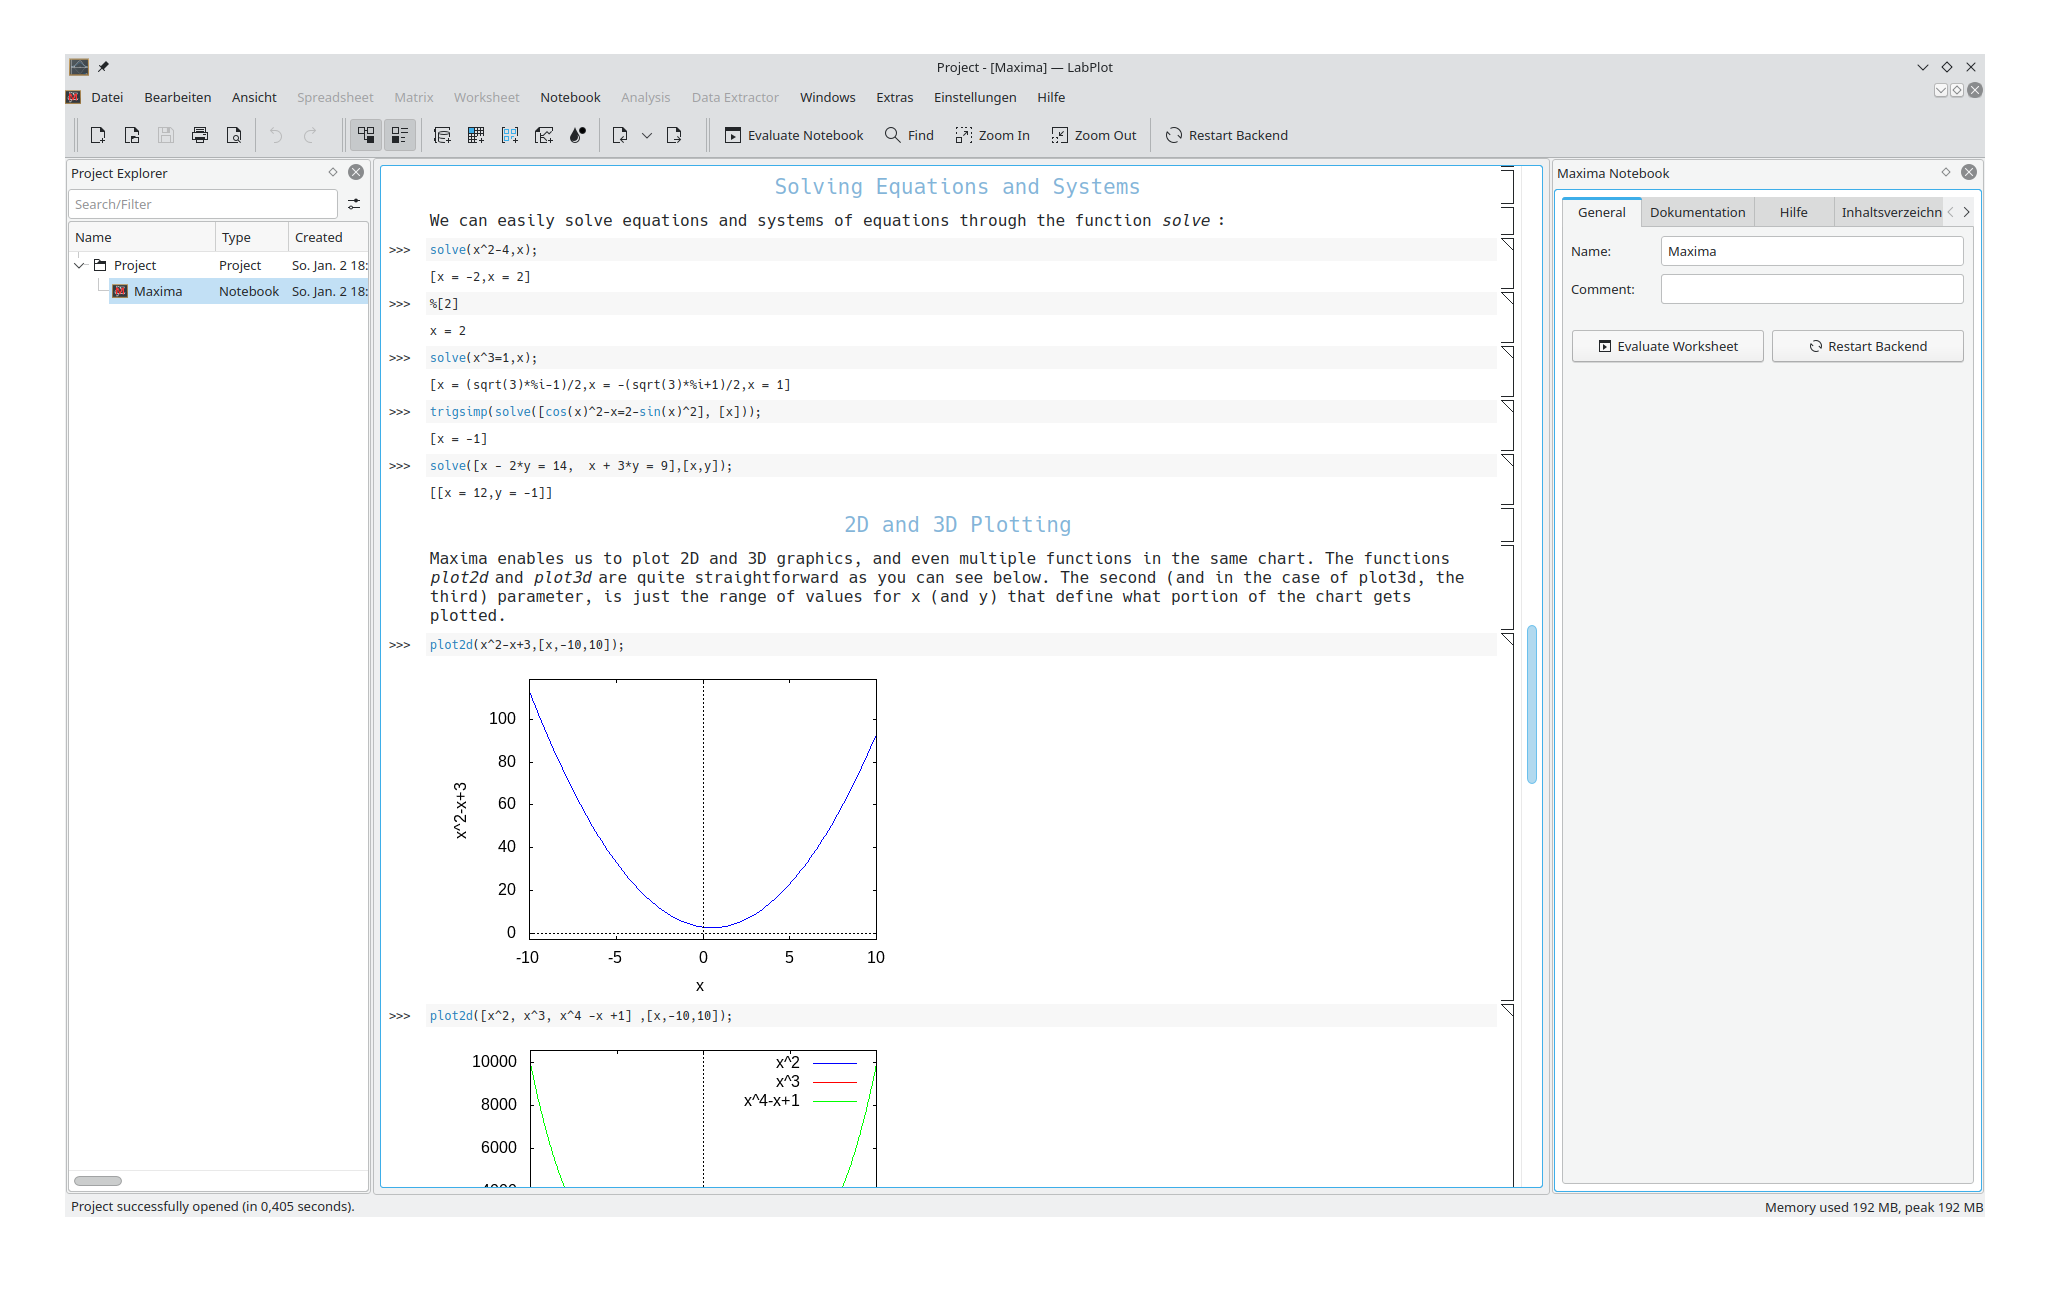
Intuitive and fast Computing with Interactive Notebooks
-
Effortless Data Extraction from plots and support for Live Data
-
Smooth Data Import and Export to and from multiple formats
-
Available for Windows, macOS, Linux and FreeBSD