Latinum
App details
About Latinum
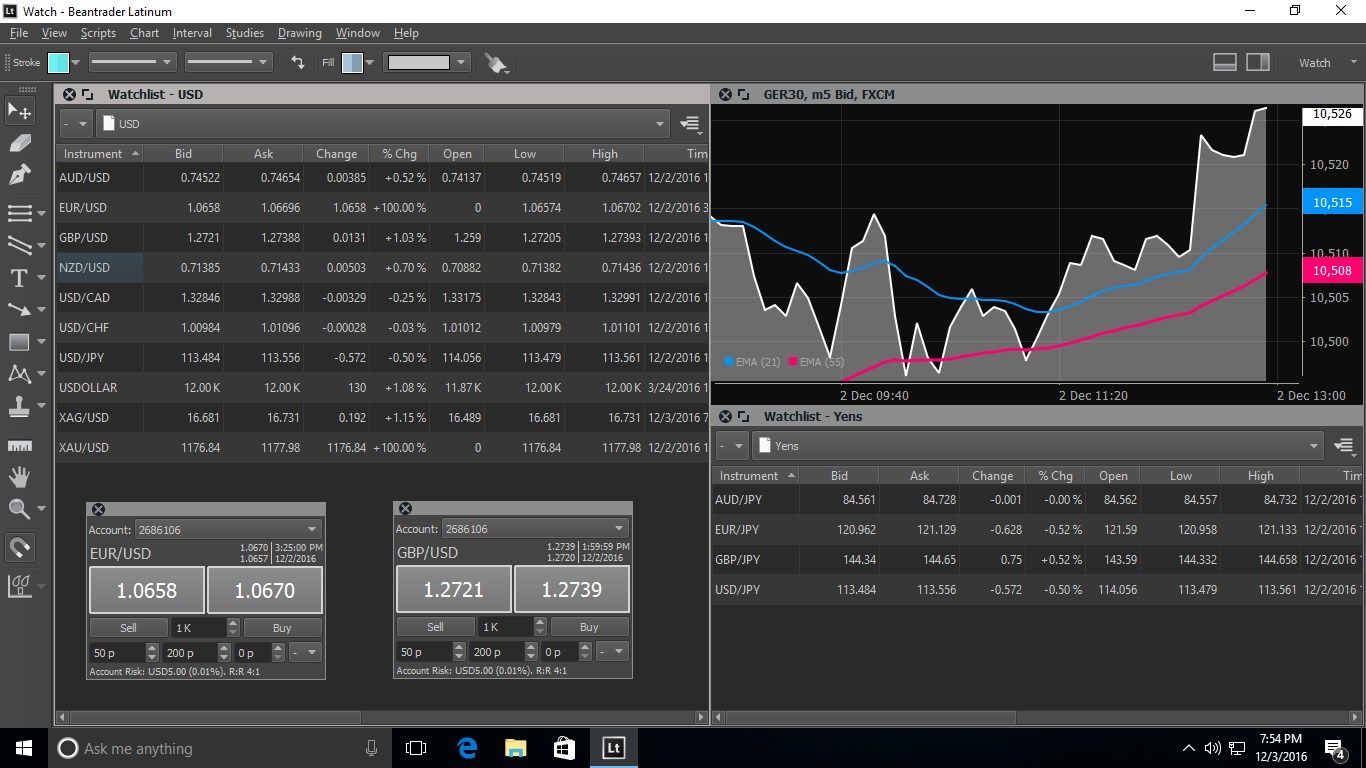
Welcome to Latinum, trading and technical analysis software, with streaming quotes for Forex, and CFDs, up to the second market data for US stocks, and EOD data for international stocks.
You can also chart Bitcoin and other cryptocurrencies using market data provided by Binance, GDAX, Bitfinex, and more than 20 other exchanges.
NEW! You can now view the order books and trade feeds for many (not all) of the supported crypto exchanges.
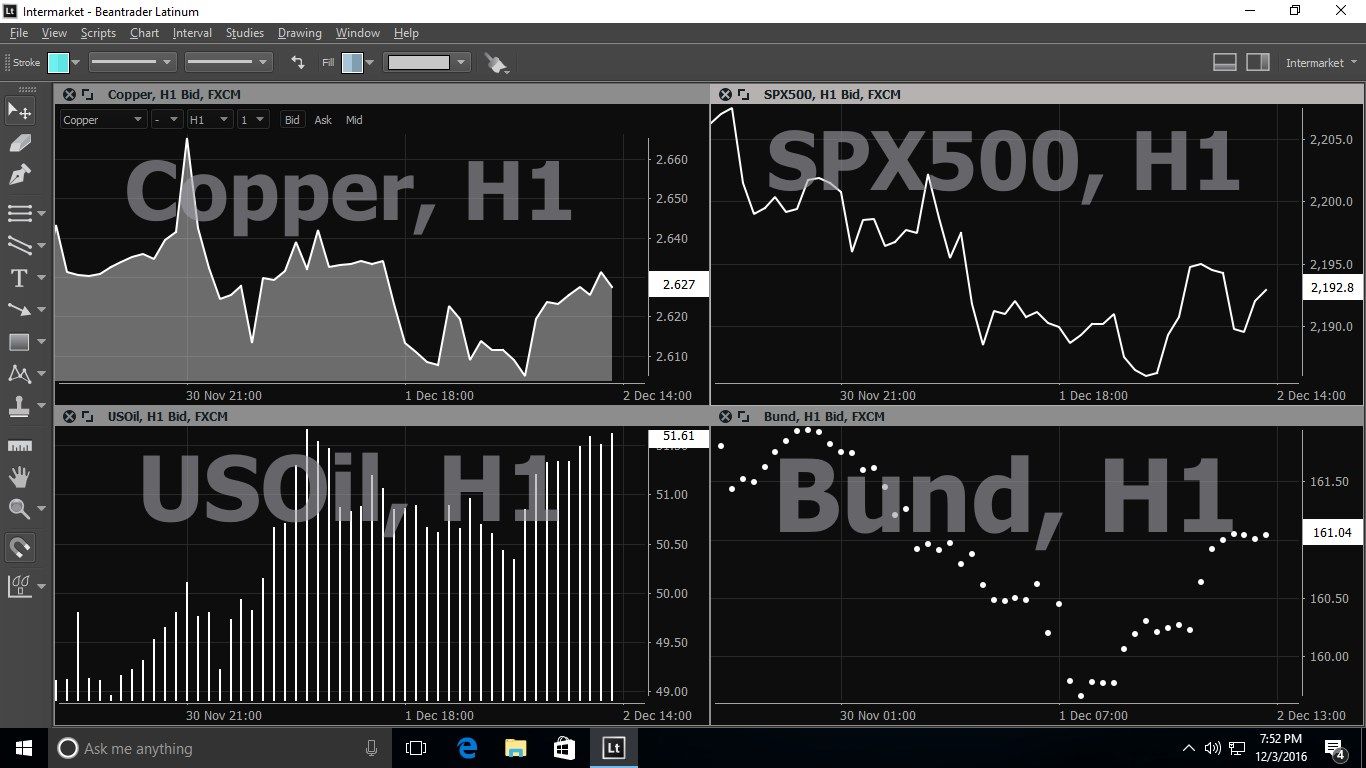
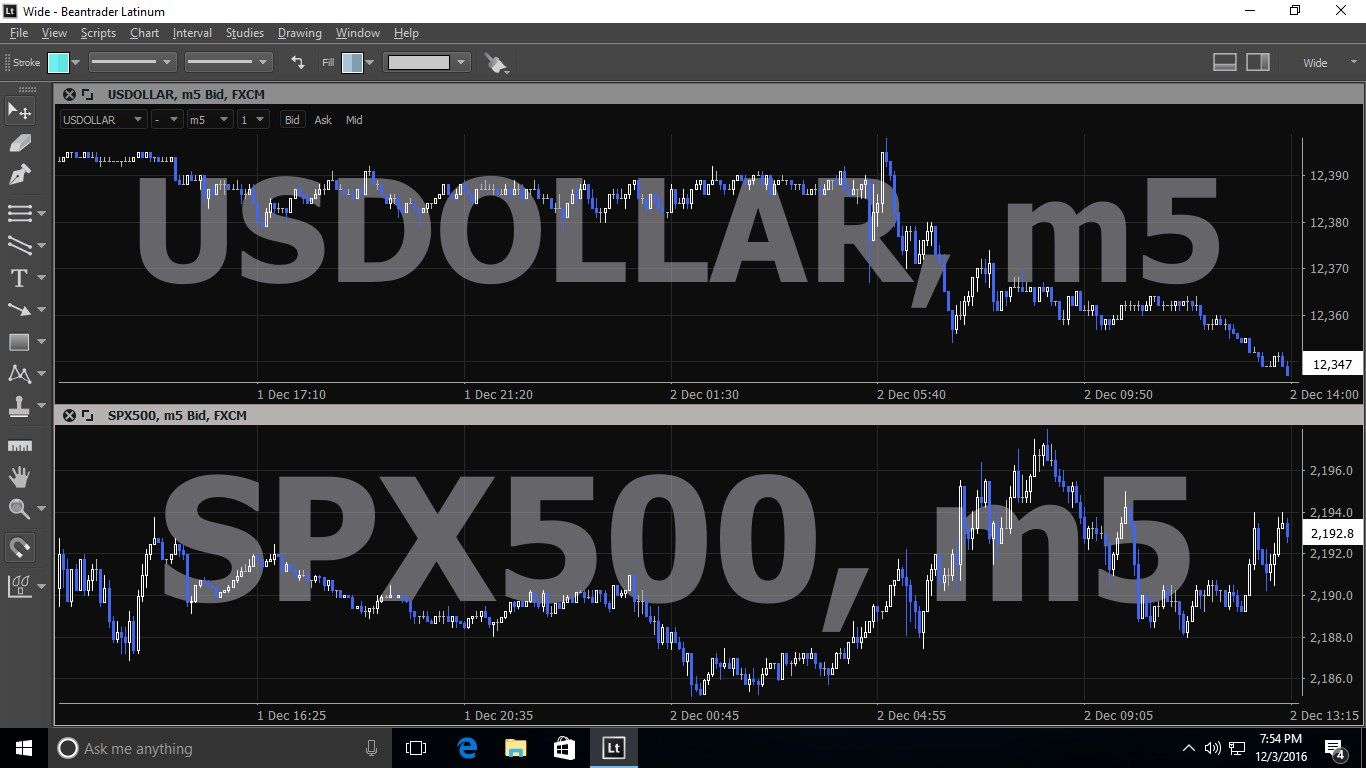
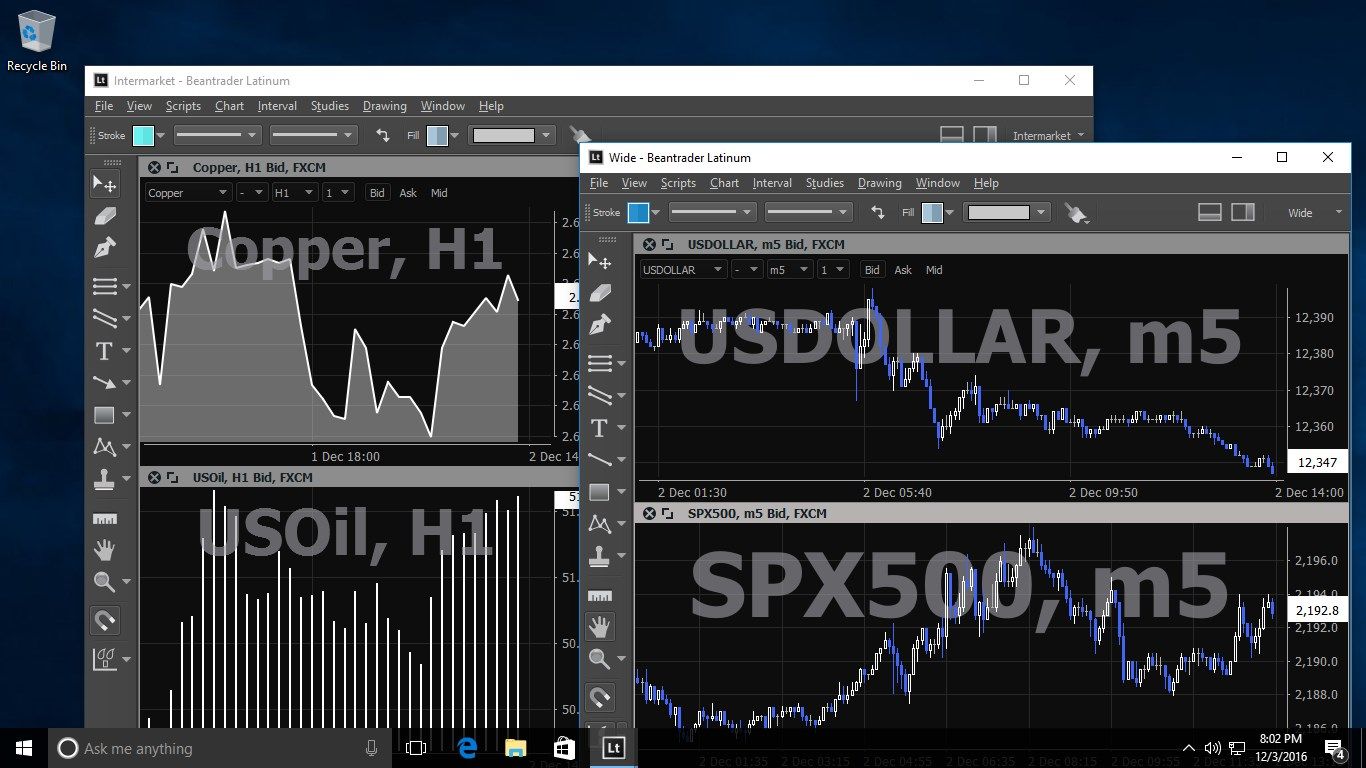
Latinum support over a dozen regular time-based chart types; Candlestick, HLC (High-Low-Close), Heiken-Ashi, OHLC (Open-High-Low-Close), Step, Dot, Line, Histogram, Area, Candlestick Trend, Invisible, Hollow Candlestick, HL (High-Low), Colored Line, and Real Body.
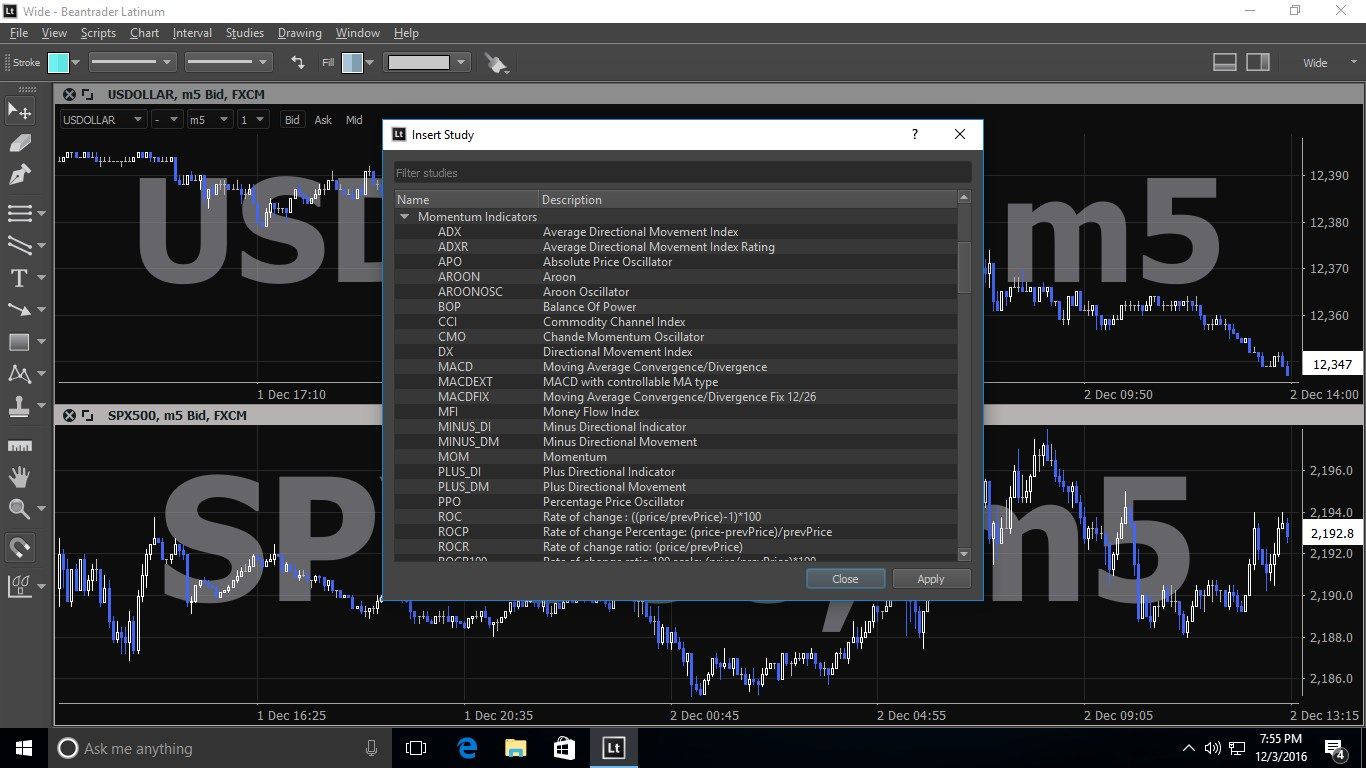
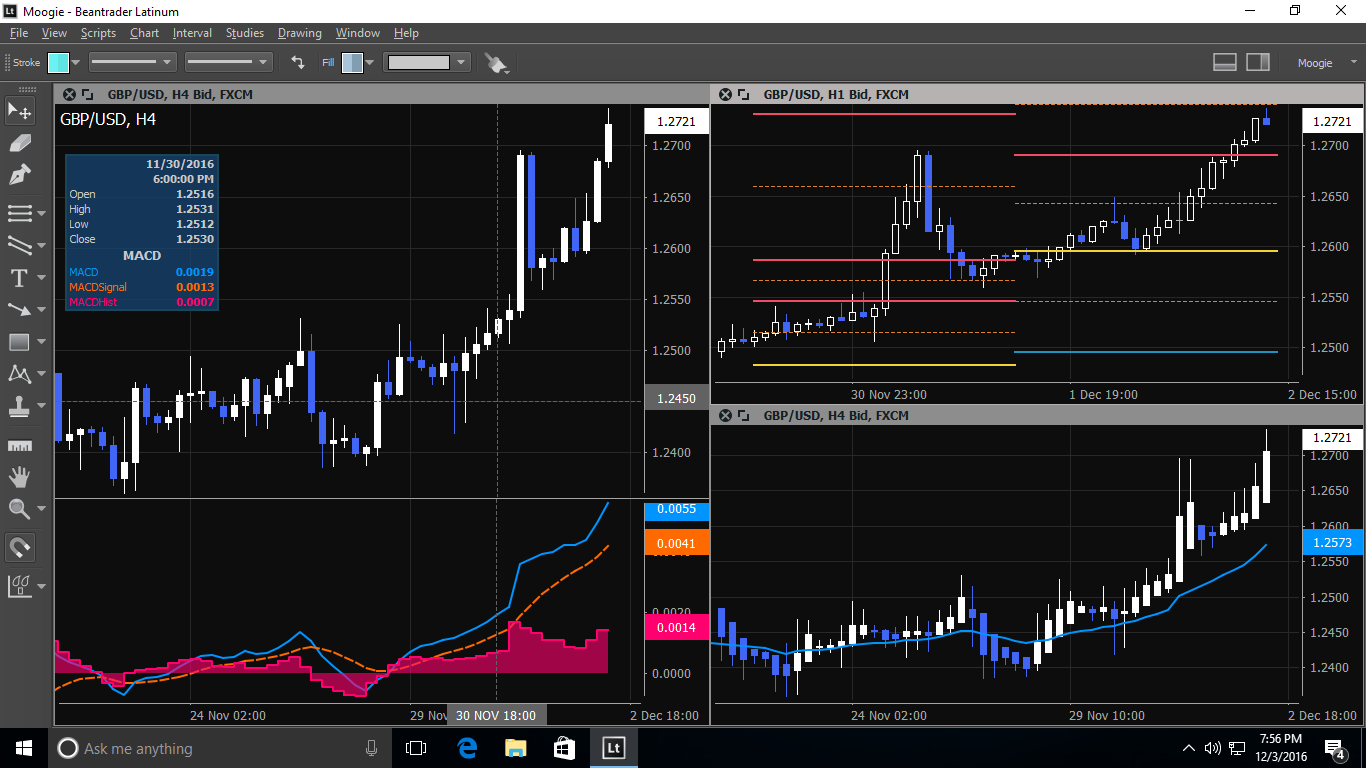
Includes over 200 indicators such as ADX, MACD, RSI, Stochastic, Bollinger Bands. Also, contains over 60 candlestick pattern recognition studies such as Engulfing Pattern, Hammer, and Three Black Crows.
Supports intraday data intervals from 5 second to 8 hours, along with daily, weekly, monthly, quarterly, and yearly intervals. Minute is the smallest interval for stocks/crypto.
Select your desired price field to plot, Bid price, Ask price, or Mid price. Only Last price is available for stocks/crypto.
Customize how you want your candles built, choose from Open-Equals-Previous-Close or Open-Equals-First-Tick.
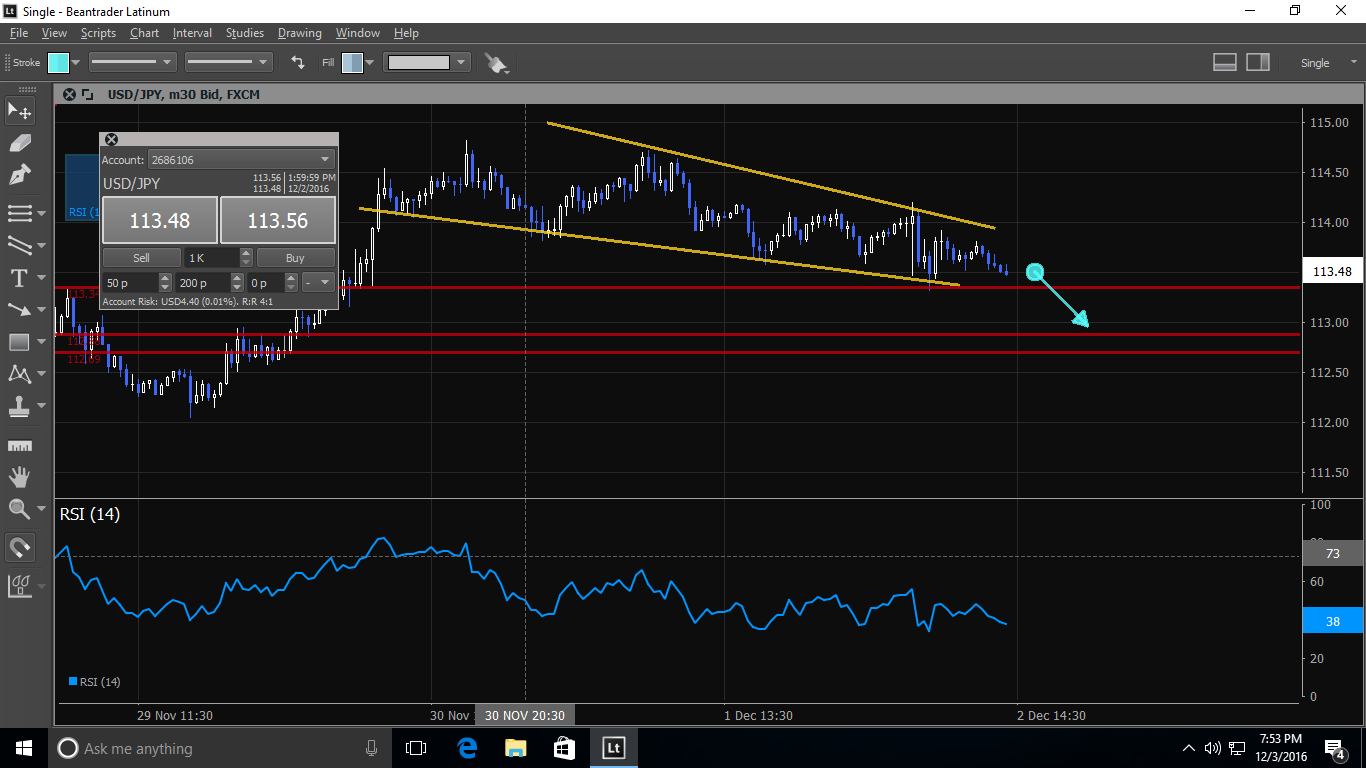
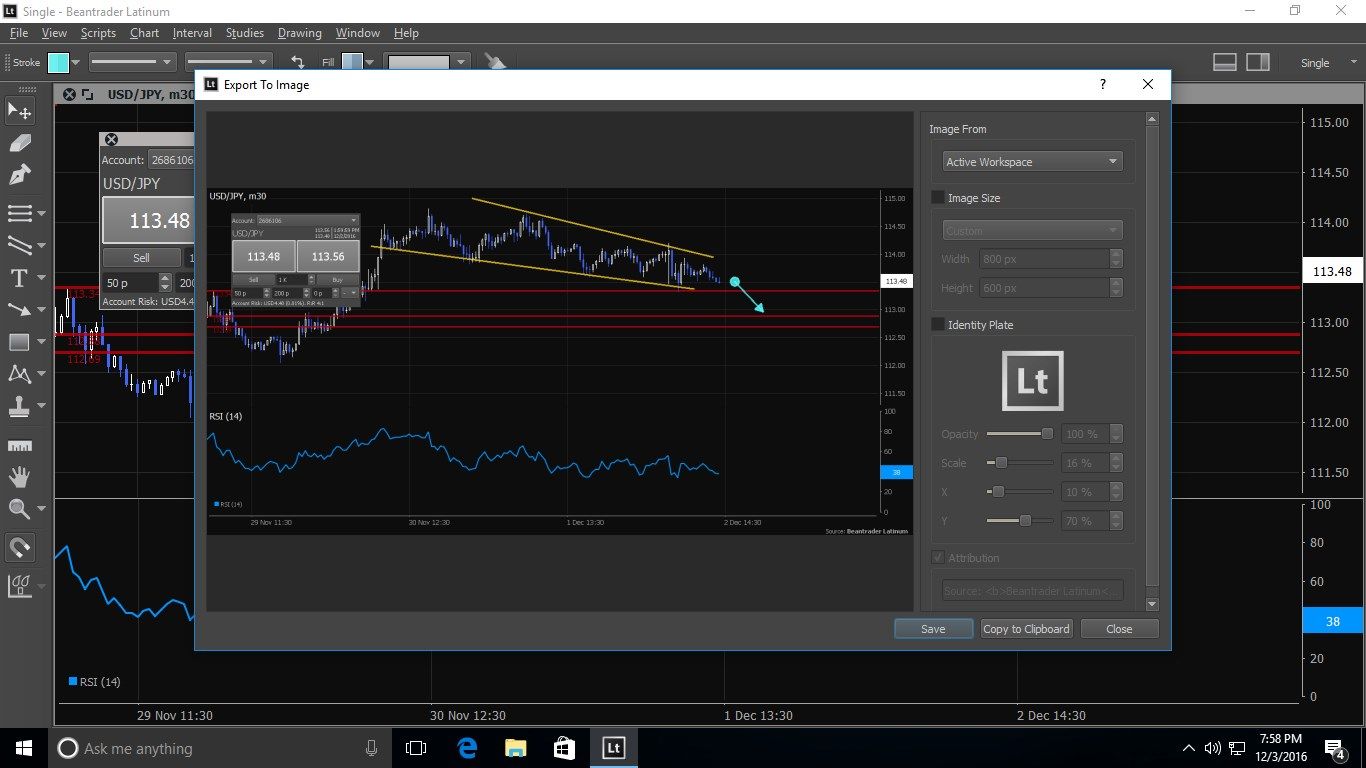
Draw rectangles, circles, triangles. Draw trend lines, horizontal lines, vertical lines, fib lines, quadrant lines, cycle lines, or channel lines. Draw ABCD, XABCD, Elliot Impulse and Corrective wave patterns. Draw custom patterns with the polyline or polygon tools.
Download and view FXCM trading history results, plot your results with visualizations for Account Activity, Cumulative Profit, Balance Change, Symbol Popularity, Duration to Profit, Trades Closed, and Winners and Losers.
Support for signing in using your cTrader and Alpaca trading accounts was recently added. Both these data feeds provide market data, additionally, Alpaca provides paper trading.
For trading, an FXCM (Real or Practice) account is required. Individuals who do not have a compatible account can register for a free practice account (demo account) from one of the supported brokers.
Please note, different data feeds and broker connections support different features. If you have any questions related to a features availability with a specific data feed please contact support. Trading is only available when connected to a compatible brokerage account. No trading is available for US stocks or cryptocurrencies.
Key features
-
View crypto price charts for more than 8000 symbols across 32 crypto exchanges
-
View streaming order books and trade events from 12 crypto exchanges
-
View US and international stocks price charts using data provided by IEX
-
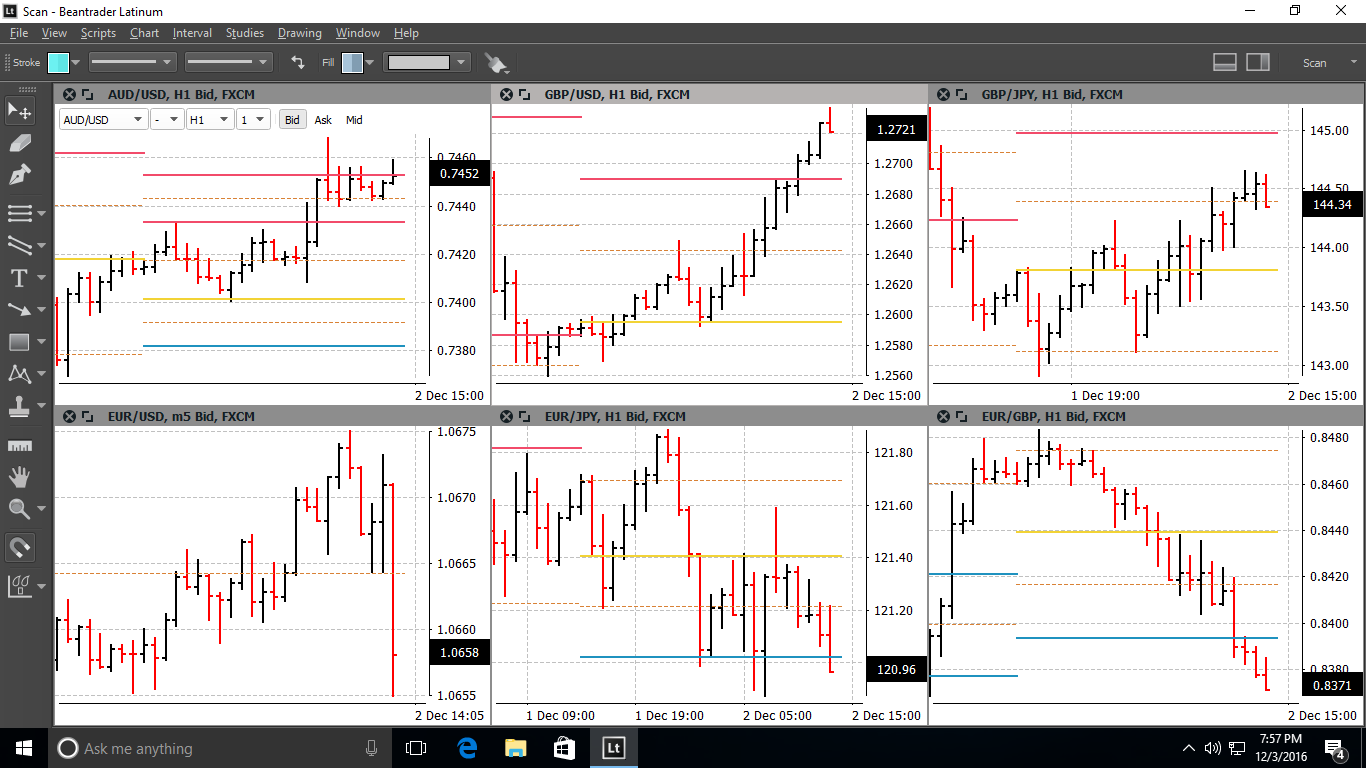
View Forex price charts using data provided by your FXCM or cTrader accounts
-
View CoinGecko price data for over 6600 crypto assets in 60 different currencies