
MCarloRisk3D
App details
About MCarloRisk3D
Monte Carlo price/probability forecaster with extensive backtesting and tuning, for stocks & crypto.
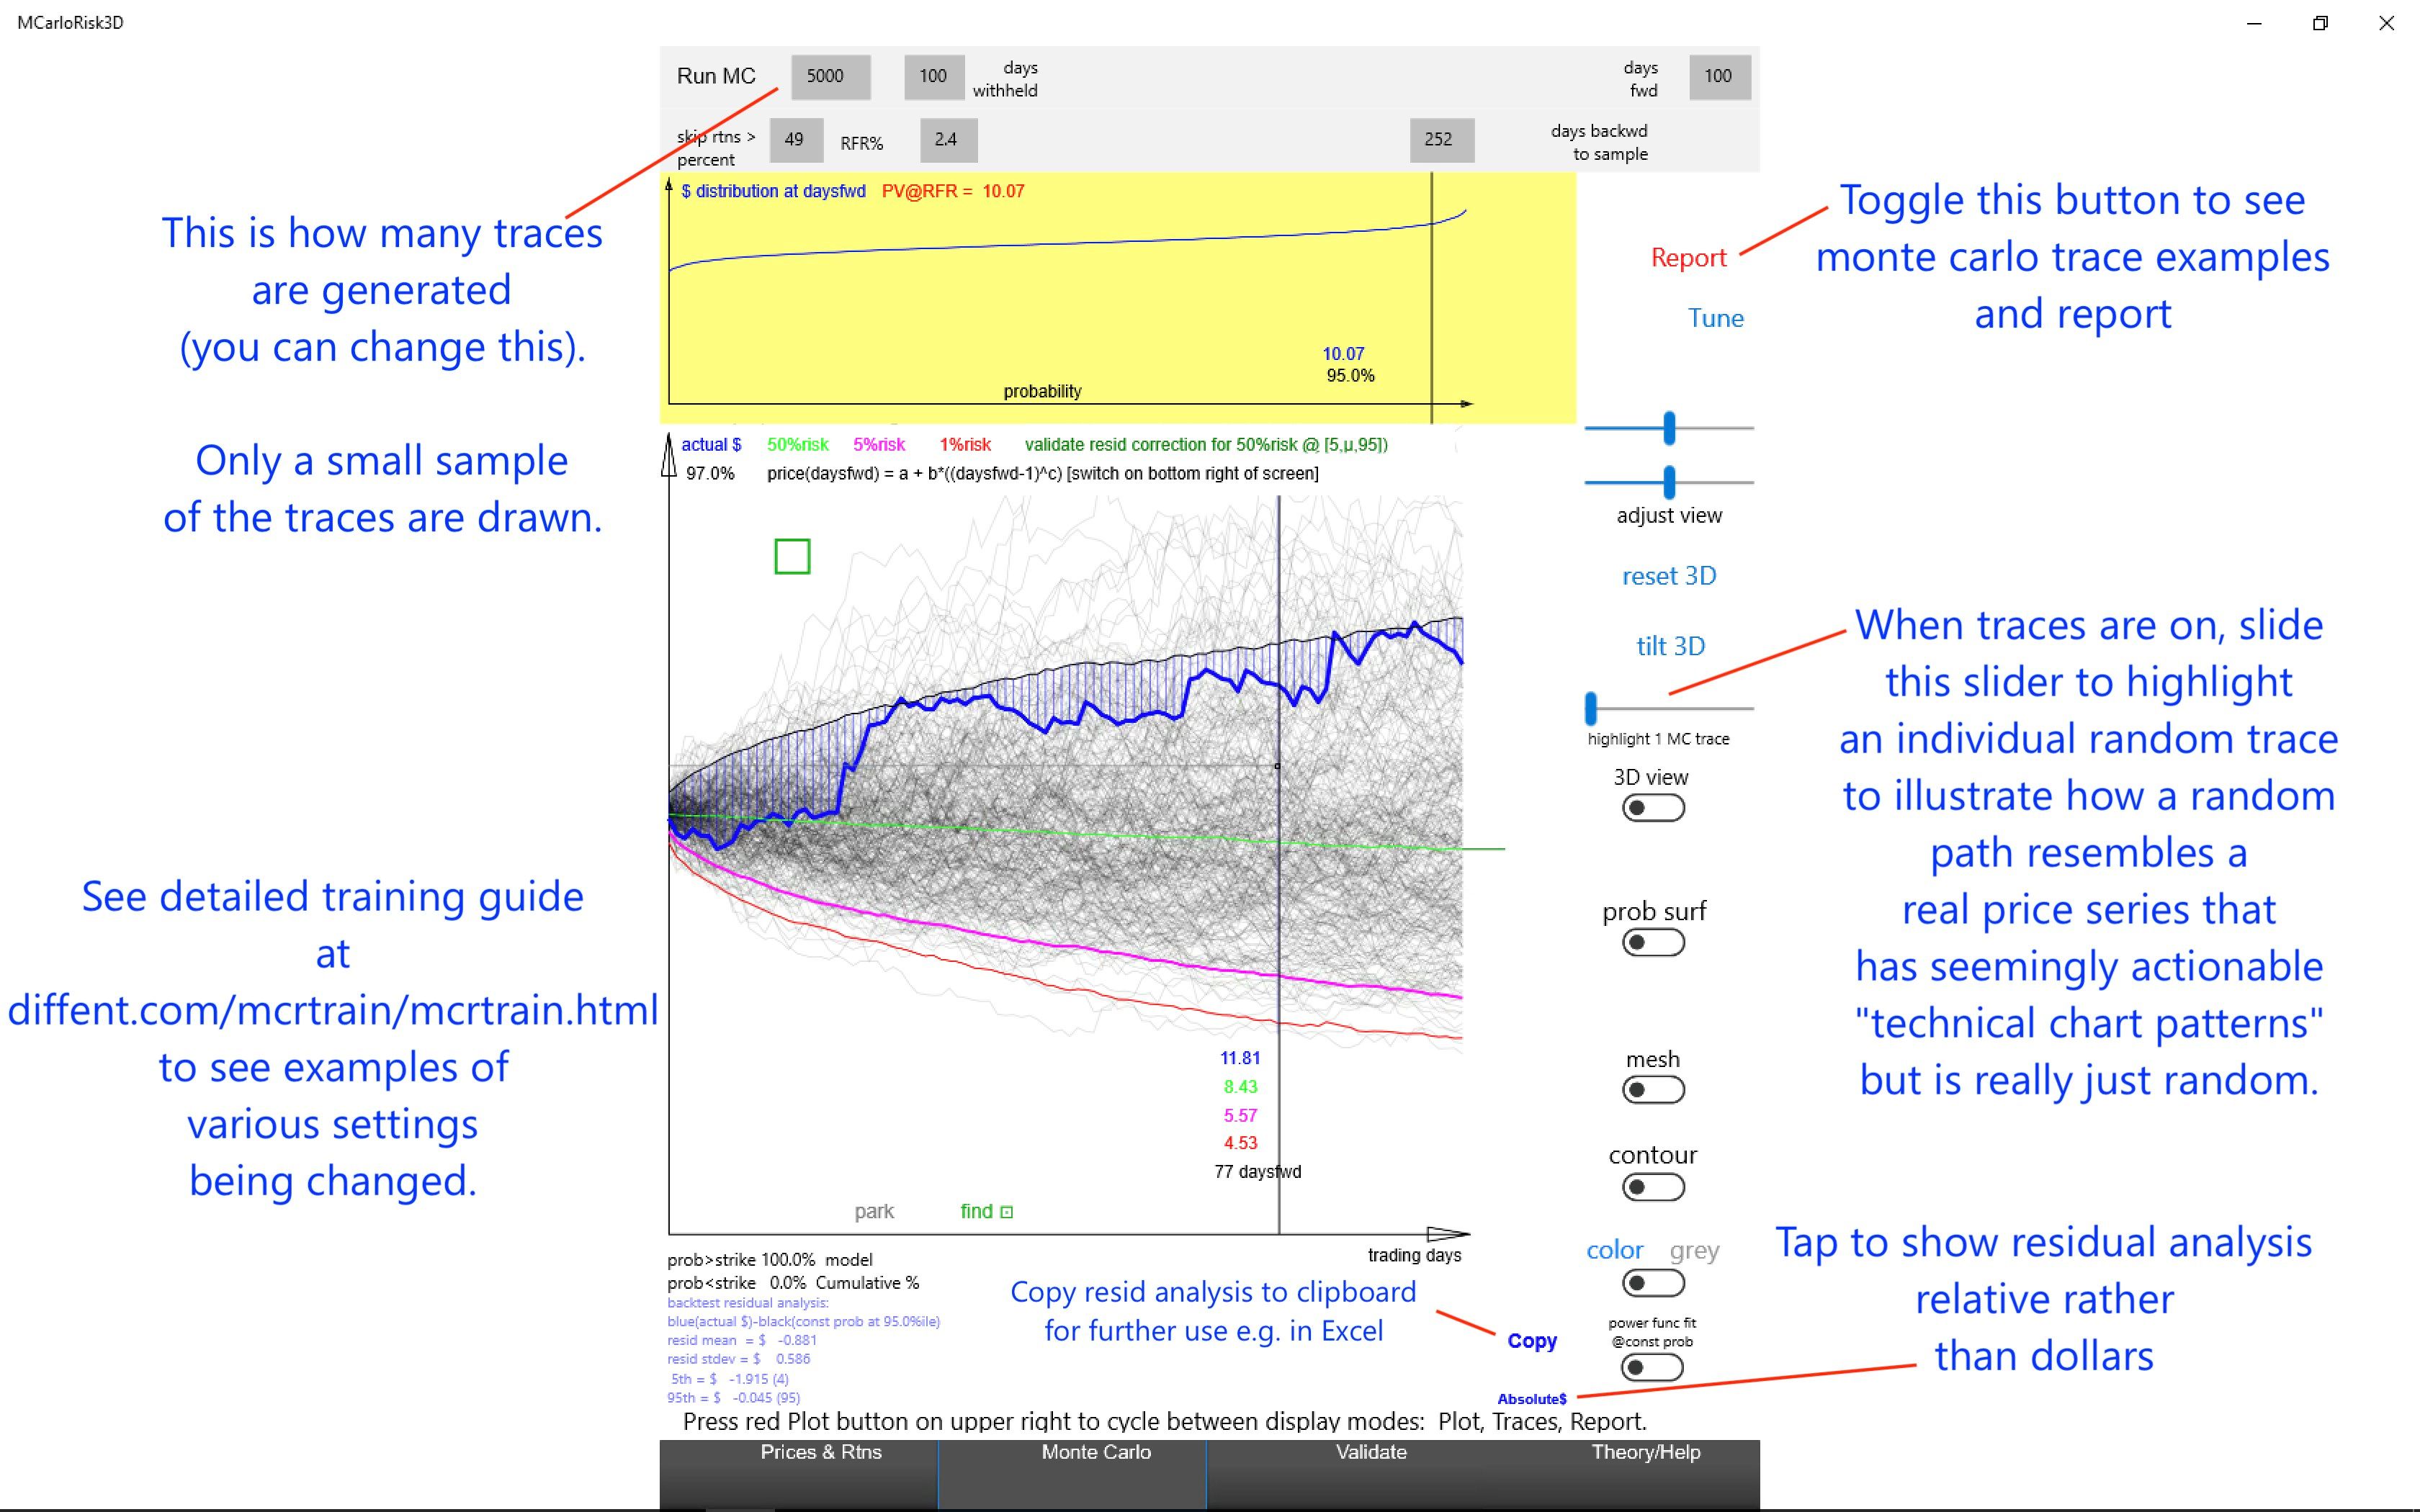
Resamples from empirical daily returns to generate forward-in-time monte carlo paths (random walks), with user-adjustable long memory modifications such as serial resampling and fractional differencing.
No distribution shape assumptions are needed, works with the empirical (“as seen in history”) returns distribution. This is especially useful for new assets such as crypto or more exotic equities such as TSLA that may not conform to normal or lognormal returns assumptions, especially in shorter time periods.
Brownian motion becomes Empirical motion in this app, since we use an empirical distribution.
Similarly, fractional Brownian motion becomes fractional Empirical motion in this app, for one of the long memory options.
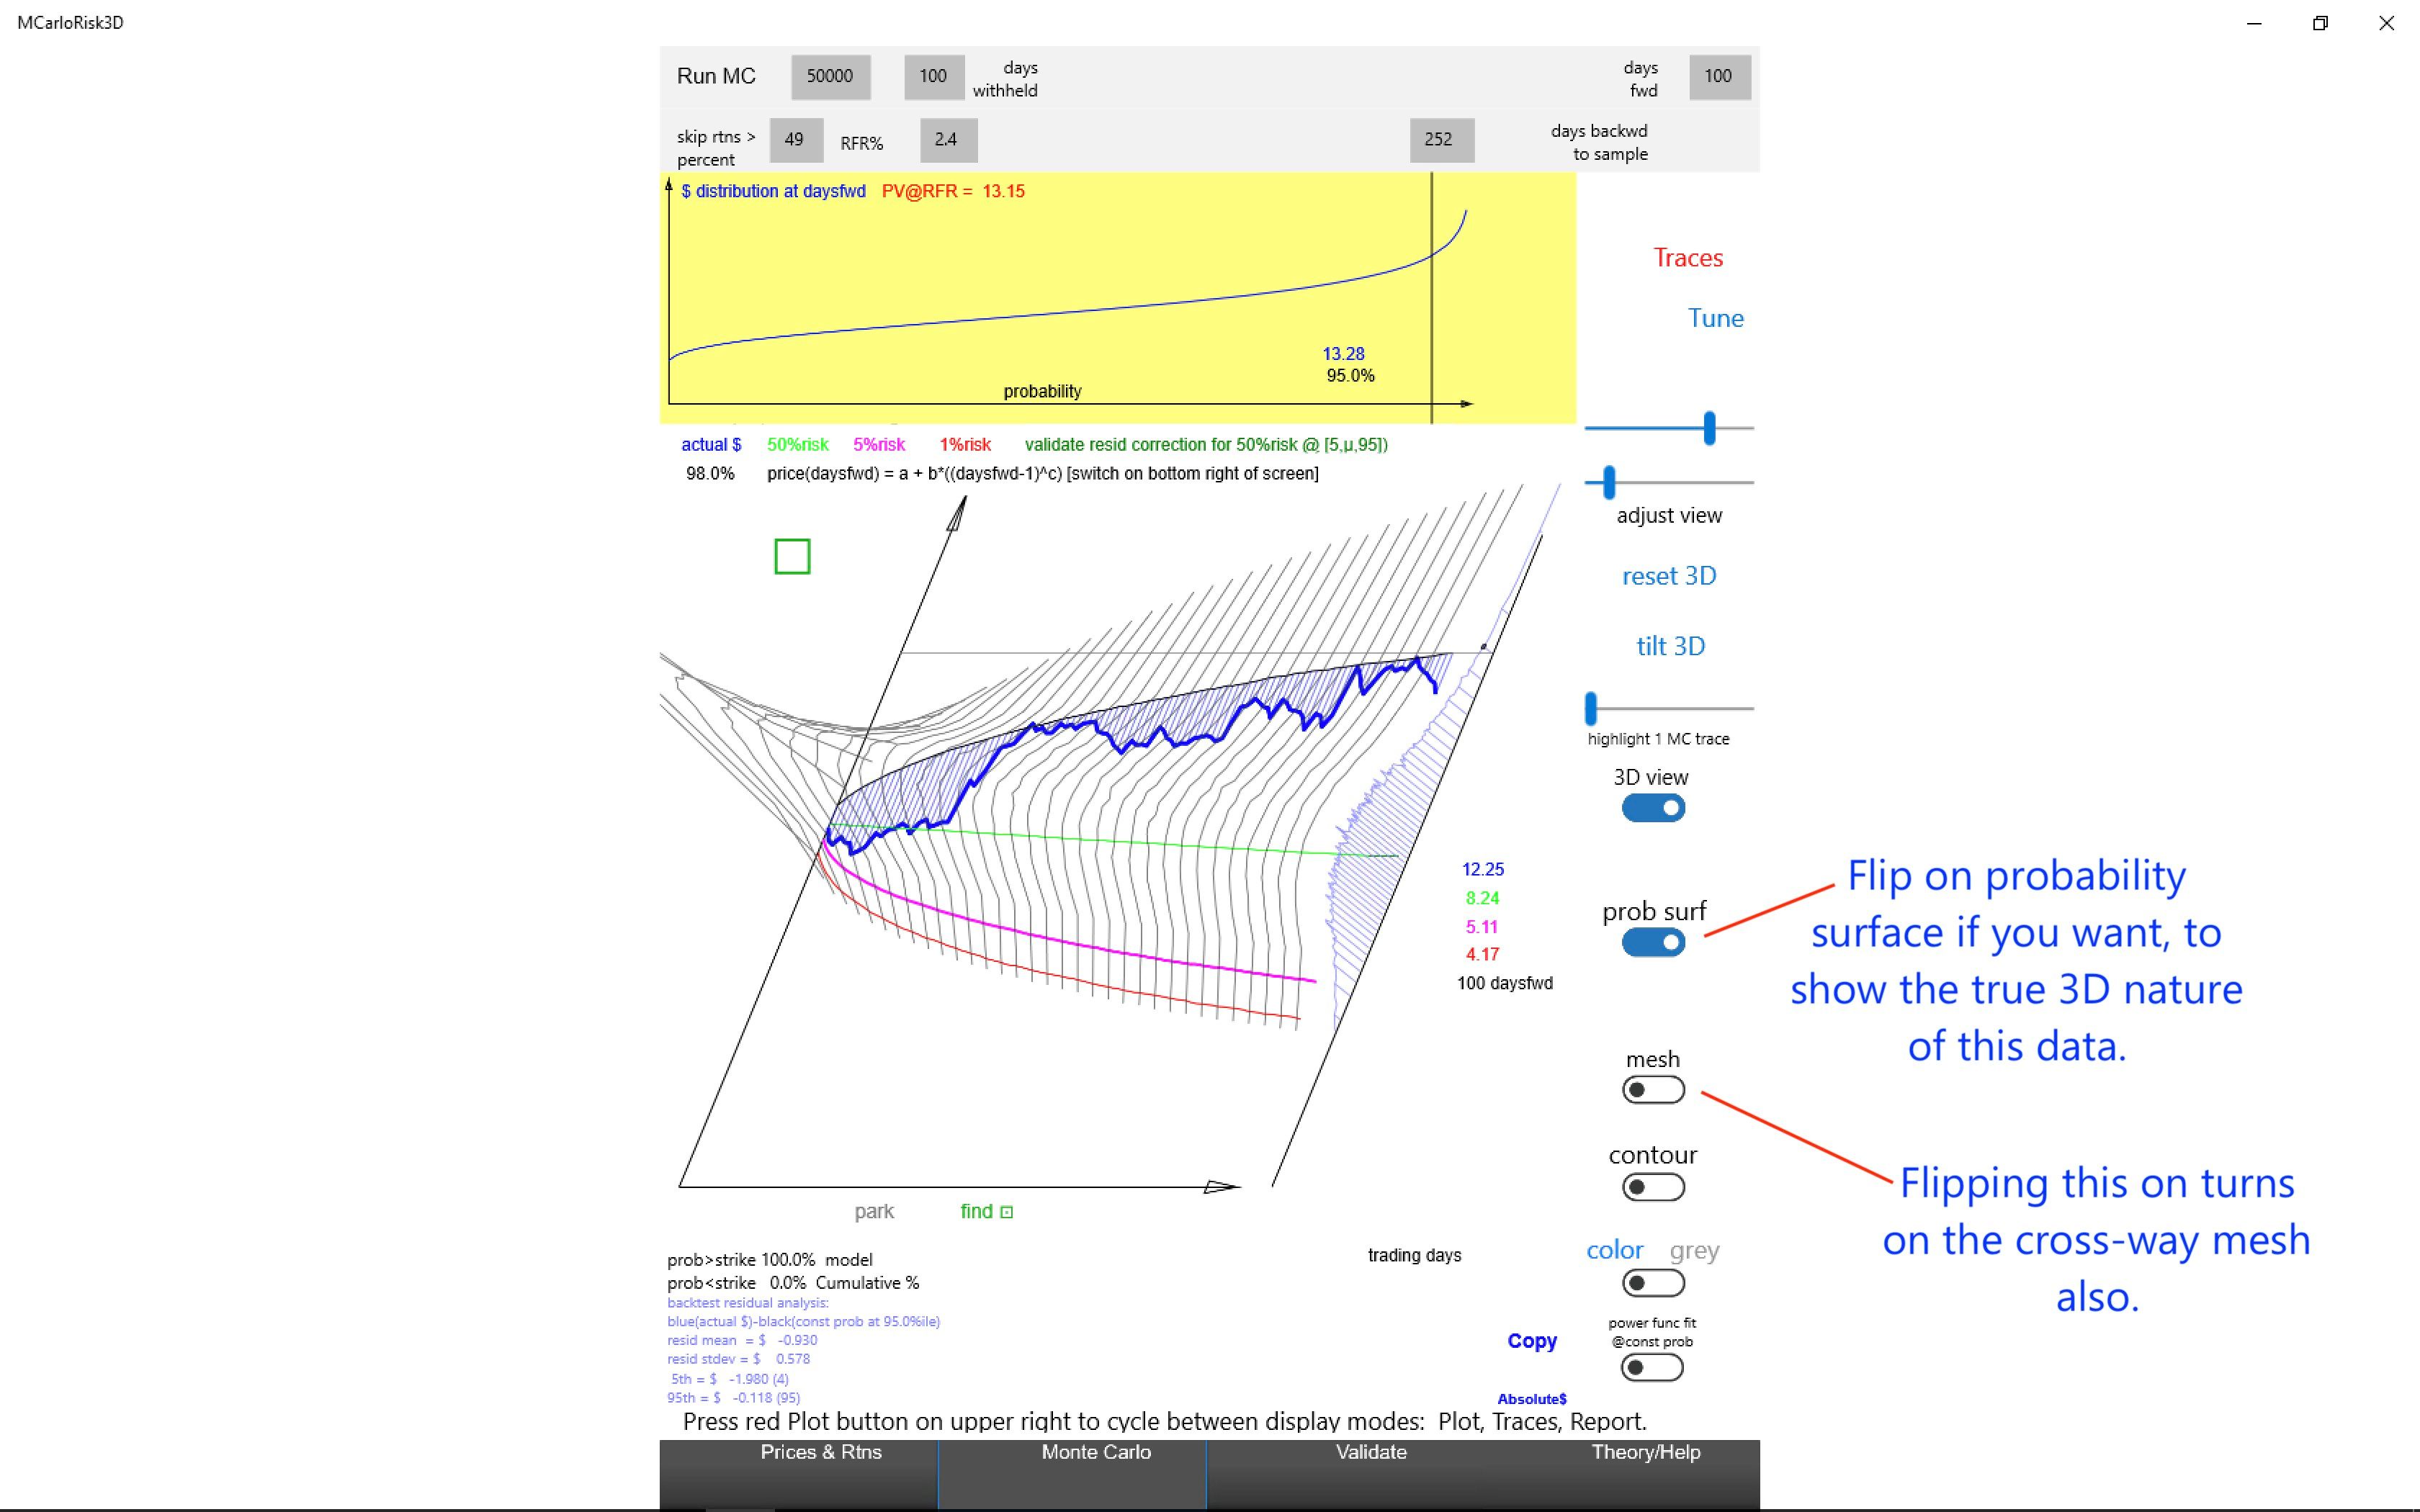
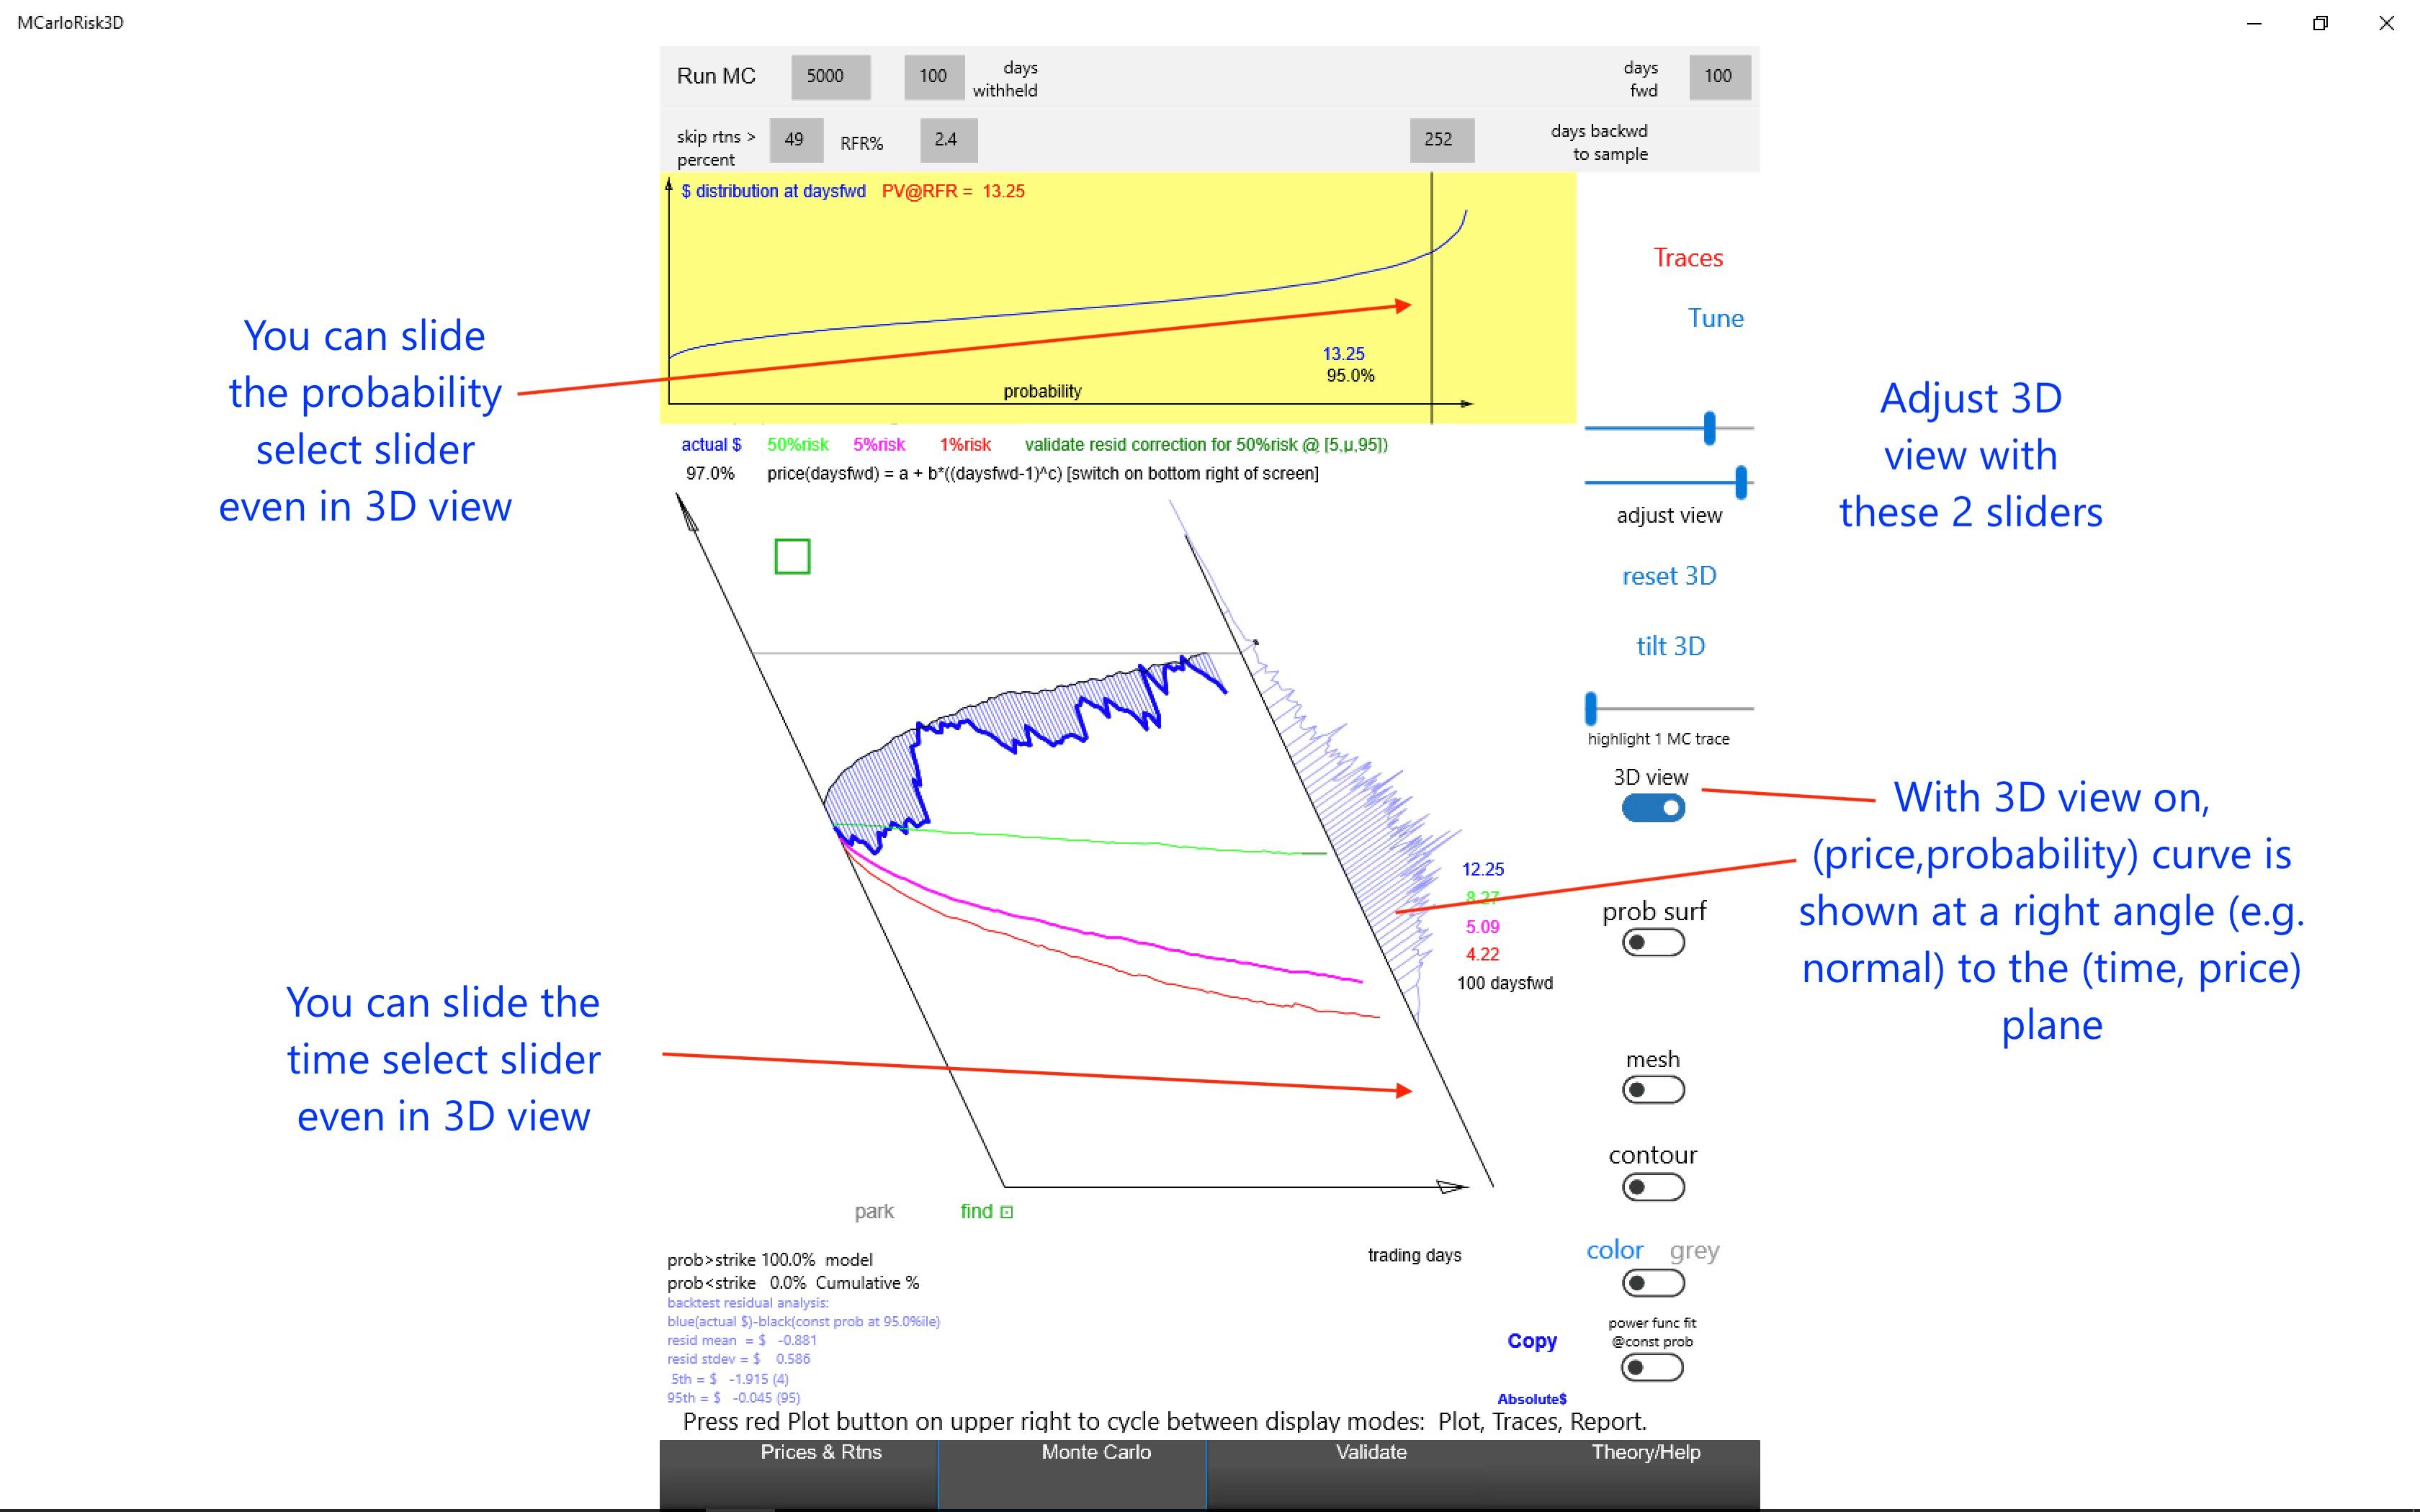
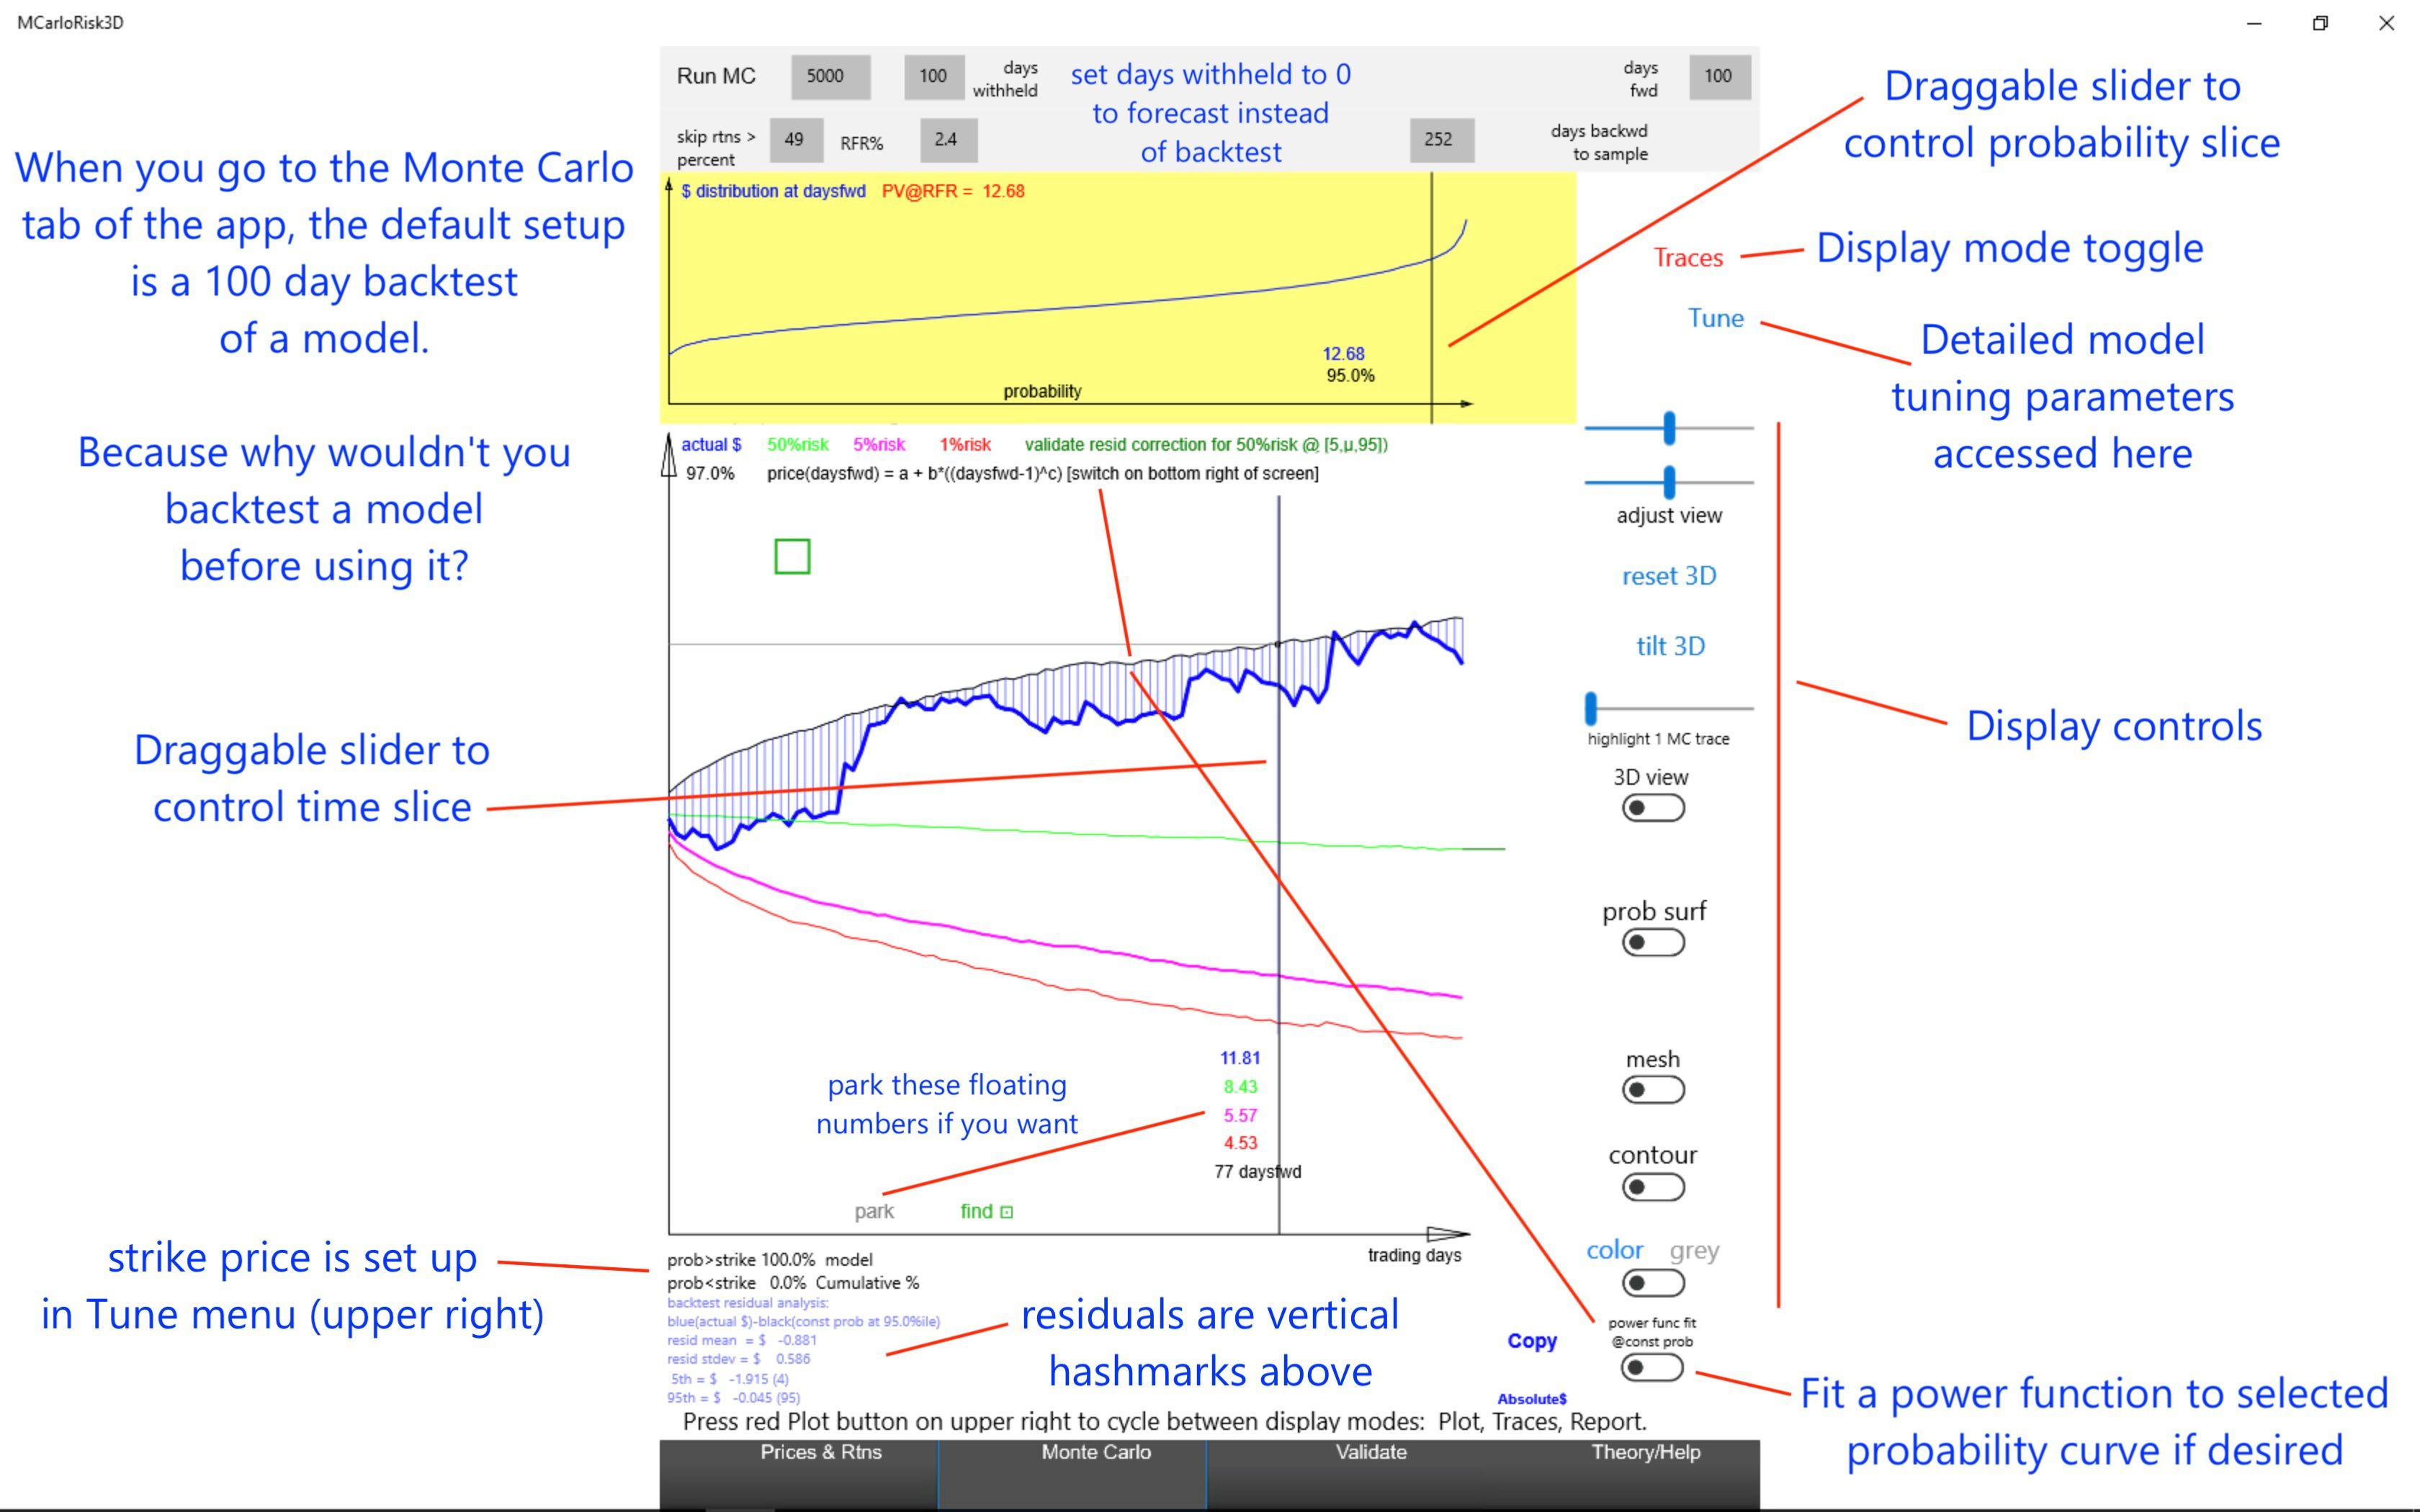
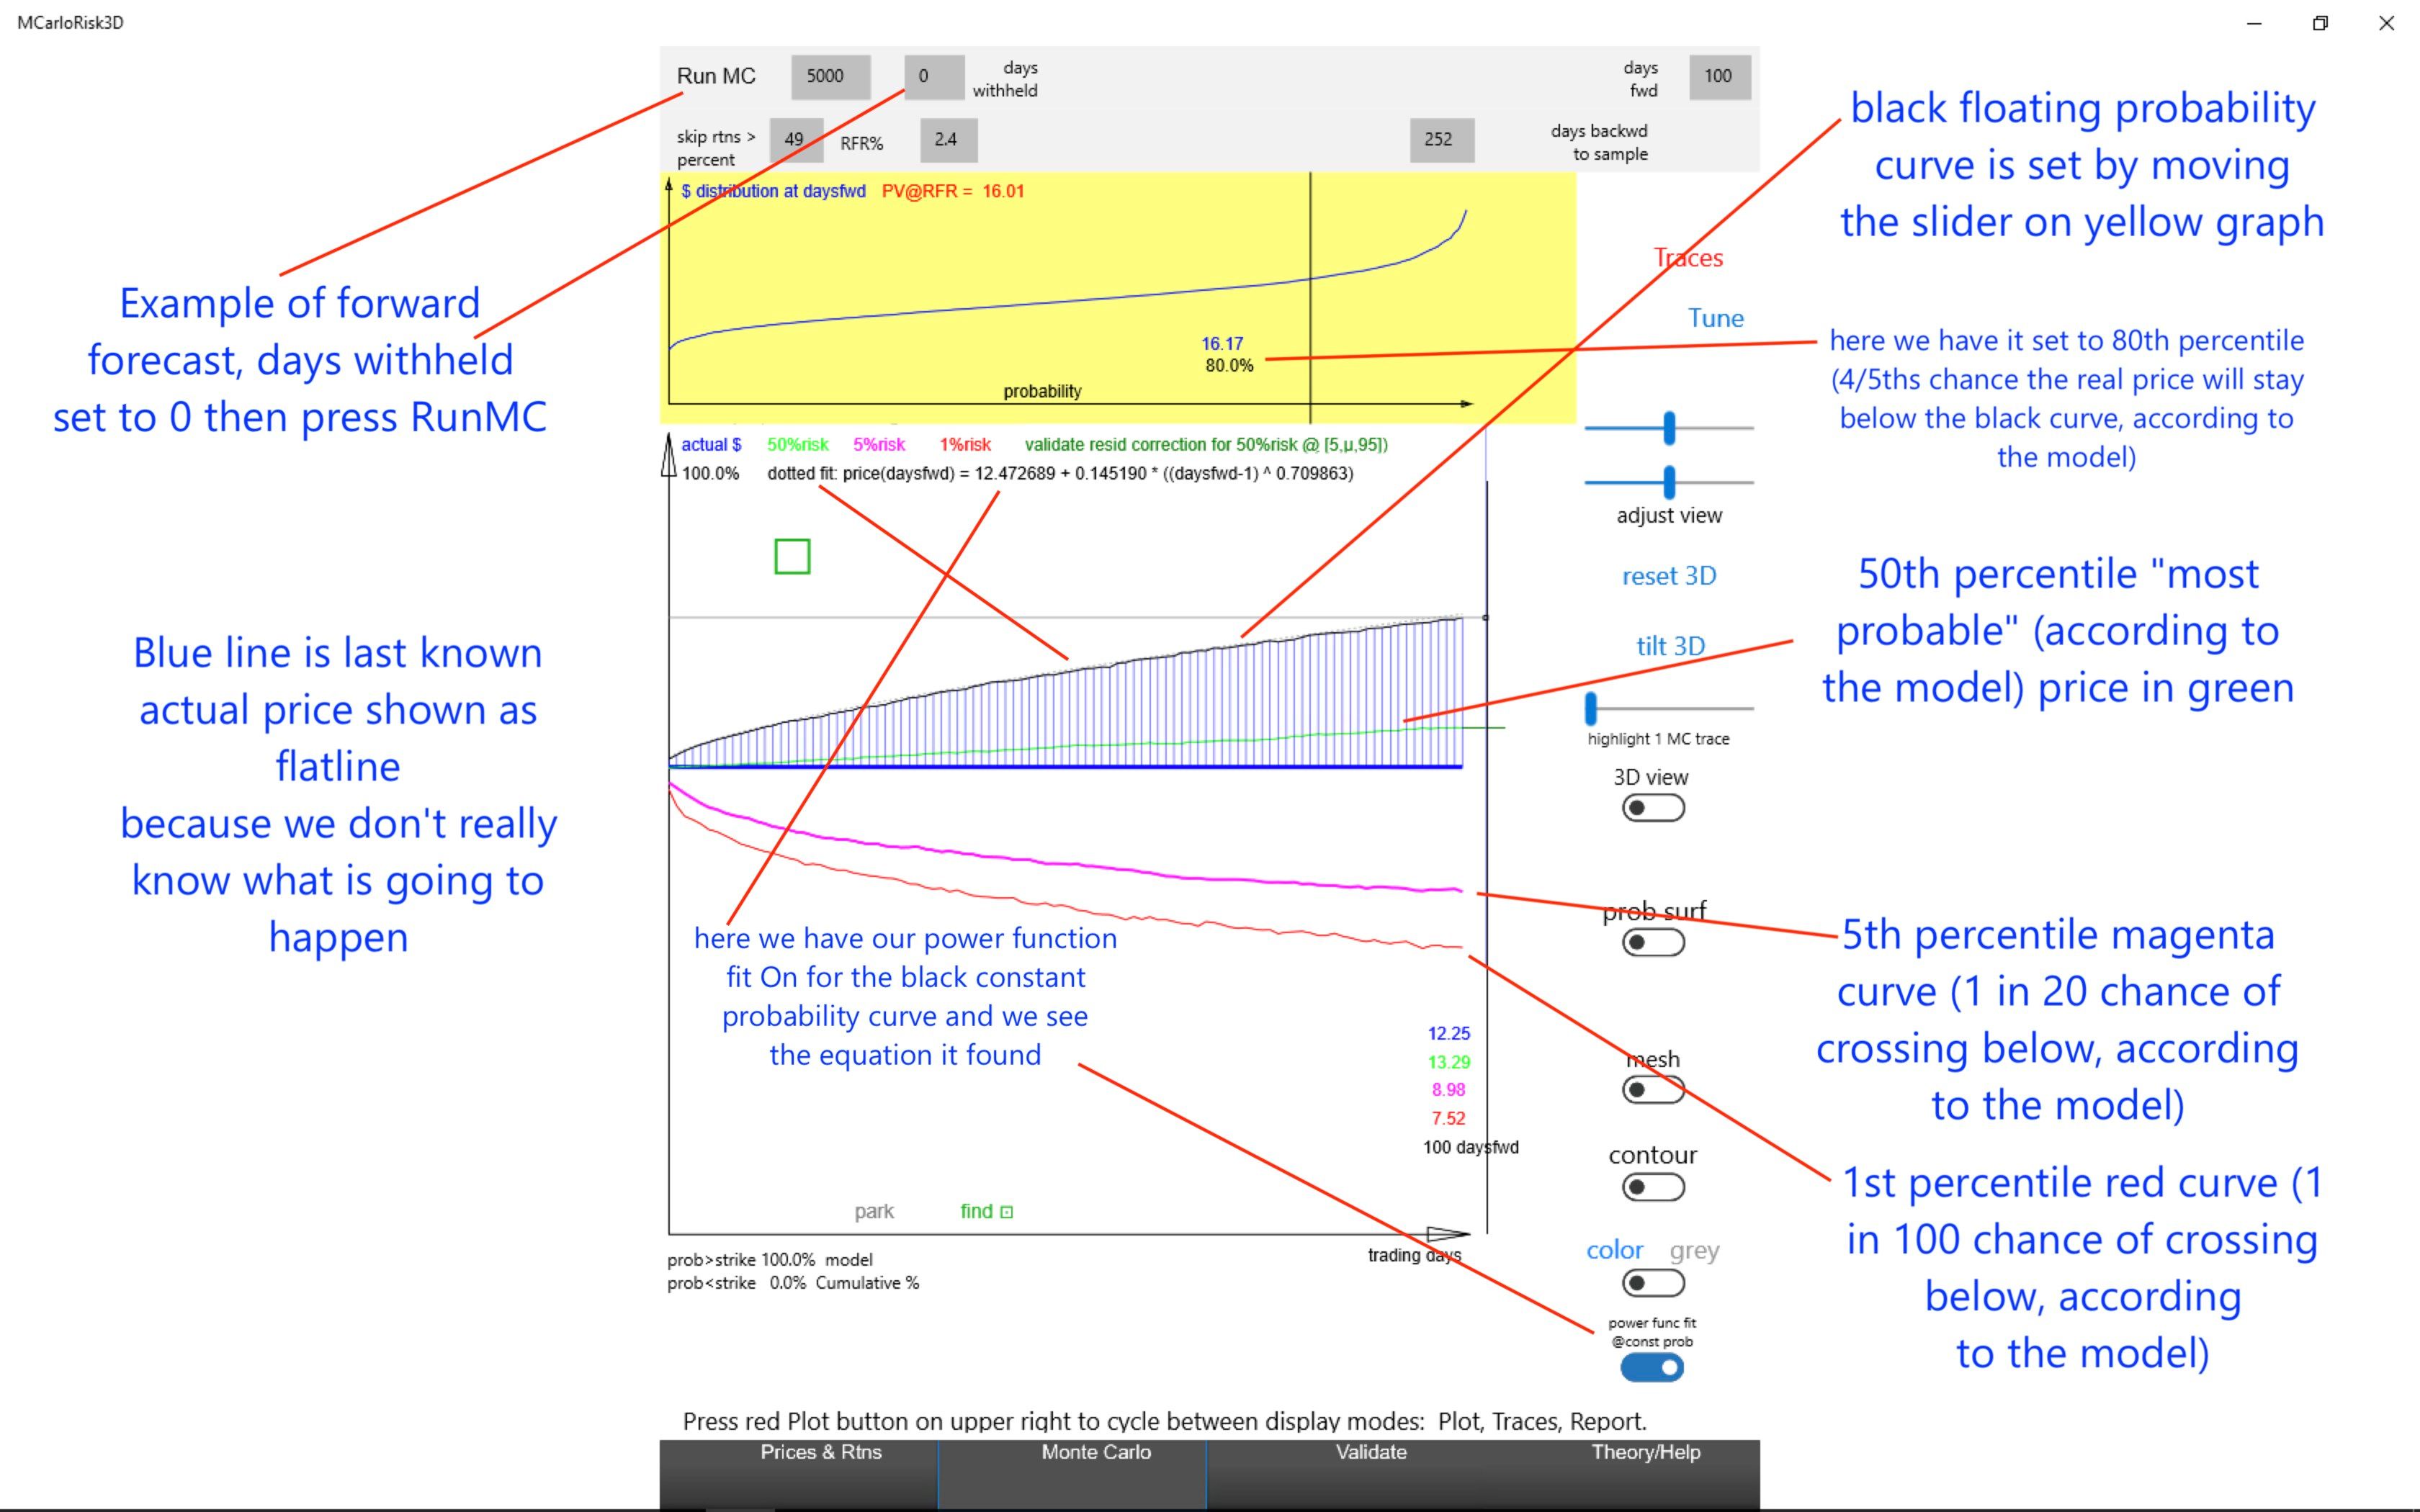
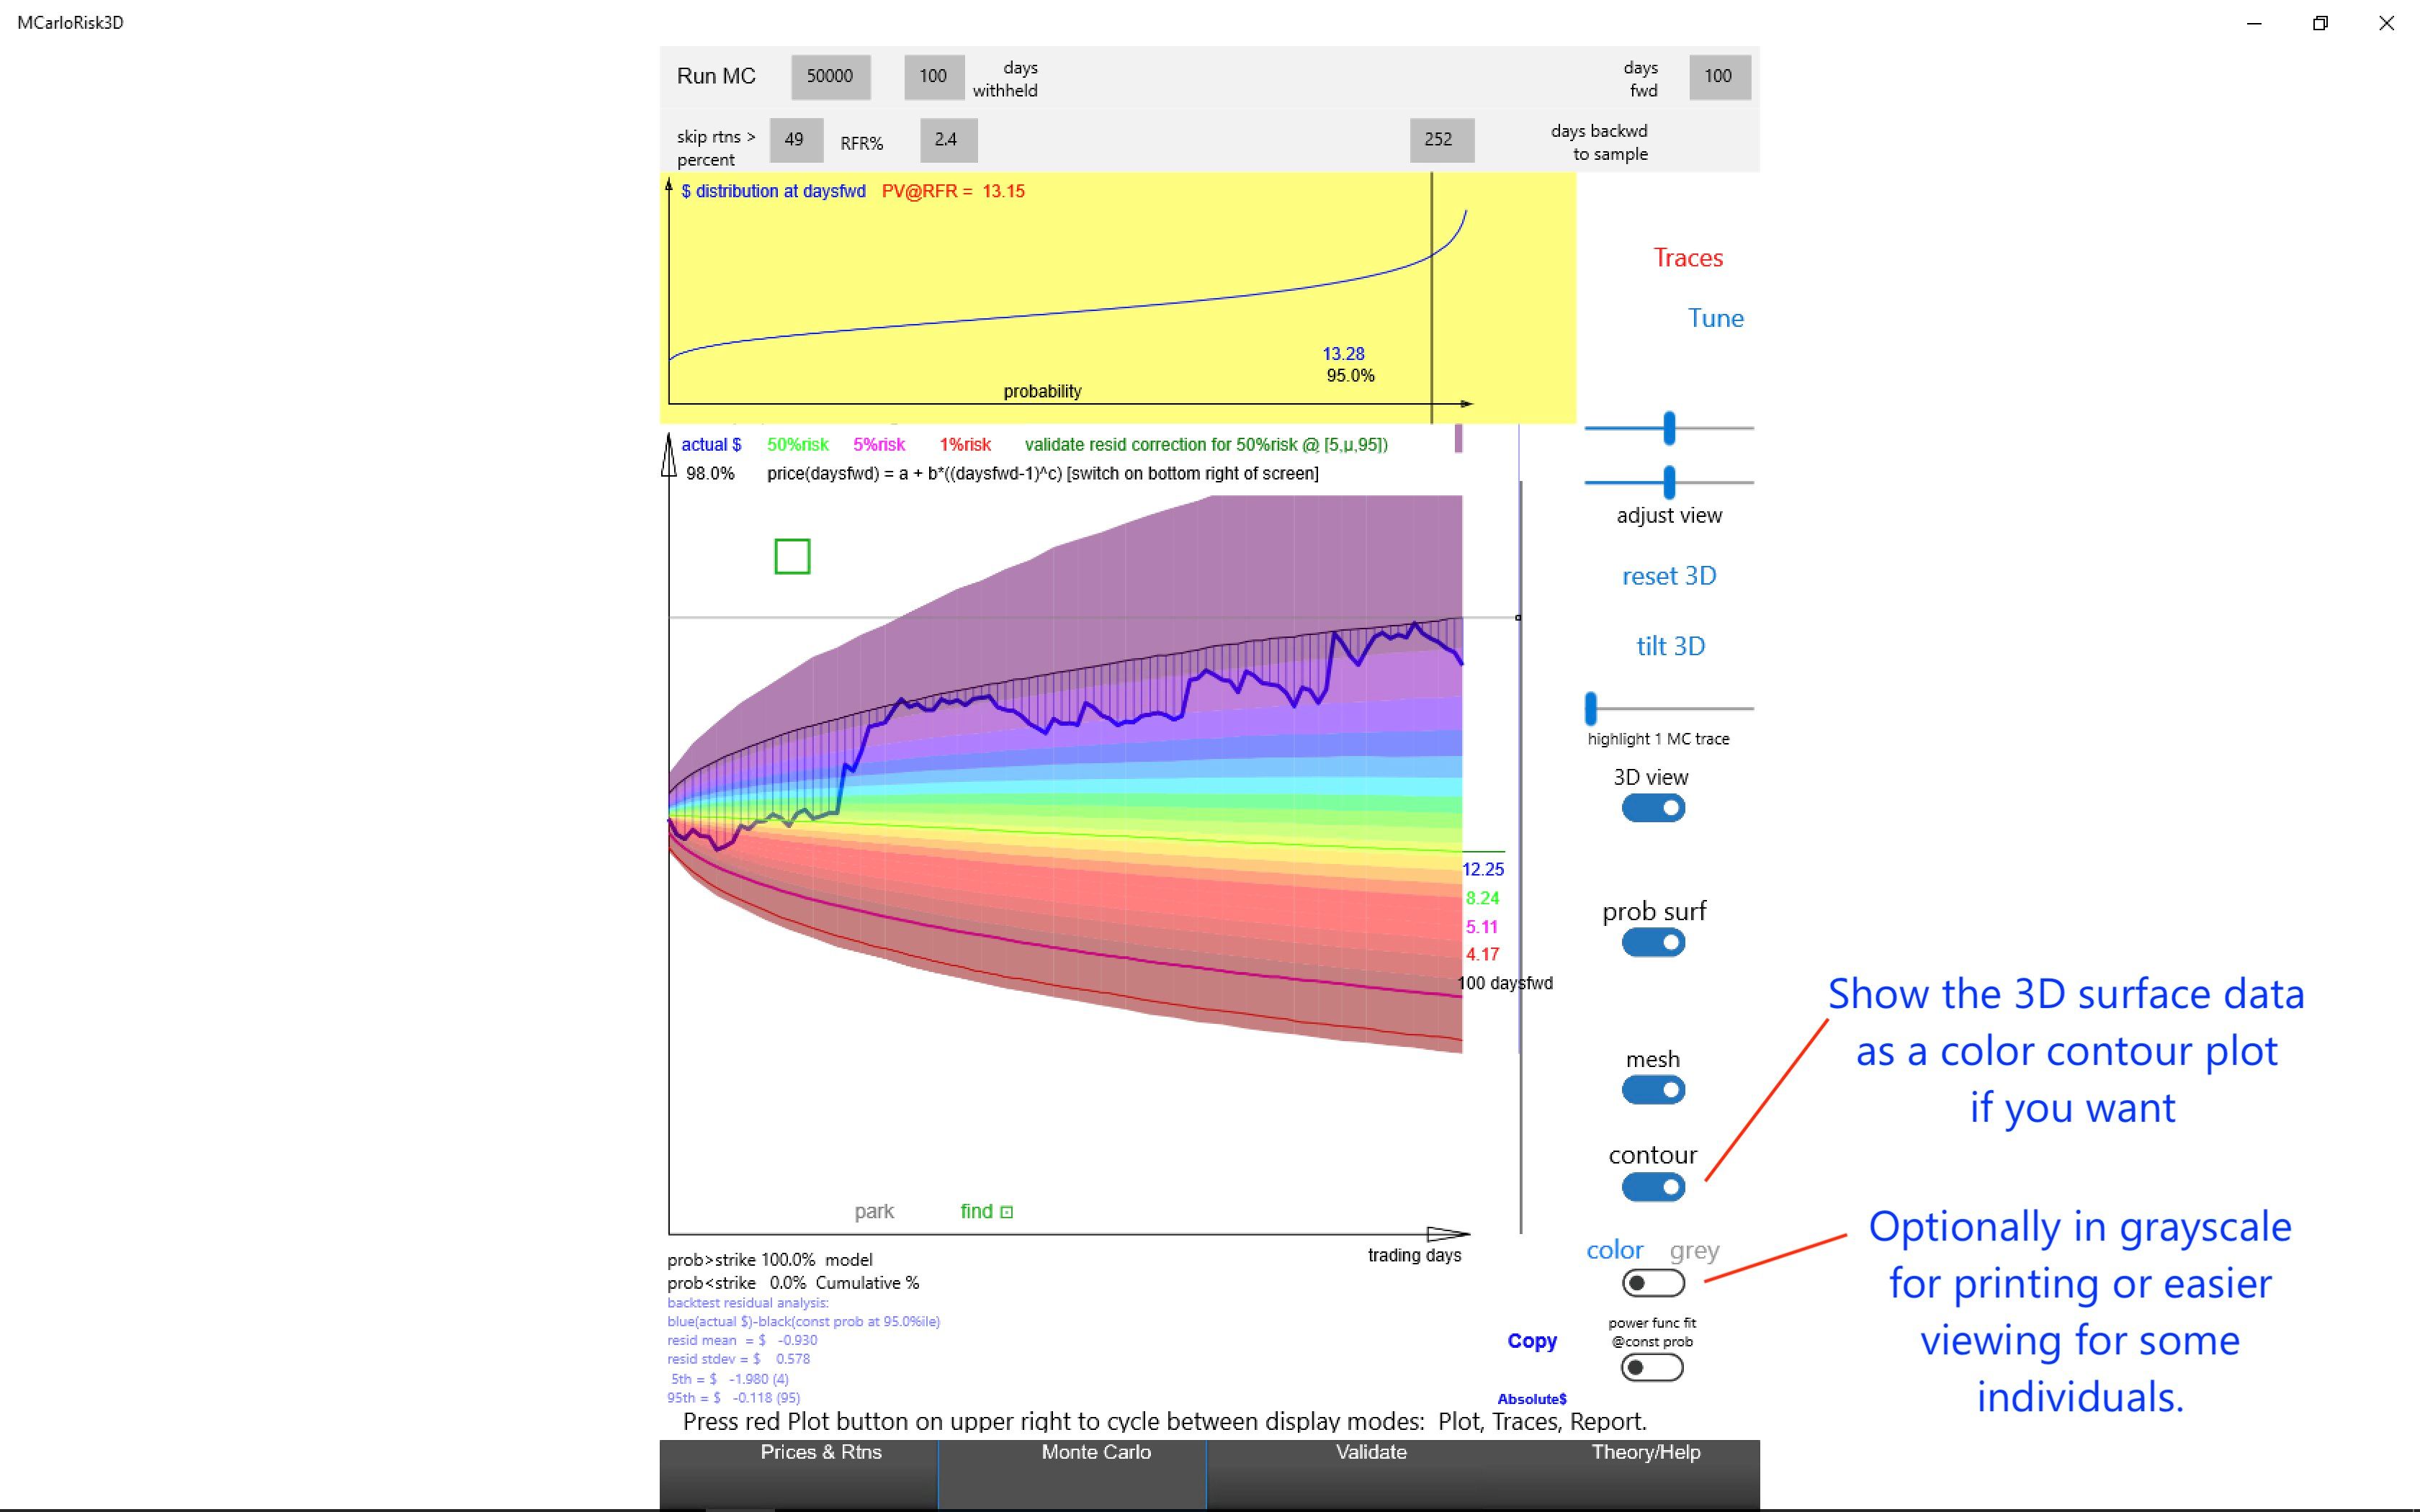
Aggregates monte carlo paths into a (time, price, probability) surface. Allows user to move sliders to slice thru and examine this surface (e.g. price over time versus probability) and visualize the surface in 3D and with shaded contour plots.
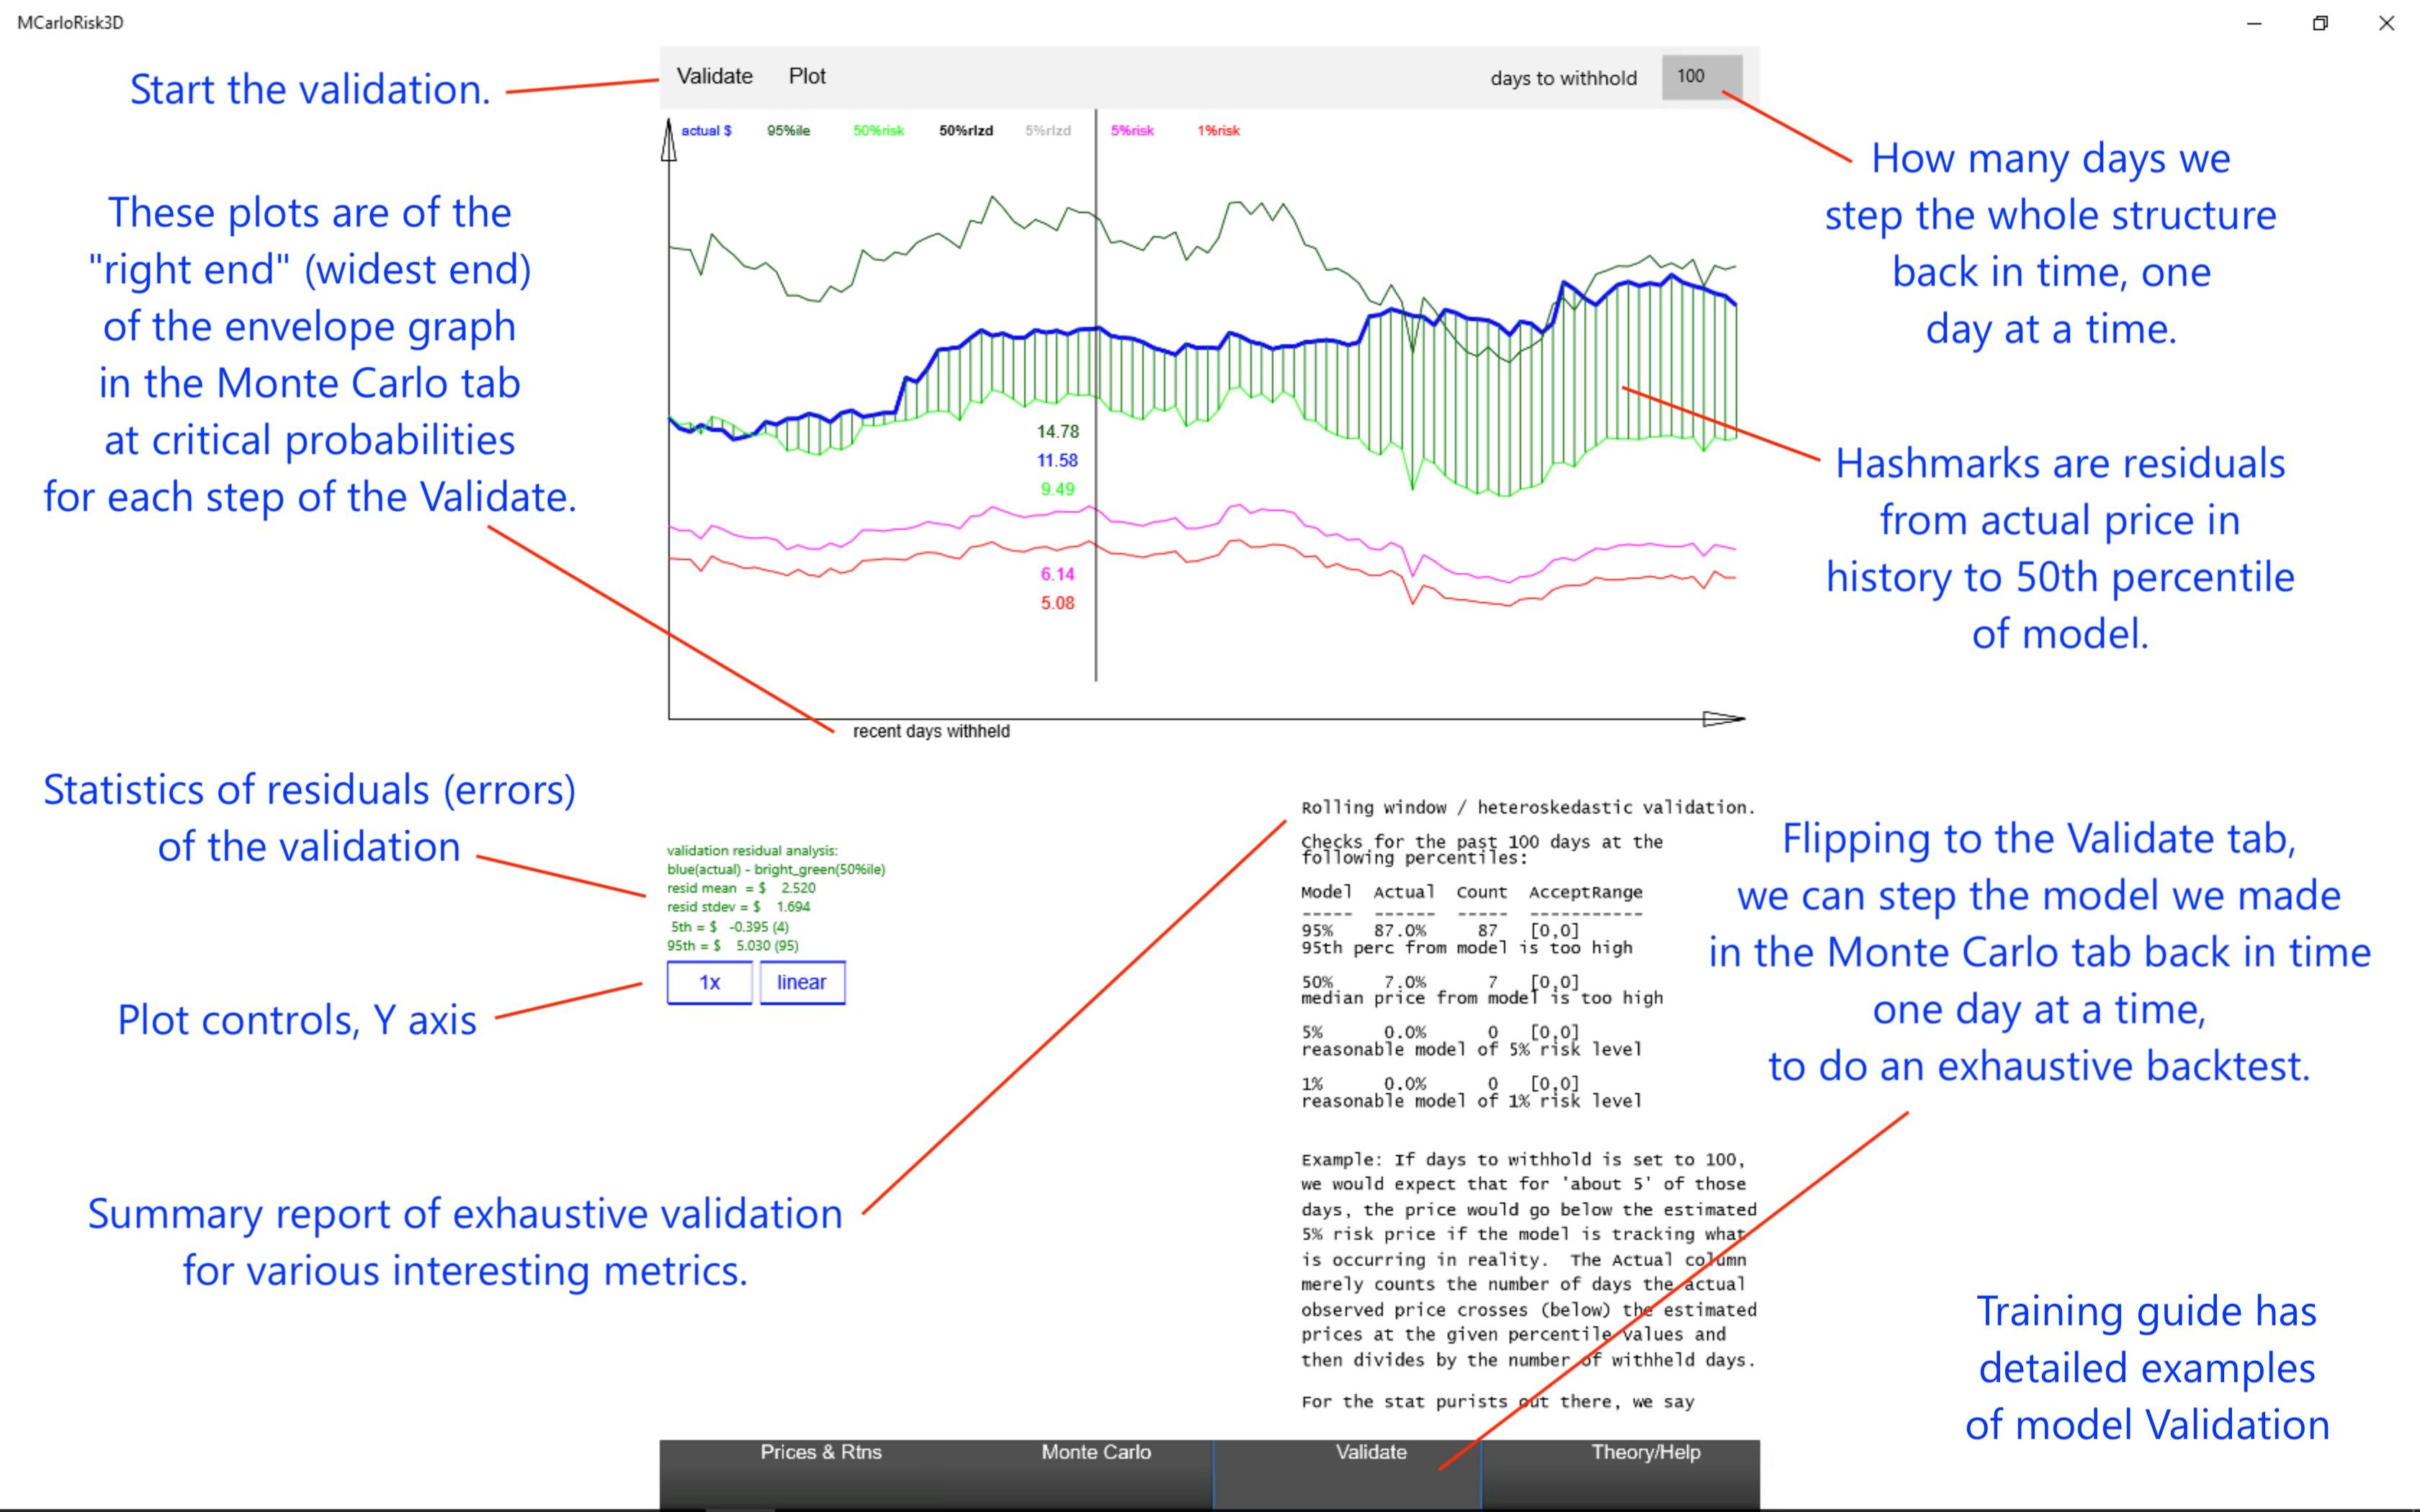
Perform bulk backtests or exhaustive backtests to validate model.
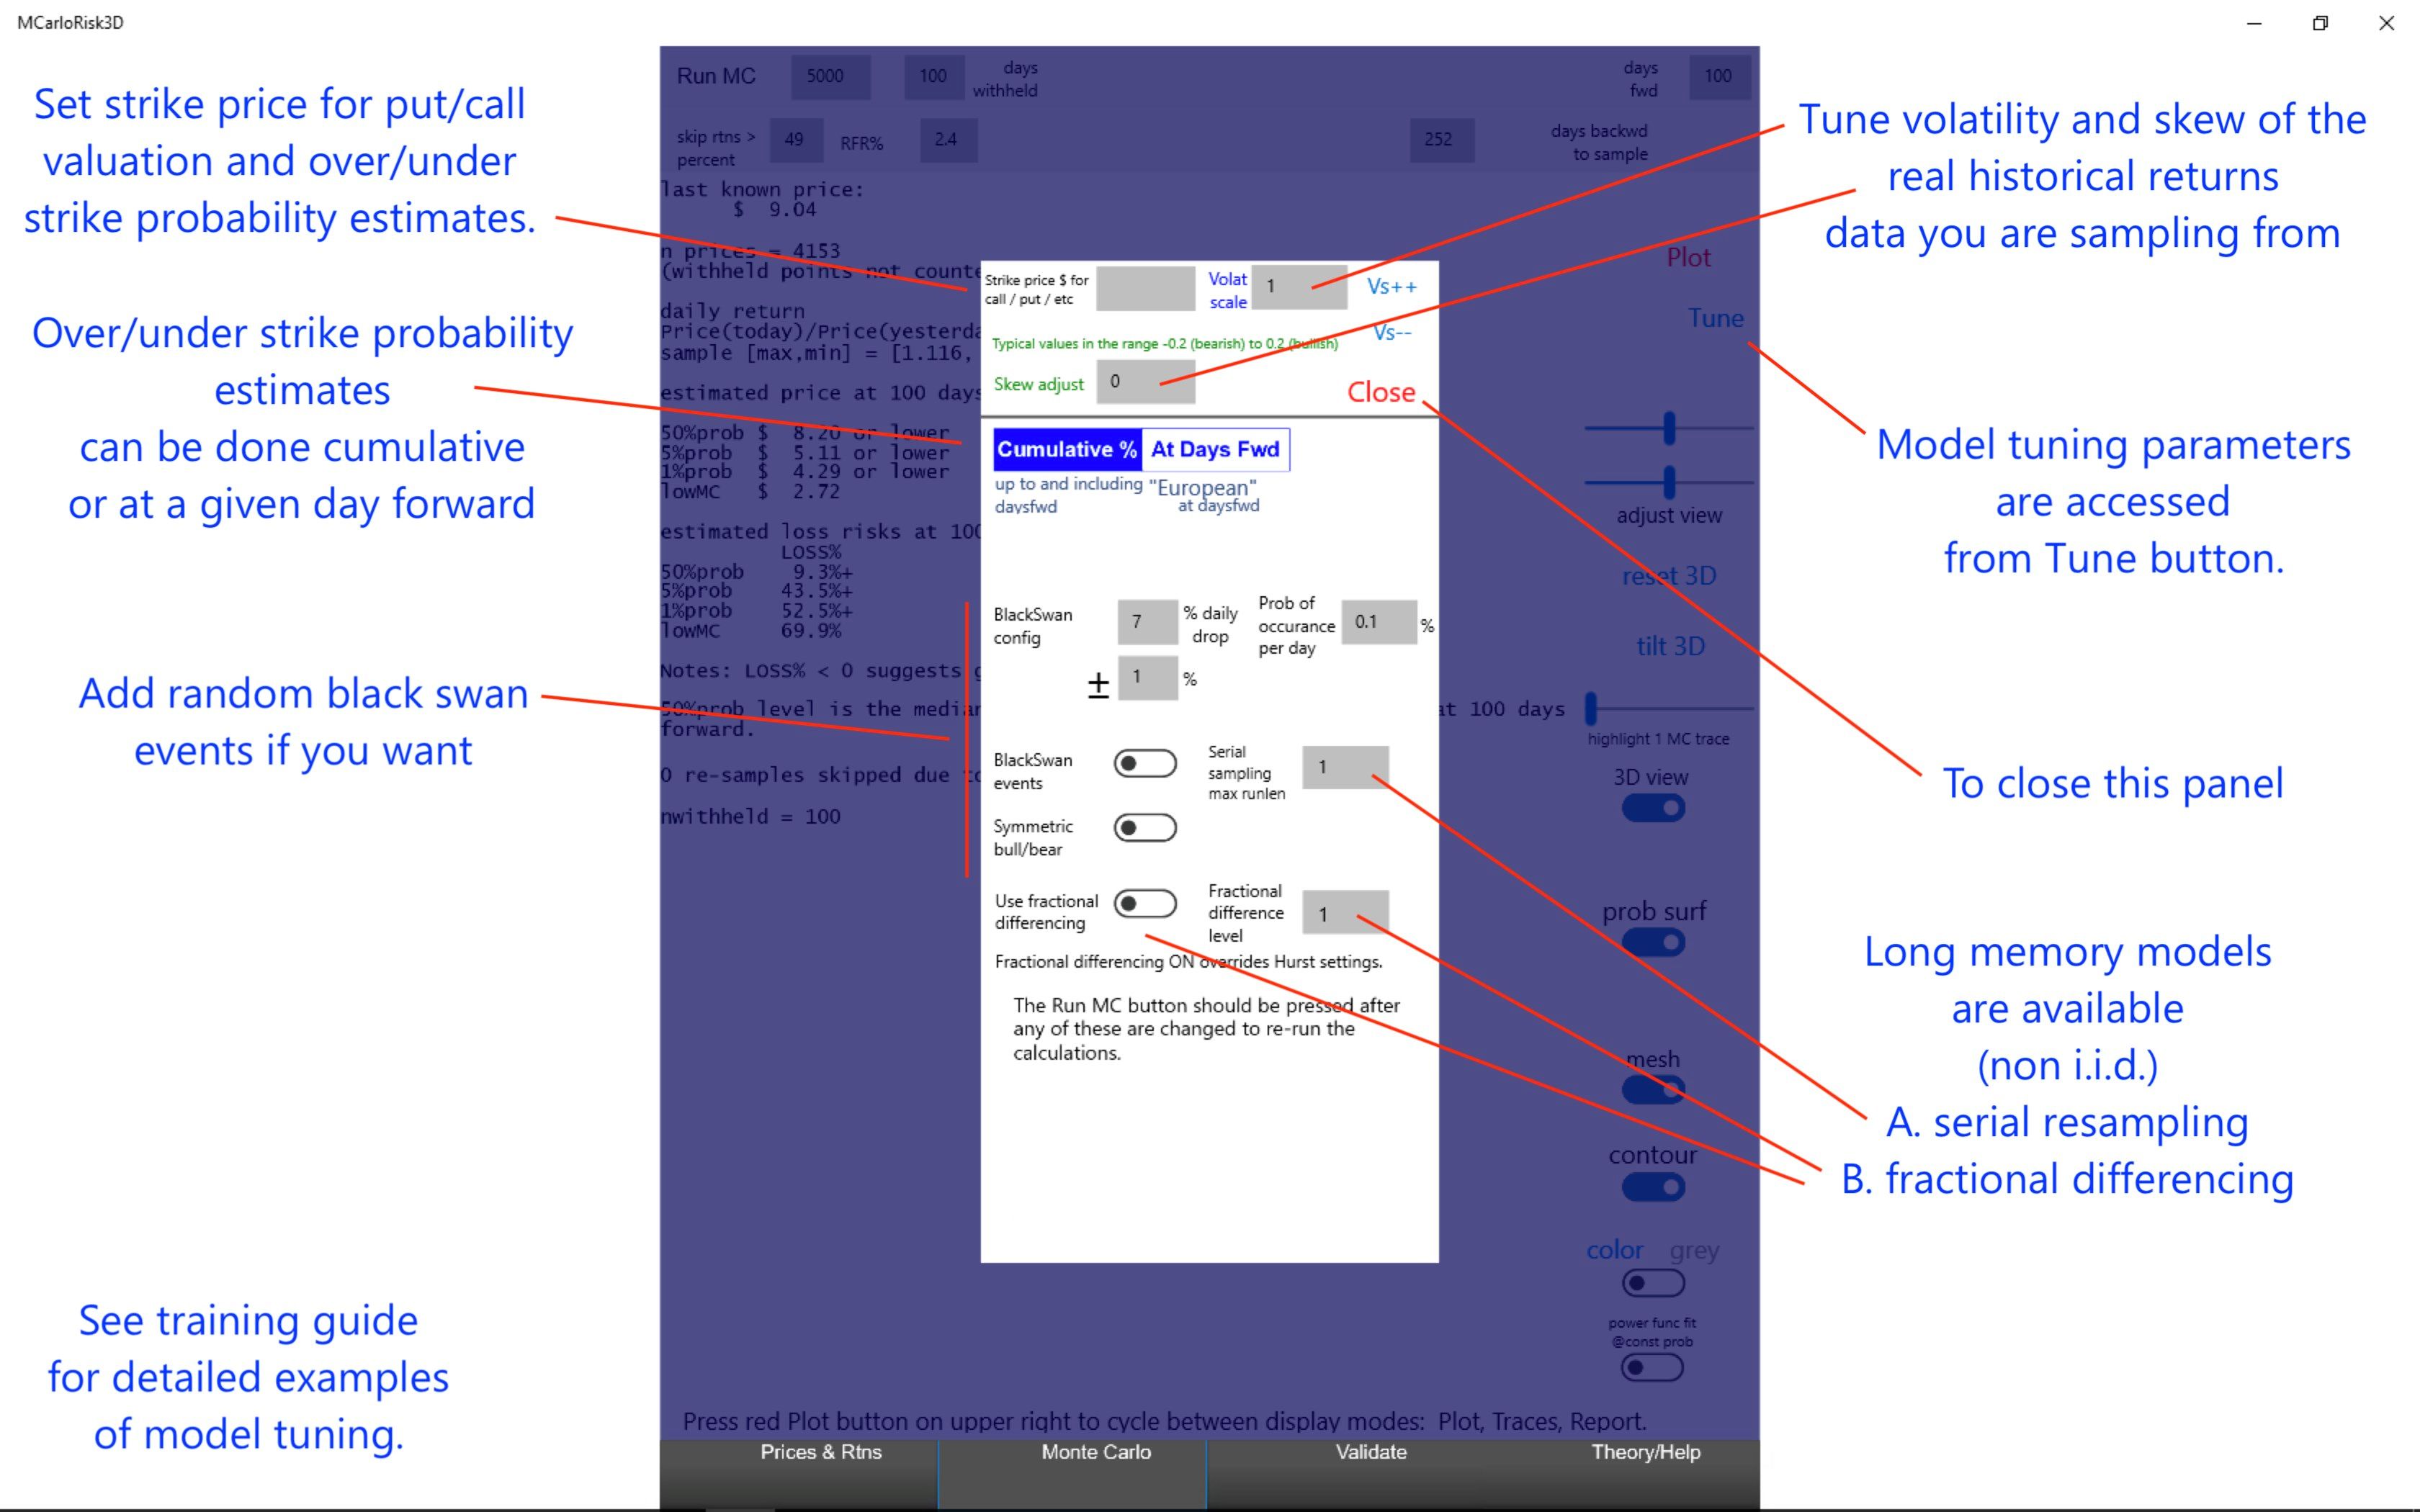
At-a-glance summary metrics of backtests are computed to estimate model quality. Many model tuning parameters to adjust model to observed backtests:
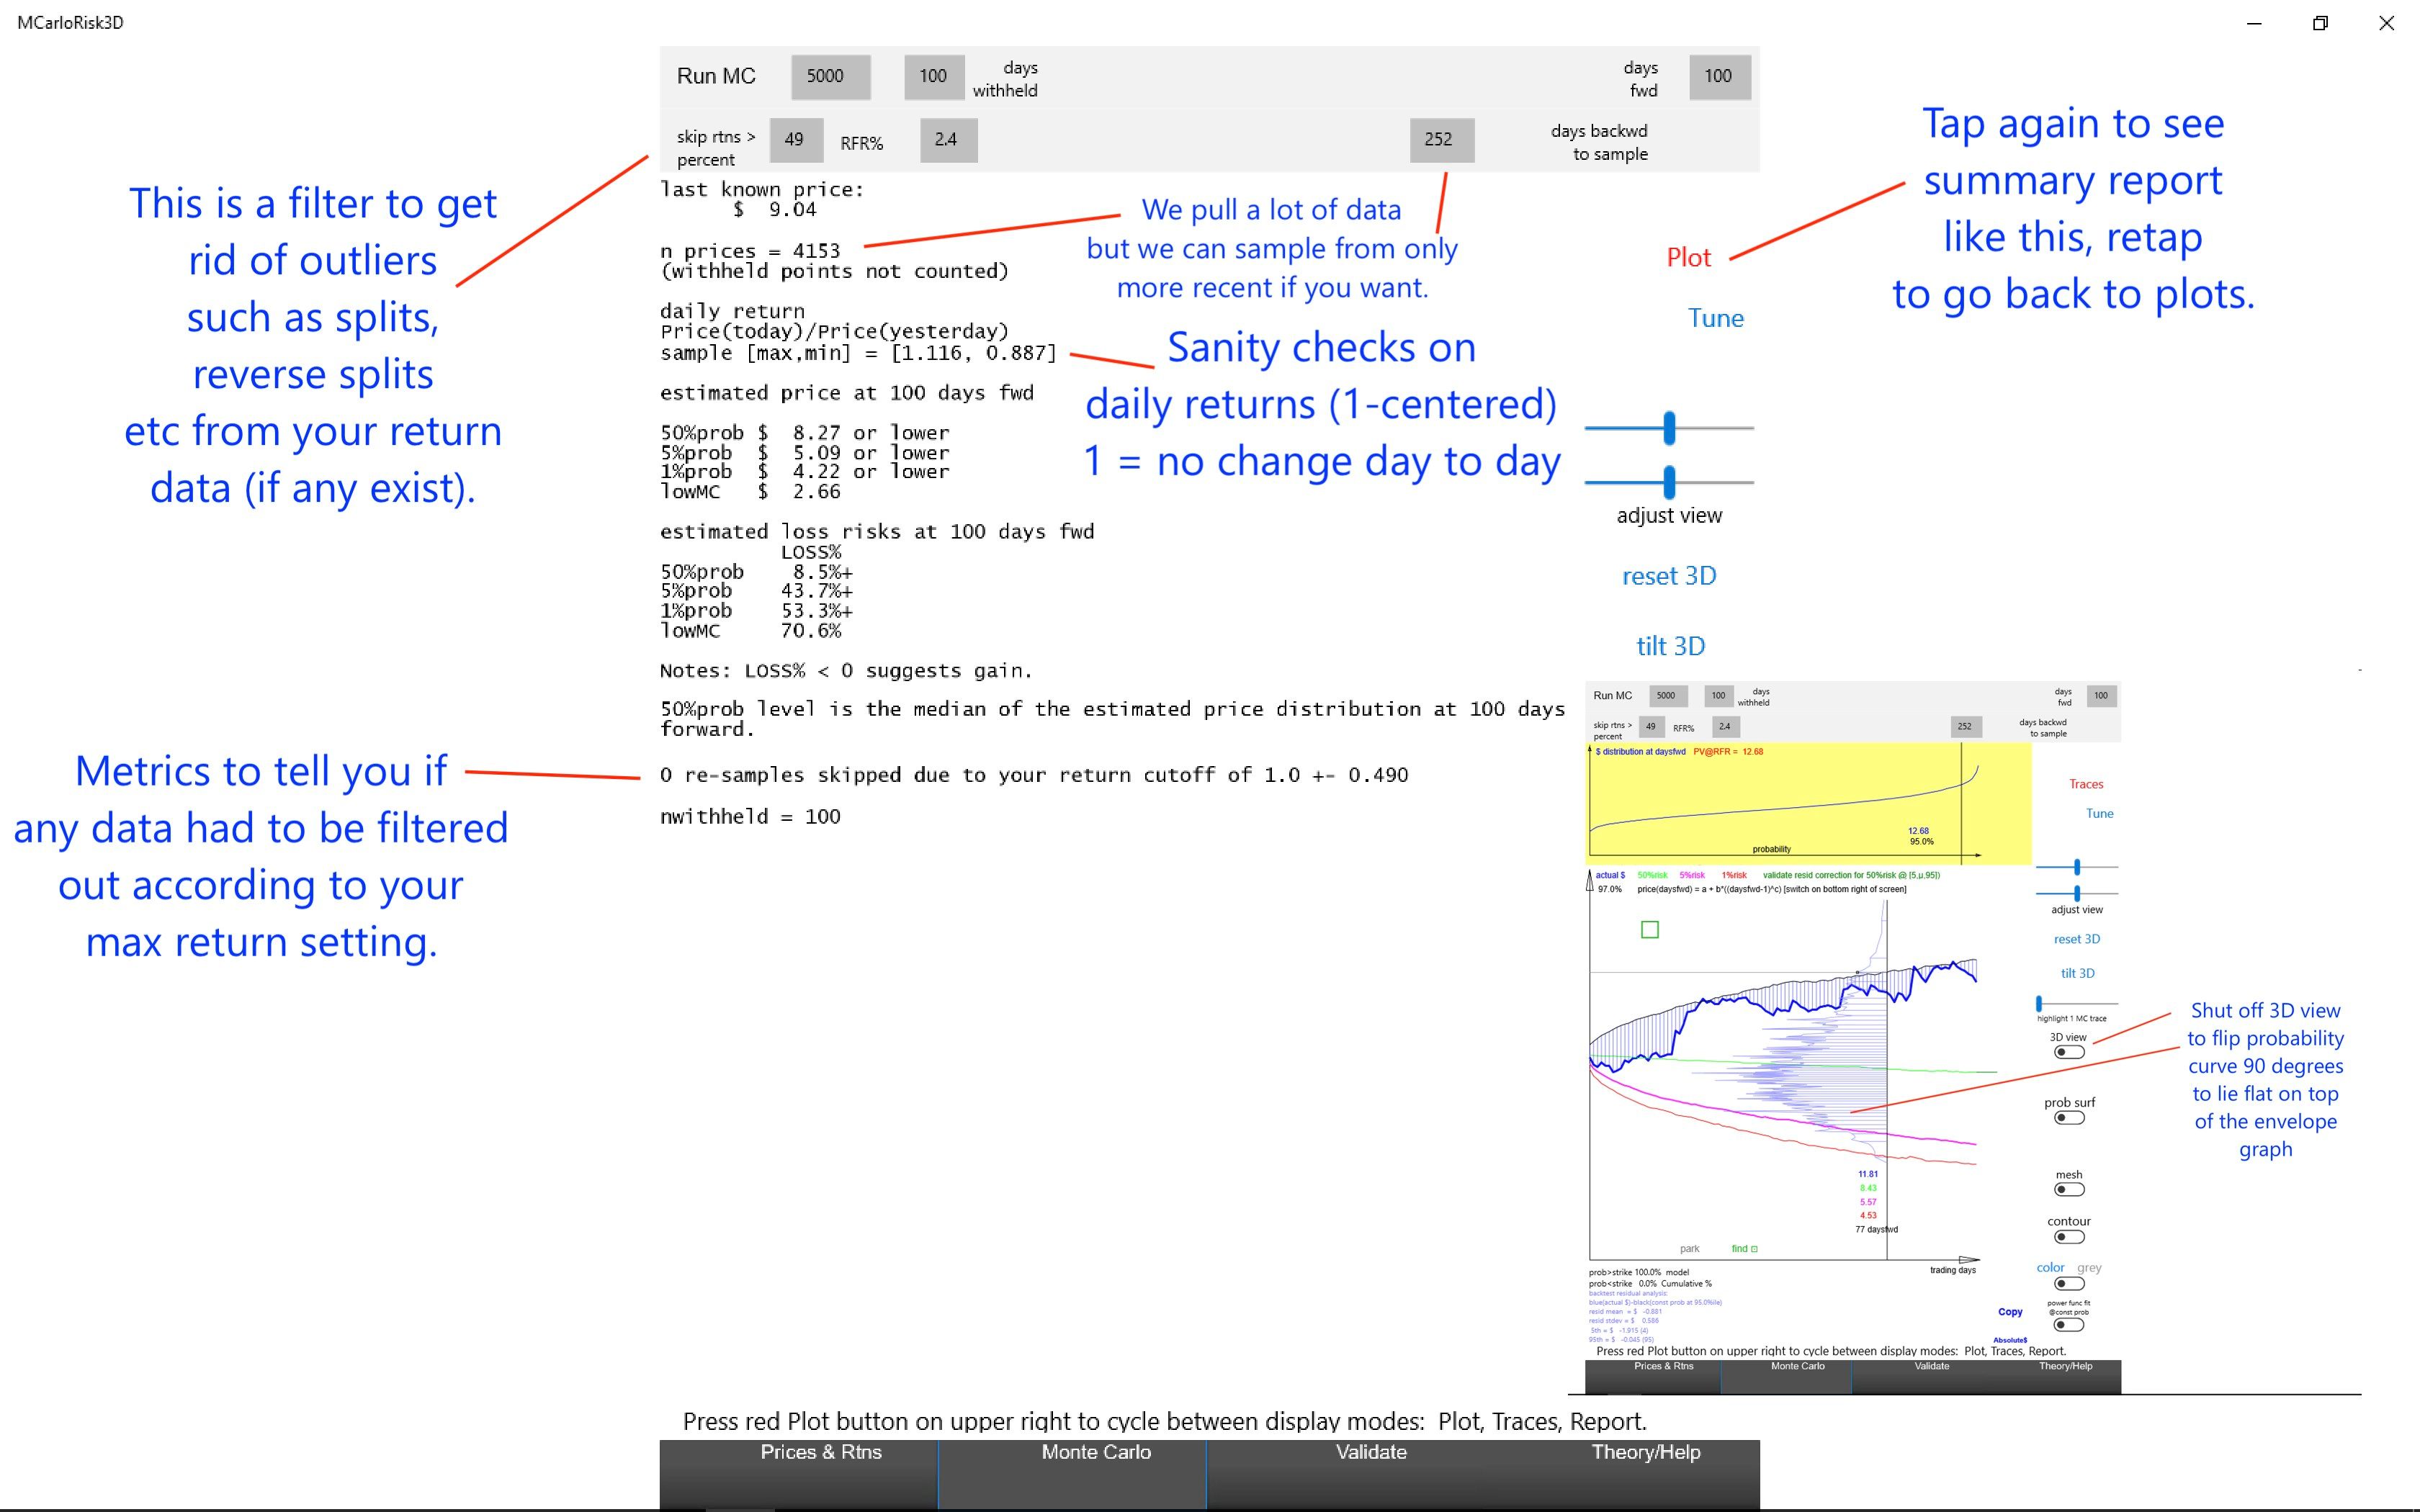
- adjust days backward to sample to pull from older or newer price history
- add black swan events (symmetric or non symmetric)
- tune skew and volatility of historical returns distribution
- add long memory to the monte carlo paths (as noted above)
Set strike price to slice thru probability surface along the time axis to estimate probability over/under strike at a given time forward, or cumulatively up to a given time.
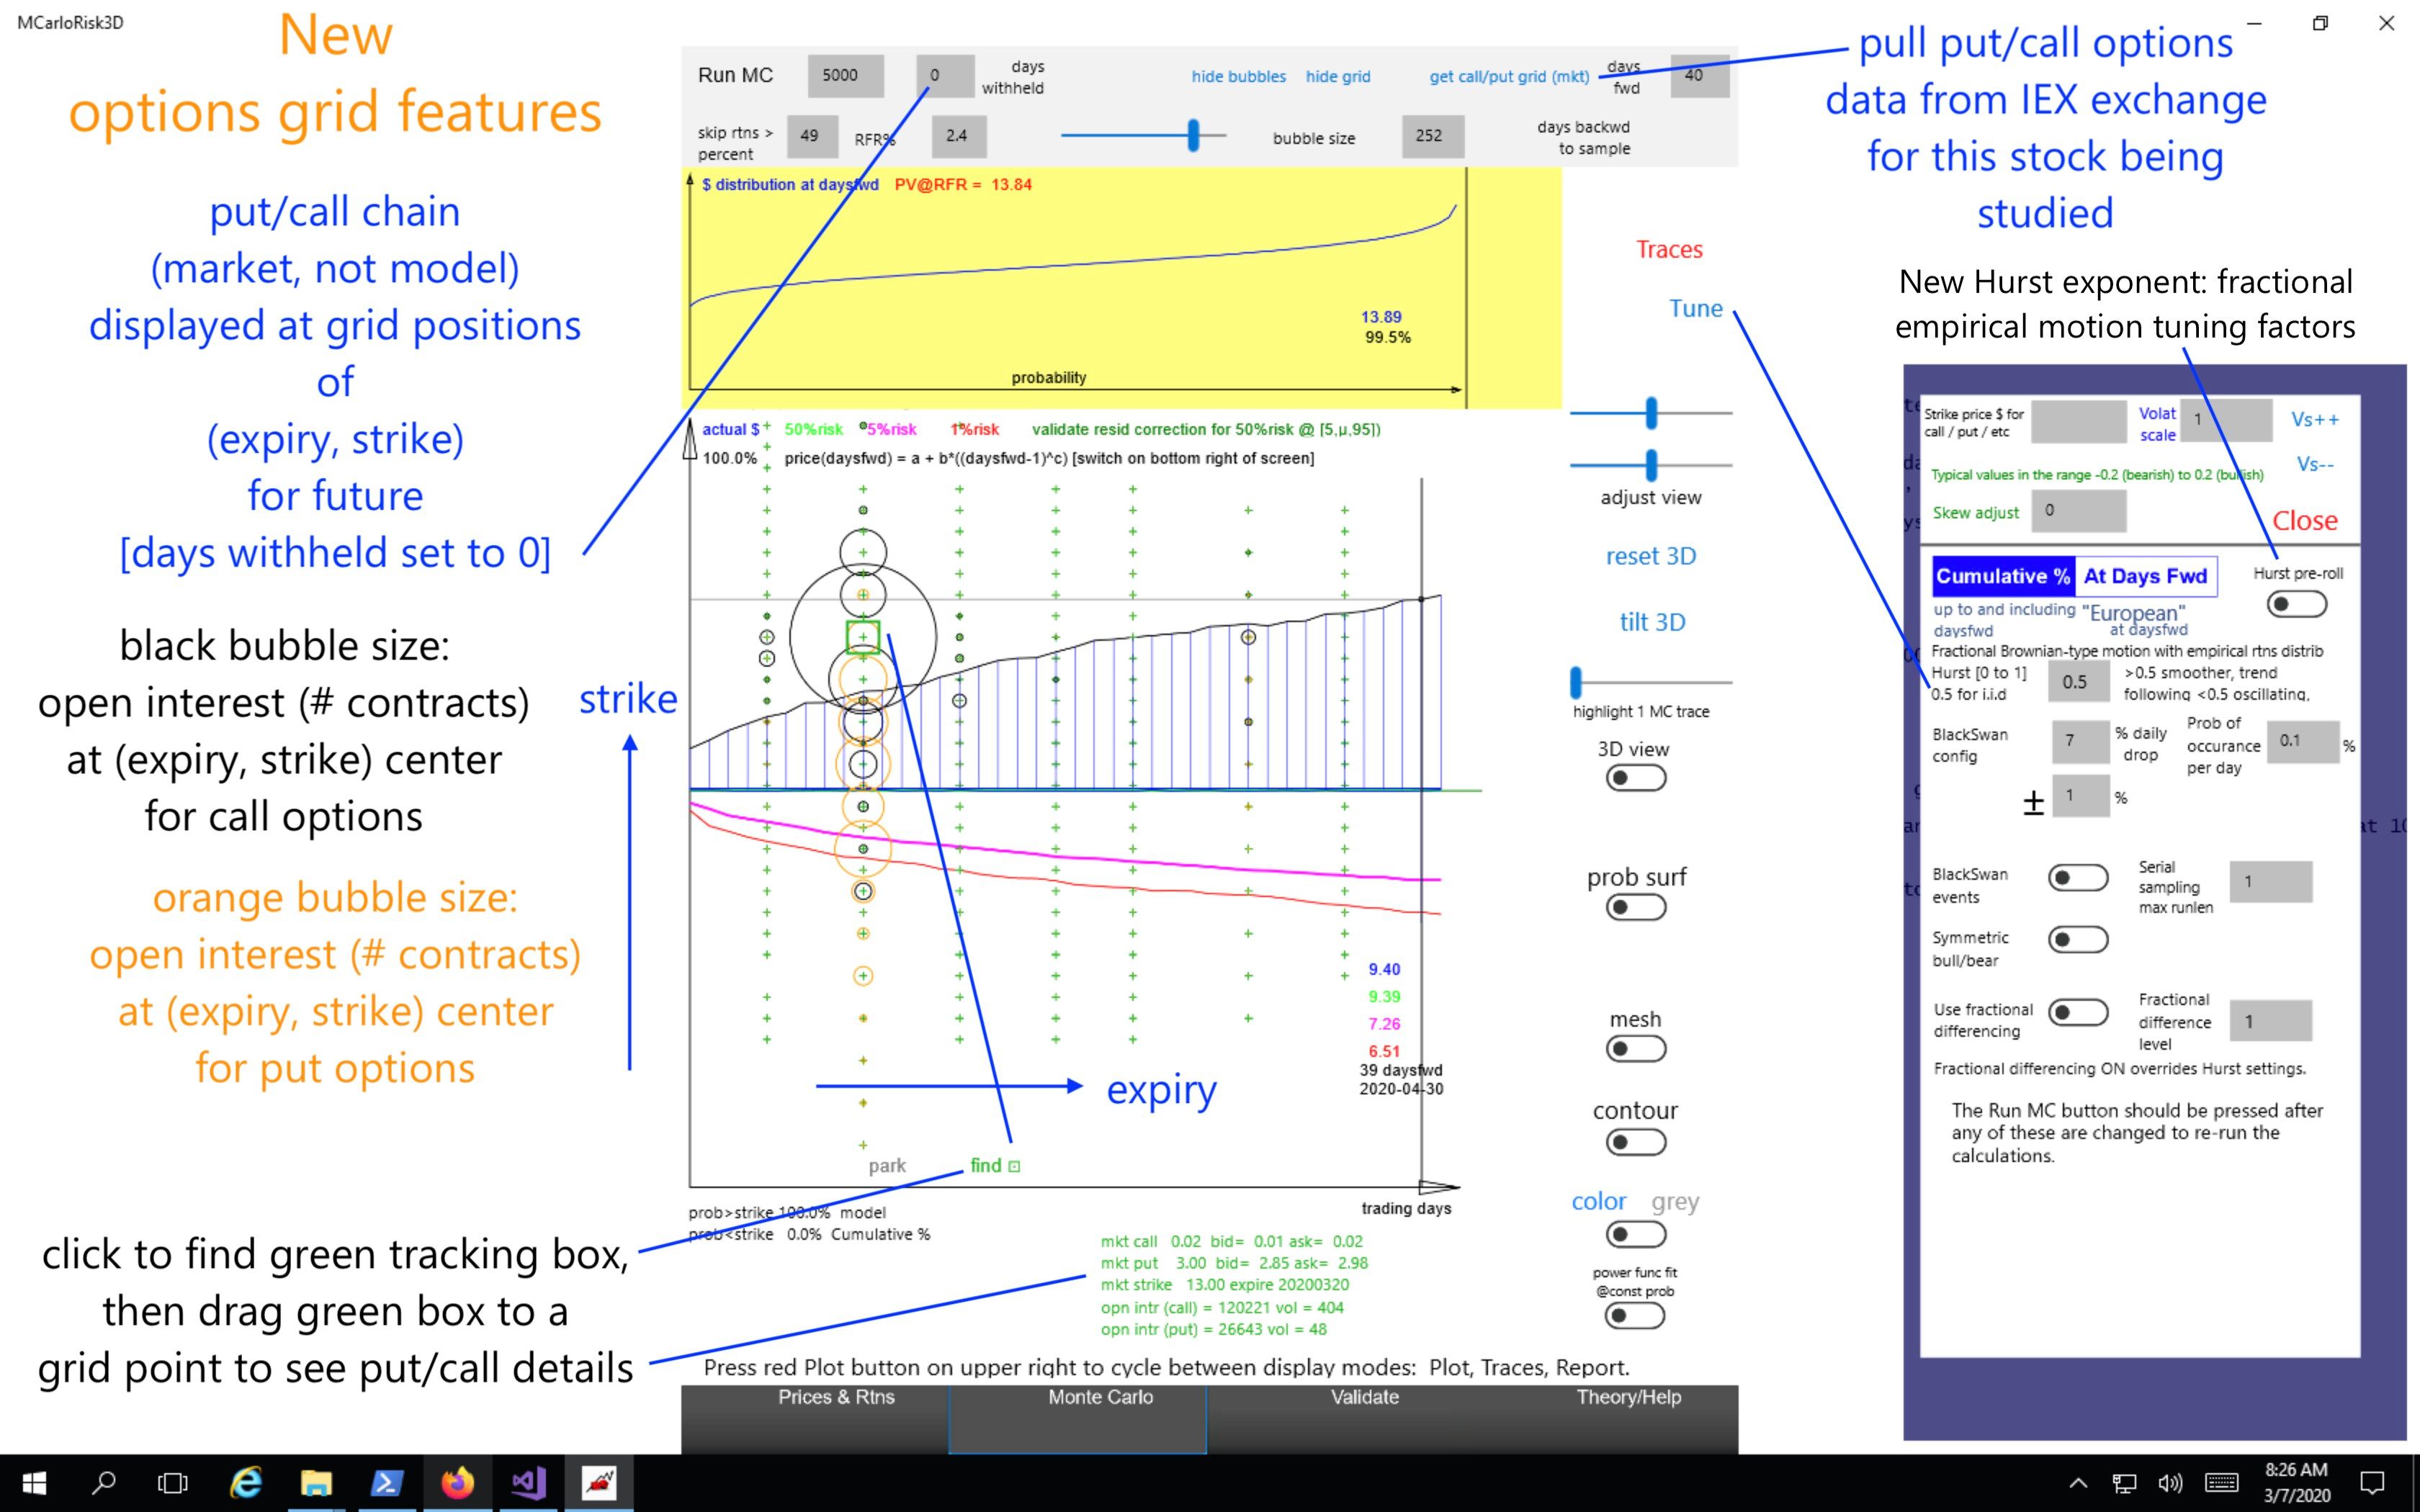
Estimate put/call prices using the model you build at various strikes and expiration days forward.
Detailed training and examples available online, noted in the Theory/Help tab of the app.
Raw price data from IEX Exchange or cryptocompare.com
Key features
-
Builds models from daily returns, not daily prices.
-
No returns distribution shape assumptions (e.g. normal / log normal).
-
Allows long memory models such as serial resampling and fractional empirical motion.
-
Supports several high market cap crypto currencies.
-
Extensive model backtesting and tuning features.
-
Strike price support (over/under strike probabilities) and put/call price estimation.
-
Extensive 3D viewing options of the probability surface for educational purposes.
-
Designed for high-res displays.
-
Put / call options grid displayed as bubbles on the forecast envelope