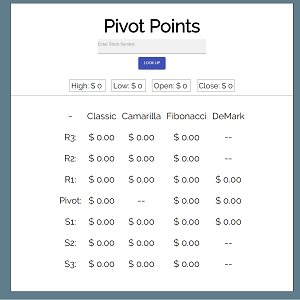
Pivot points
App details
About Pivot points
Pivot Points are a technical analysis tool used by stock traders as a possible indicator of market movement. A pivot point is calculated as an average of significant prices (high, low, close) from the performance of a market in the prior trading period.
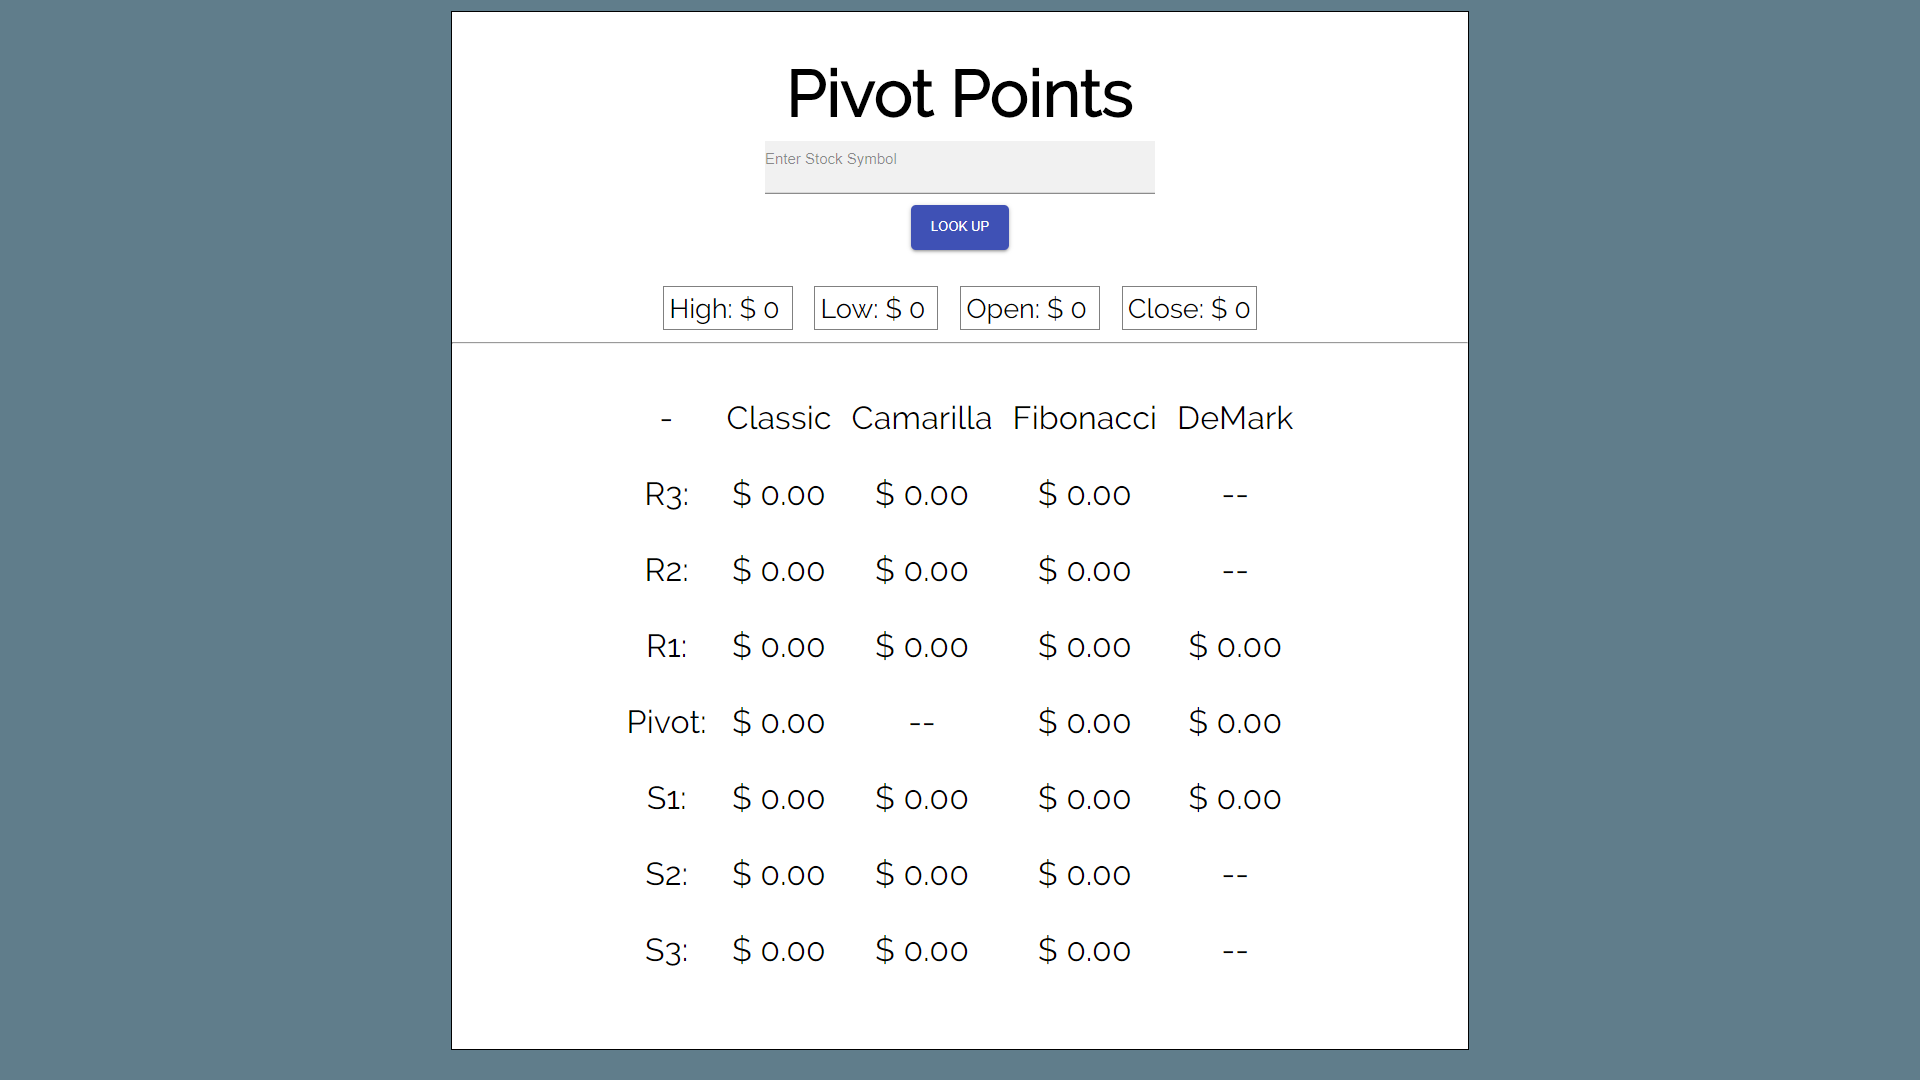
There are various methods to calculate pivot points and support/resistance levels. This app will take a stock symbol and automatically calculate values using Classic Pivot Points. Camarilla, Fibbonacci, and DeMark methods.
H=prior day high, L =prior day low, O = prior day open, C = prior day close. P = pivot point, R = resistance level, S = support level
Classic/Floor Trader method:
R3 = H + 2×(P − L) = R1 + (H − L)
R2 = P + (H − L)
R1 = 2×P − L
P = (H + L + C) / 3
S1 = 2×P − H
S2 = P − (H − L)
S3 = S1 − (H − L)
Other methods are available with a quick Bing search
** Note: Stock market trading has inherently risks. This app is merely a convenience tool. User assumes all risks related to trading in the stock market. PIVOT POINTS ARE MEANT TO BE CALCULATED IN AFTERHOURS OR BEFORE THE TRADING SESSION STARTS. IF THIS APP IS RUN DURING TRADING HOURS, IT WILL PULL CURRENT DAYS DATA INSTEAD OF PRIOR DAYS
Key features
-
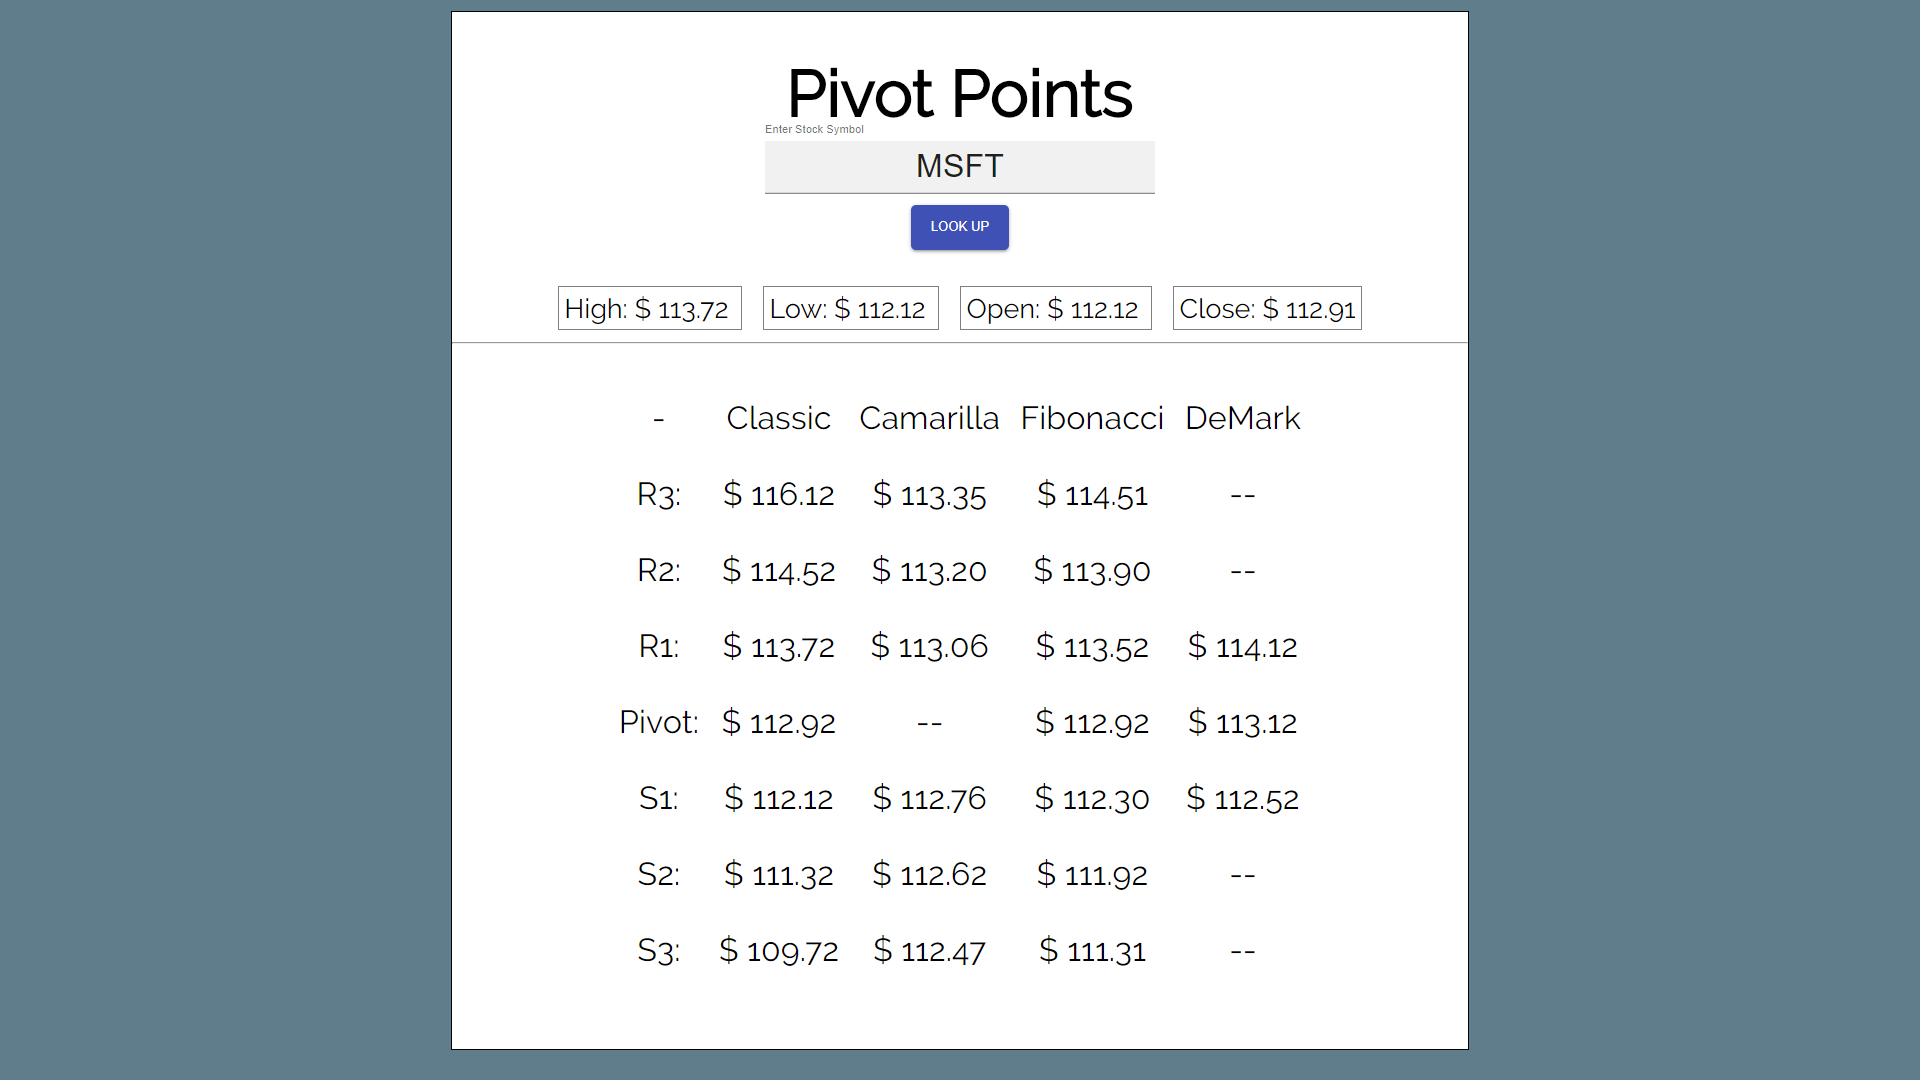
Looks up stock symbol data and returns calculated Pivot Point values