
ProRaster Premium
App details
About ProRaster Premium
ProRaster Premium is an advanced raster rendering application. Render and explore rasters of any size or format, displayed in stunning clarity and rendered with industry-leading speed. Create, edit, display, publish, and export raster rendering algorithms that contain rasters of unlimited size.
ProRaster Premium is a part of the ProRaster product family. If you wish to evaluate the features of ProRaster Premium before purchasing, search for and install ProRaster Premium Free. To decide which ProRaster product tier is right for you, please visit the product website at:
https://robertsgeospatial.com.au/products/proraster/
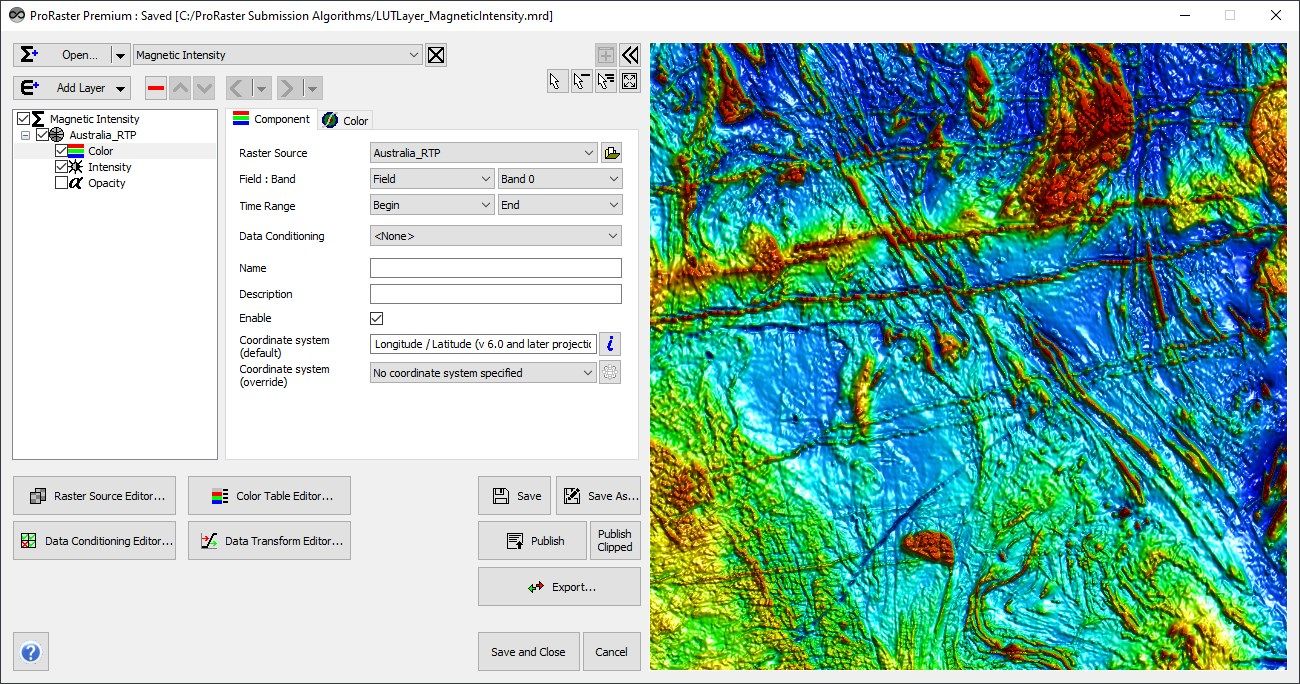
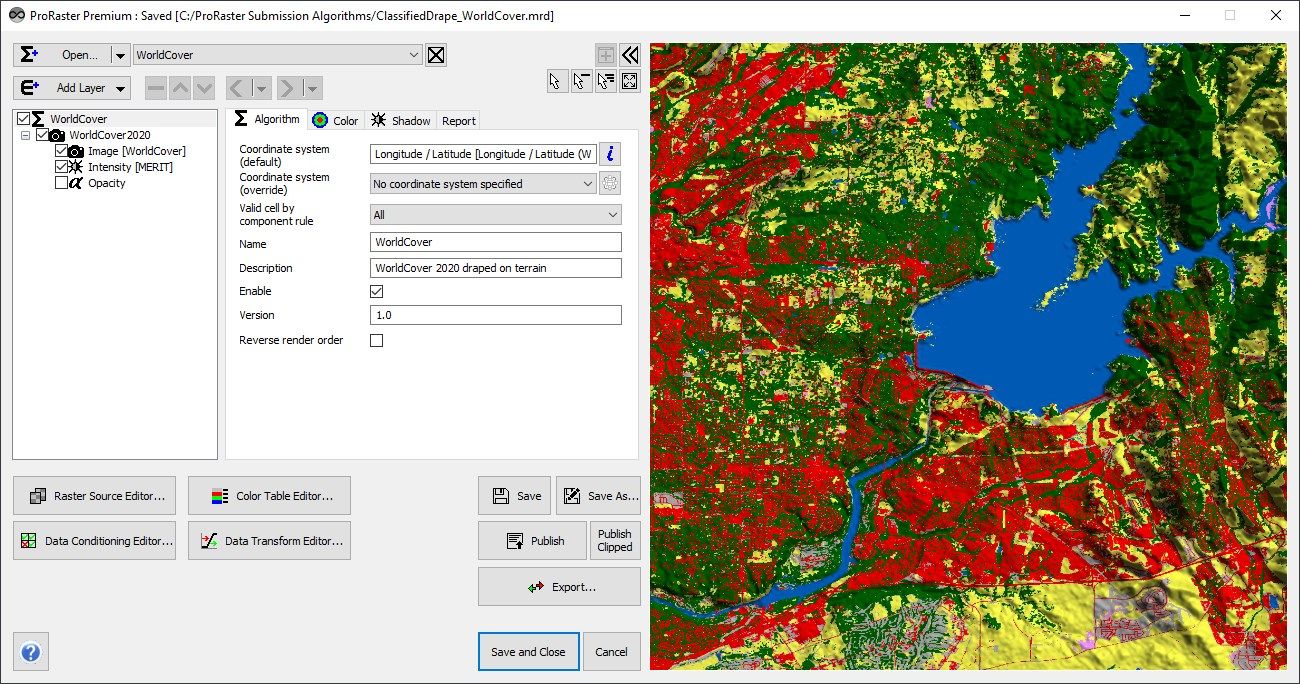
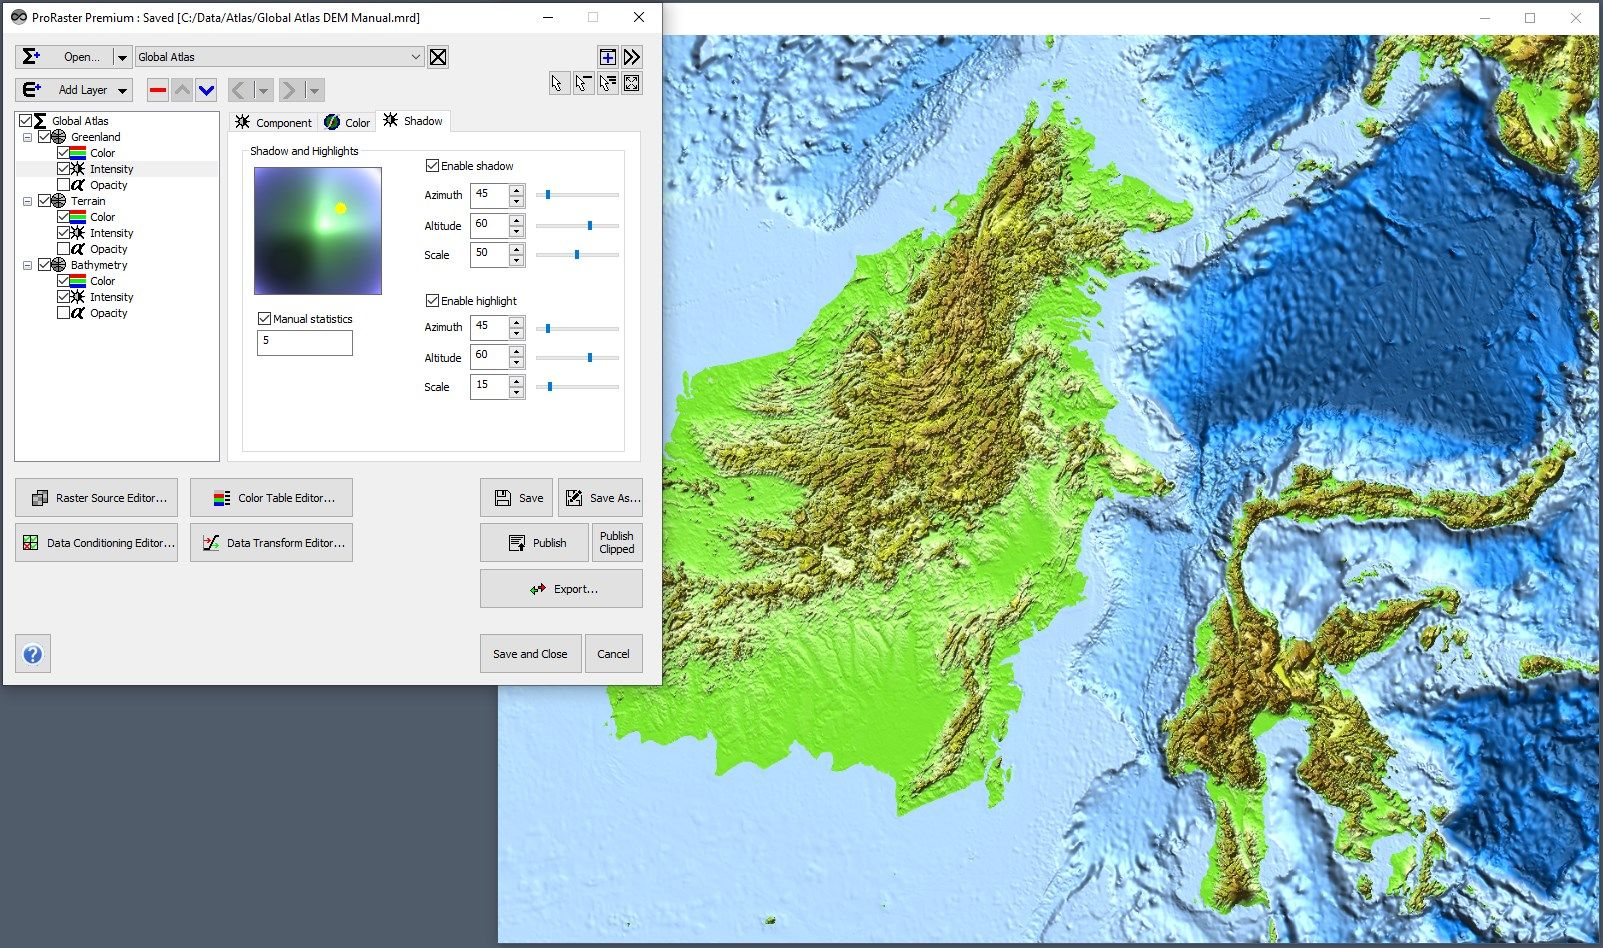
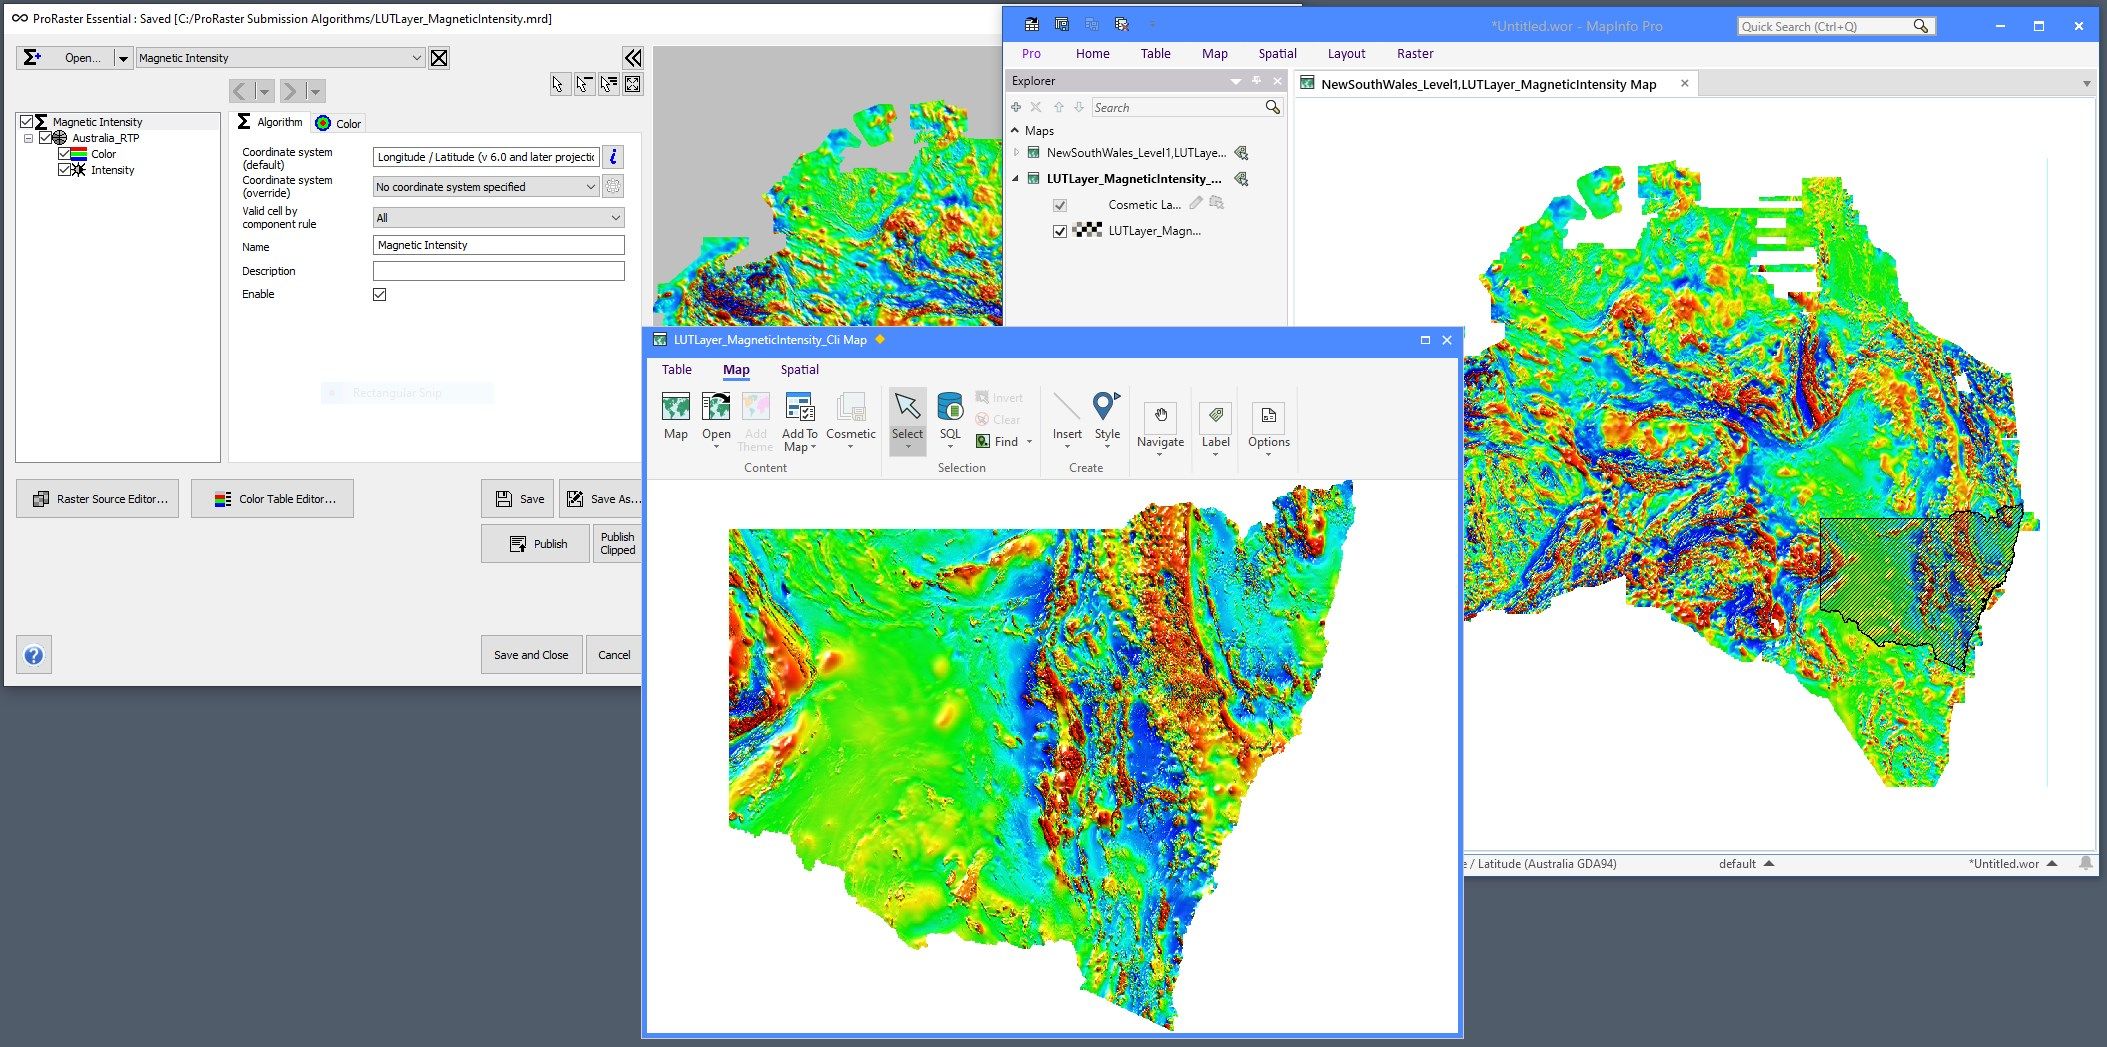
Using ProRaster Premium, you can quickly and easily create a rendering algorithm for rendering one or more raster datasets. As you build the algorithm, see it rendered in the preview map. Undock the map window so you can resize or maximise the view.
Explore raster datasets of unlimited size interactively by zooming and panning. As you zoom and pan, display the value of the raster at the cursor location in a tooltip. Undock the preview map and resize it.
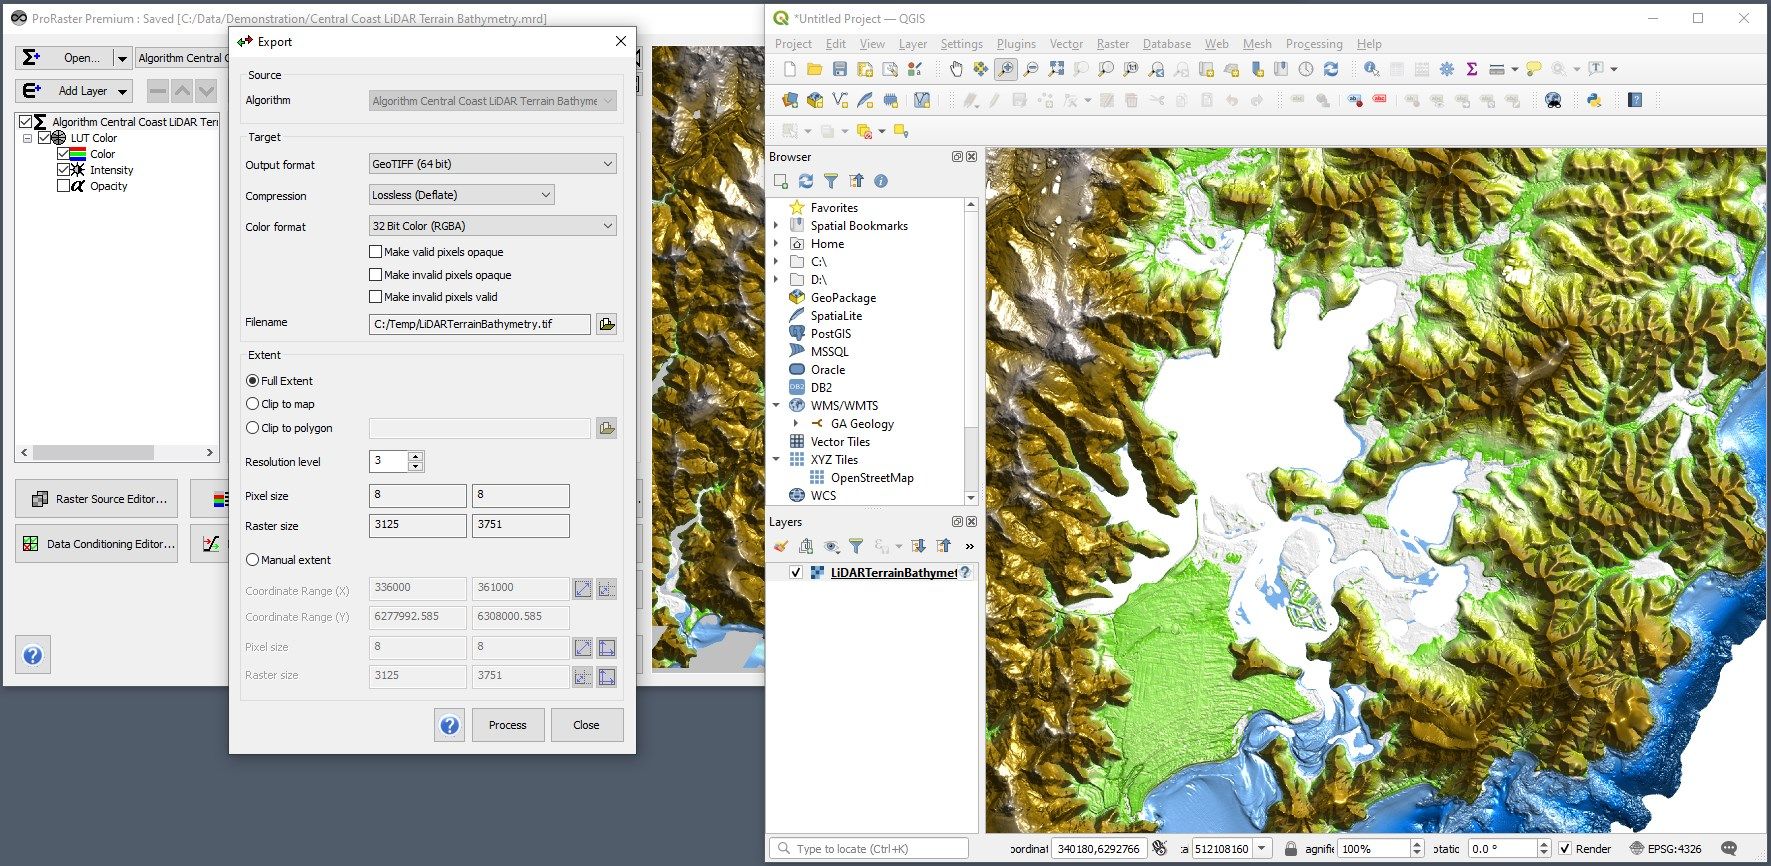
Save your algorithms to MRD file and publish your algorithms to the latest version of MapInfo Pro which will display the rendered algorithm in a map. Export your algorithms to located images of any size that you can display in any GIS or application that supports located imagery.
Get an introduction to ProRaster at:
https://www.youtube.com/playlist?list=PLE8RCT90BXnZxXuFicgsEH4tHPui_yokK
Discover ProRaster basic training at:
https://www.youtube.com/playlist?list=PLE8RCT90BXnappIar54wccXL_fVR1sP8w
Take a deeper dive into ProRaster at:
https://www.youtube.com/playlist?list=PLE8RCT90BXnahZUwTU7zCmyGJn3vBL1W2
See the latest ProRaster features at:
https://www.youtube.com/playlist?list=PLE8RCT90BXnbnBgfFdA2LCqHCTASH506y
Key features
-
• Open any algorithm file (.mrd) for display and editing.
-
• Edit multiple algorithms simultaneously using undo and redo.
-
• Render a preview of the algorithm as you edit it in an interactive map.
-
• Display a tooltip at the cursor location showing the raster value at that location and double click for a full cell value report.
-
• Create default algorithms for rasters or raster sources.
-
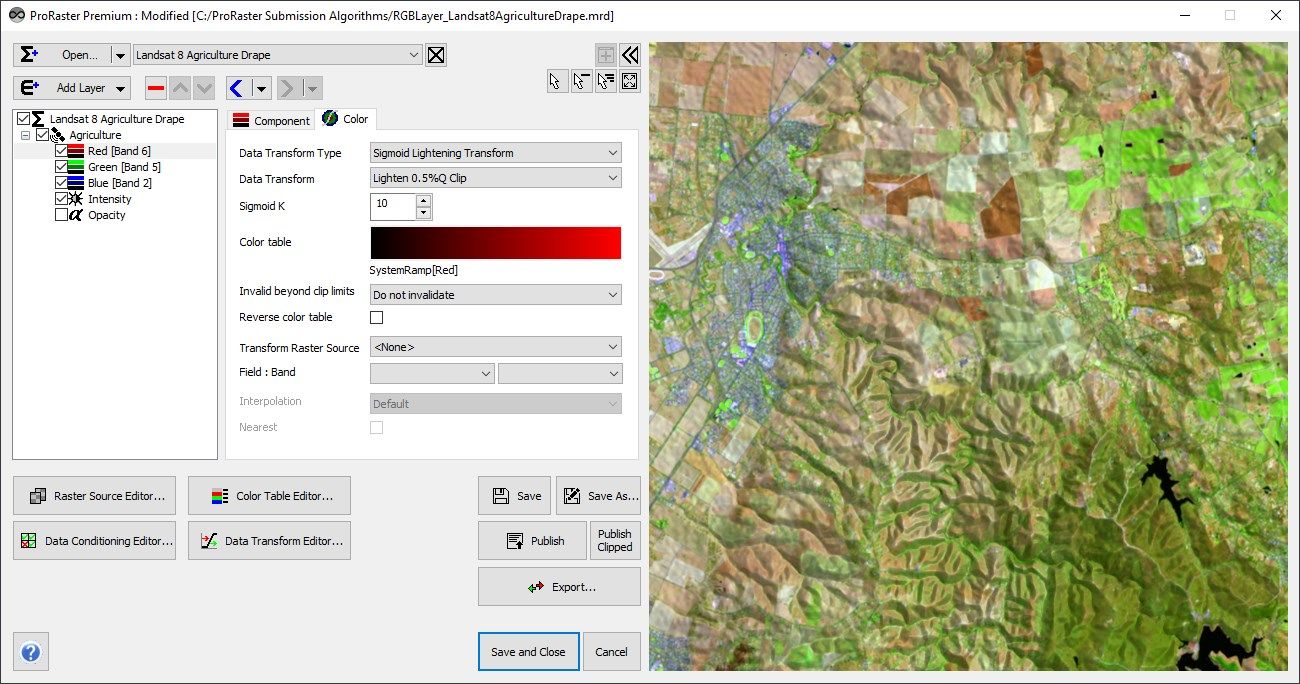
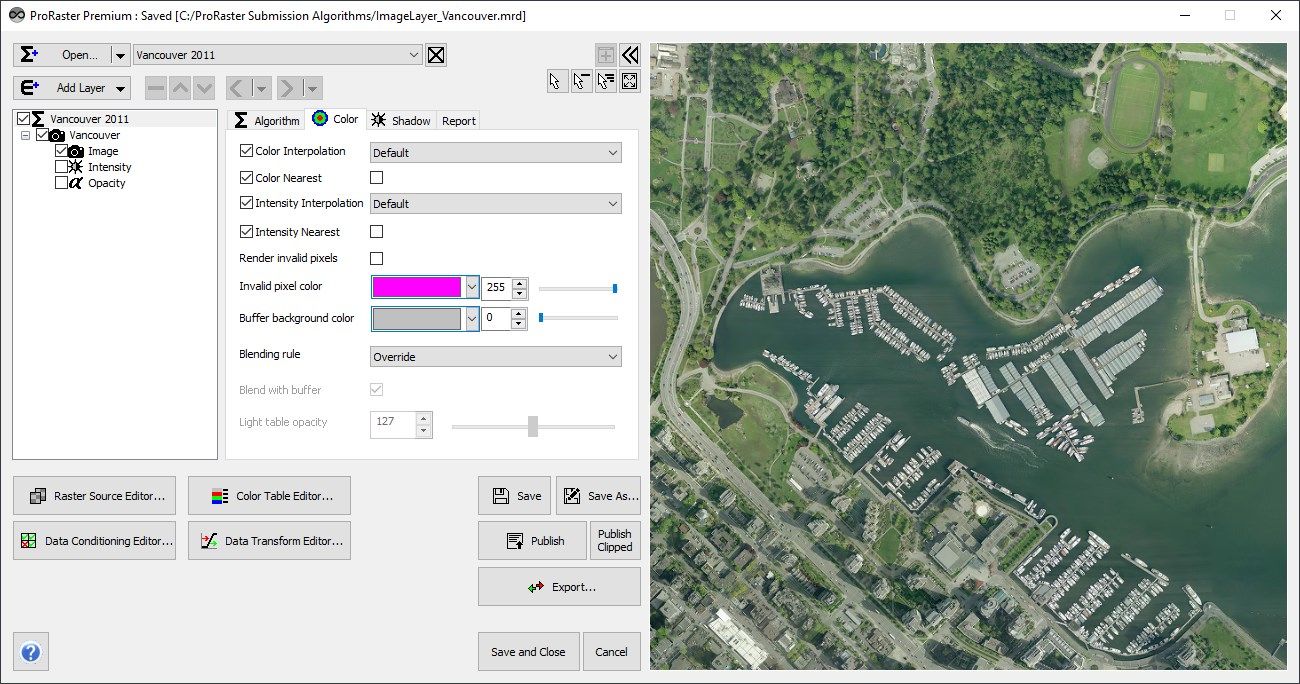
• Create new algorithms with an Image, Color or RGB layer.
-
• Publish your algorithms in the latest version of MapInfo Pro and display them in a map in MapInfo Pro.
-
• Clip your algorithm to a complex polygon set and publish and display in the latest version of MapInfo Pro.
-
• Export your algorithm to a located image raster at any resolution that you can display in any GIS. Clip it to the map extents or to a complex polygon set or to manual extents.
-
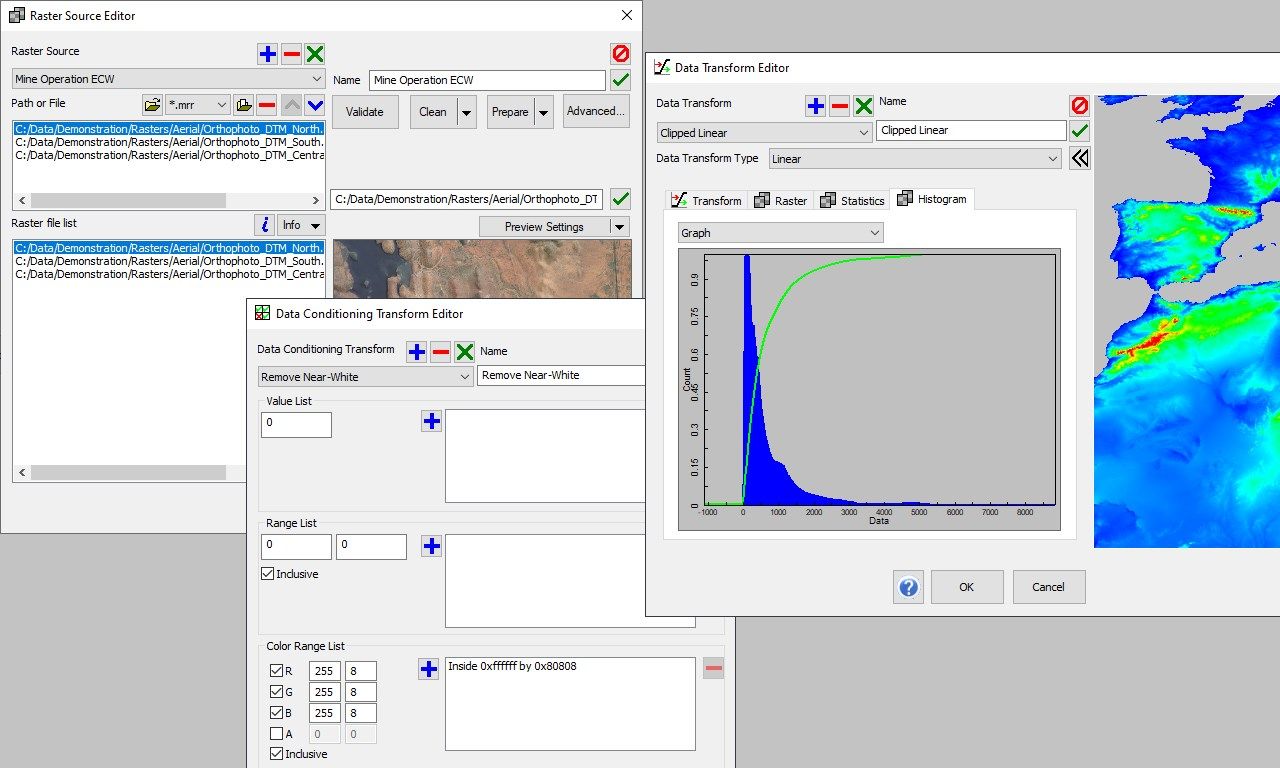
• The Raster Source Editor is used to create and edit raster source objects.
-
• Render multiple rasters in a single layer using raster sources.
-
• Use the Validate, Clean and Prepare processing operations to build statistics and overview pyramids.
-
• Control and override the way the raster engine interprets raster metadata using driver preferences.
-
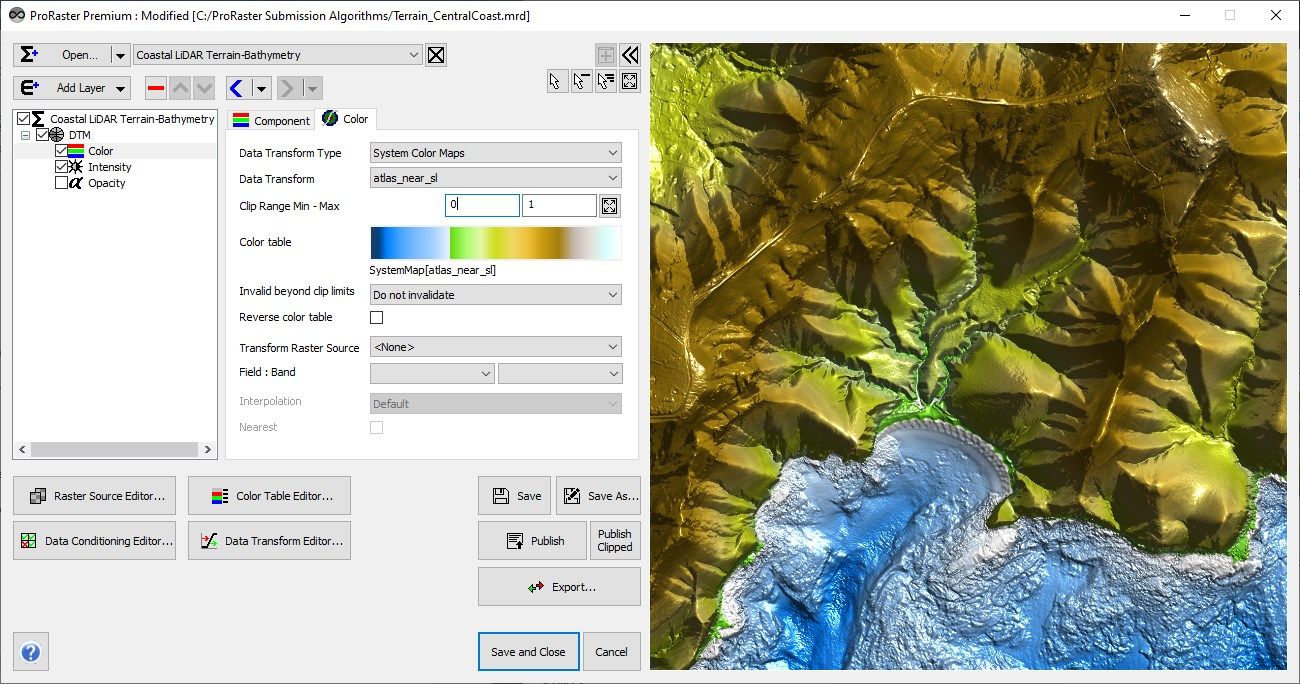
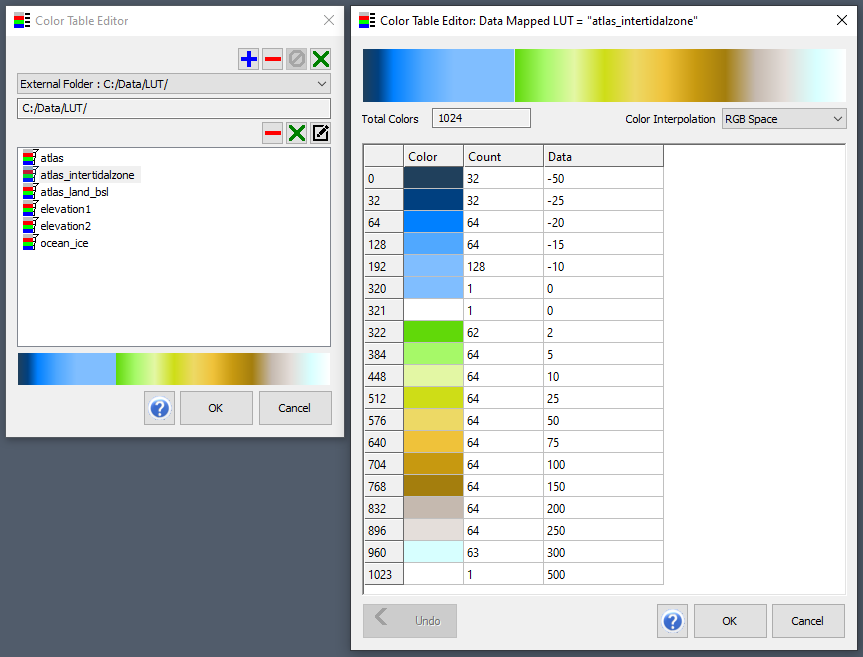
• The Color Table Editor is used to link to color tables and to create and edit new color tables.
-
• Create and edit color tables, color table maps, and color table legends.
-
• The Data Conditioning Filter Editor is used to create and edit data conditioning filters.
-
• Apply data conditioning filters to clean data and to remove values or colors, and to remove ranges of values or colors.
-
• The Data Transform Editor is used to create and edit advanced transforms between data and color.
-
• See raster summary statistics and histogram distribution data in graph or table form.