
SCADAvis.io Synoptic Editor
App details
About SCADAvis.io Synoptic Editor
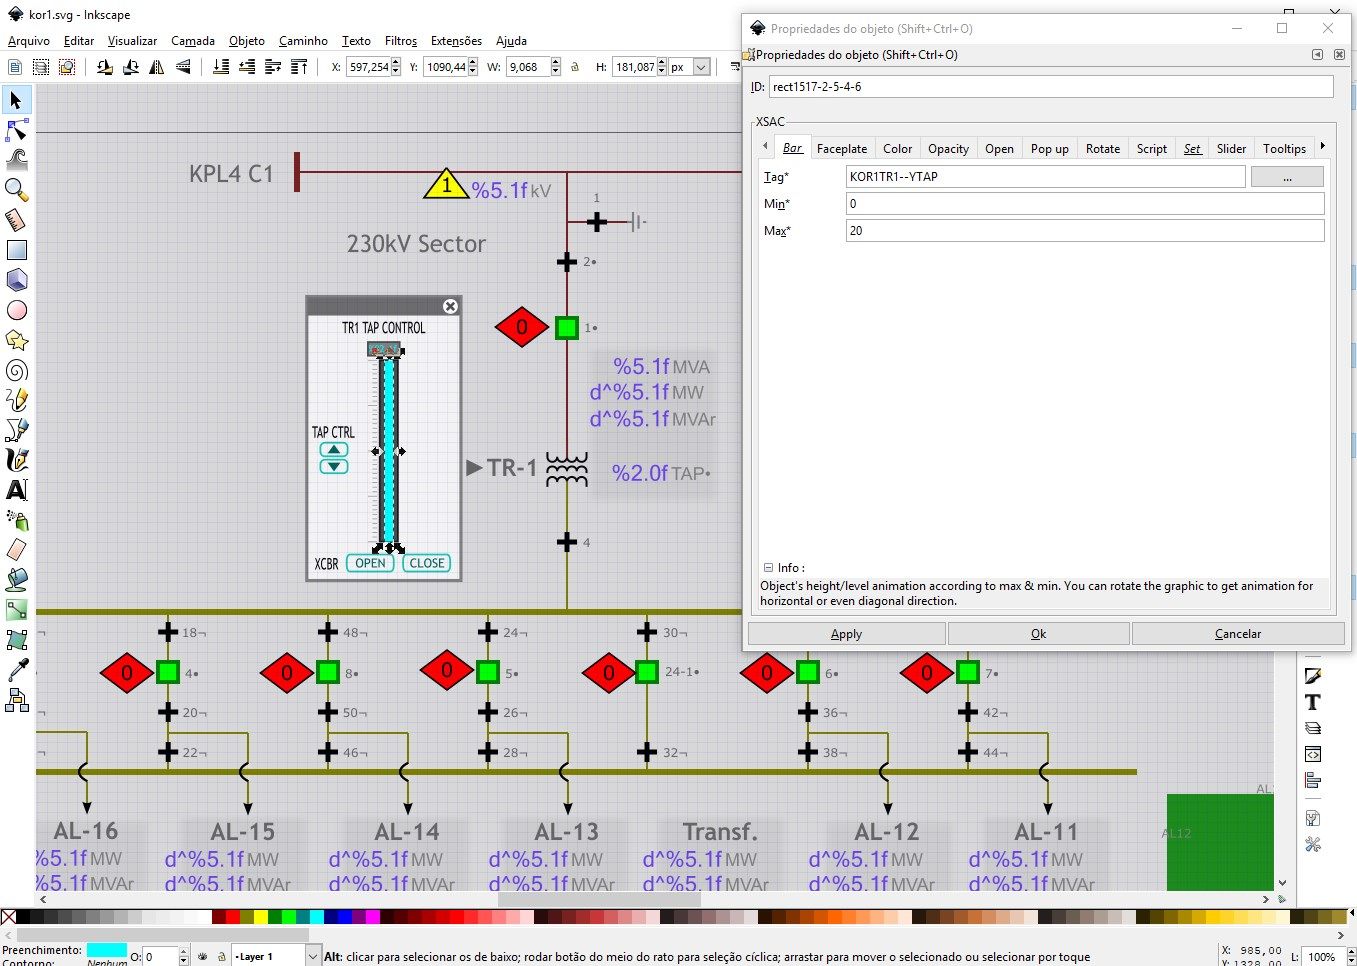
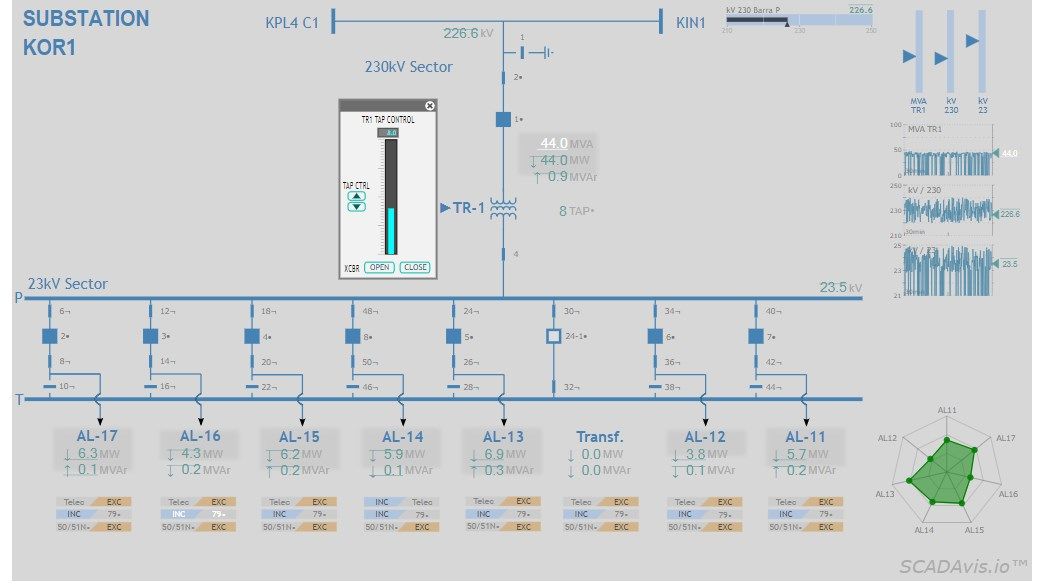
SCADAvis.io Synoptic Editor is a powerful tool to create synoptic graphics that can be animated with real-time data on any modern web browser (mobile or desktop).
This editor is based on the popular open-source Inkscape editor, it was modified to allow markup SCADA-like animations in the SVG file with links to data that can be later provided at runtime.
Any graphics properties can be animated with live data, such as fill/stroke colors, size, position, rotation, etc. Smooth animations can be created.
The graphics can be interactive and are capable of starting actions in web apps using the Synoptic API.
The powerful Vega charts engine can be directly used in the graphics to create and customize almost any type of BI-like charts.
The SCADAvis.io service provides the runtime embeddable component and API to bind graphics and real-time data. SCADAvis.io service plans are sold separately starting at free.
The workflow provided by this solution clearly separates graphics creation from the real-time data binding, this allows for designers to create graphics with no programming skills, while programmers embed the graphics and bind enterprise data using our API. No data and no graphics are ever sent to our servers or anywhere, they remain under the strict control of the web app publisher.
This editor is also compatible with and can be also used to create graphics for the following systems:
OSHMI Open Substation HMI
xPlainCloud.com
Key features
-
100% HTML5 solution, mobile friendly.
-
There are plenty of freely available resources on the web for Inkscape, such as tutorials, clipart, courses, videos, books, etc.
-
SVG resolution independent graphics. Can import graphics in a great variety of formats.
-
Great for Utilities, IoT, Home/Building Automation, Industries, Simulation, Presentation, Live Infographics, etc.
-
Translated to many languages.