
Veta Desktop
App details
About Veta Desktop
Veta is a map-based tool for viewing and analyzing geospatial data.
Veta can import data from various intelligent compaction (IC) machines, paver-mounted thermal profilers (PMTP), and dielectric profile systems (DPS) to perform viewing, filtering, sublotting, spot test imports, and analysis.
Veta is currently funded by the Transportation Pooled Fund TPF-5(466), “National Road Research Alliance - NRRA (Phase-II)”.
Some of the new features for Veta 8.0 are listed below. For a complete listing of all changes, see the Release Notes included with the software or on our site.
Data
• Added support for BOMAG ECONOMIZER, MDP (Caterpillar ICMV), and Völkel CMV.
• Added support for multiple ICMV types in the same project, when possible.
Spot Tests
• Added a spot test type manager to the Options.
Analysis
• A Filter Review section has been added to the Analysis. This feature will list filter settings that differ from the defaults. Location filter values can also be compared to a user-supplied list to ensure the settings are the same.
• Price adjustments and colors were added as options to the PMTP temperature DRS and TSI.
• A coverage specification was added for PMTP temperature.
• Results categorized by lift and data lot are now available for DRS and TSI when filter groups are present in the respective folders. Results categorized by sublot are also available for this data.
• IC sublot compaction curves now contain the mean PMTP temperature for that sublot when available.
Miscellaneous
• The map search now offers a choice between filtered and unfiltered data.
• The map search will show results for all machine types.
• The map search displays a heat-loss curve.
• Location filters and exclusion location filters can now be shown on most maps.
Key features
-
Download data directly from the Cloud.
-
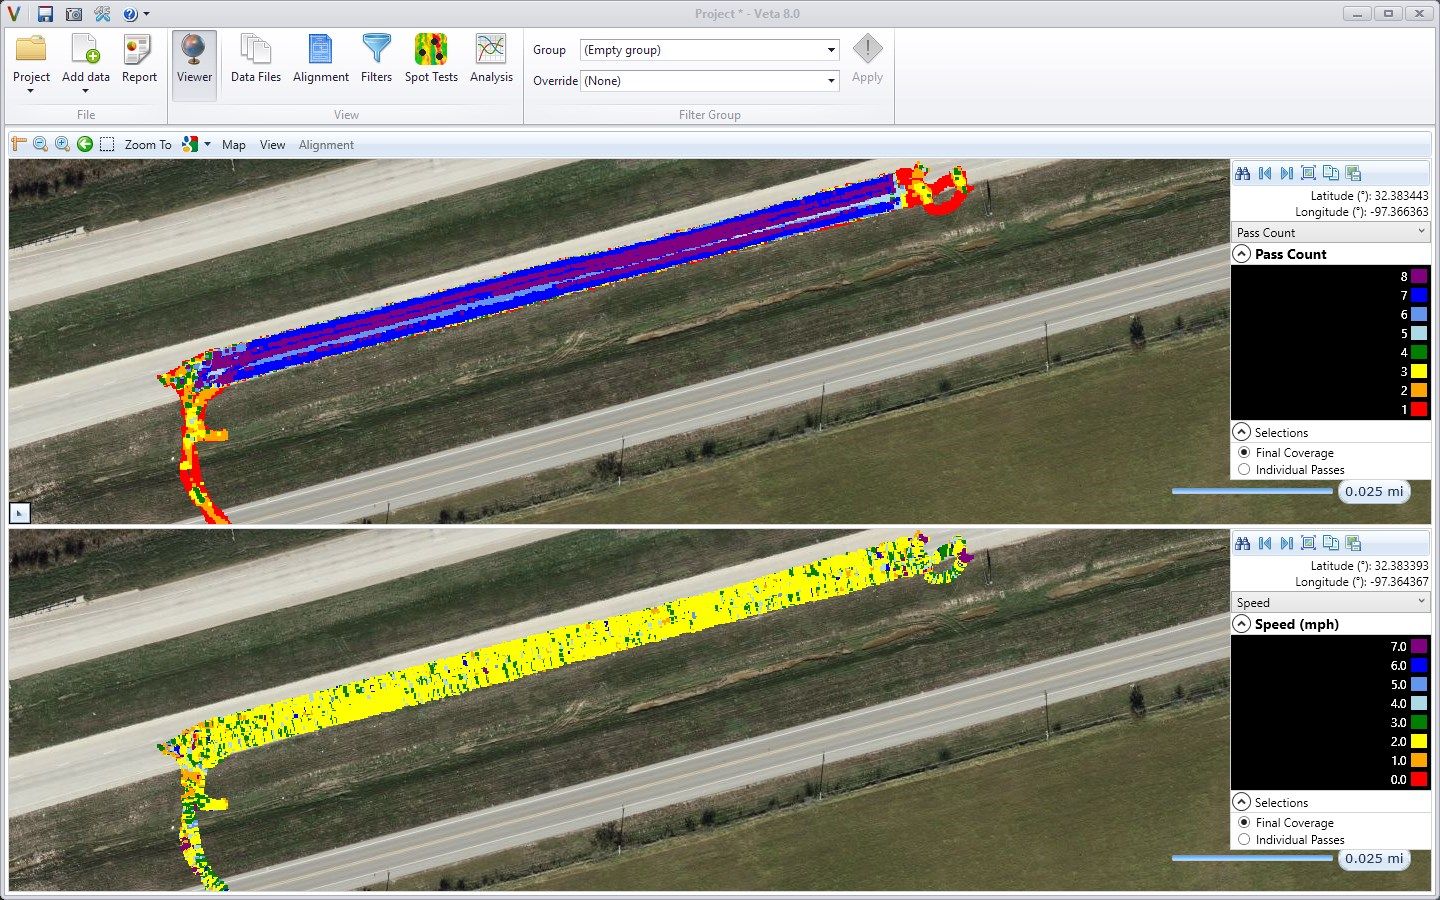
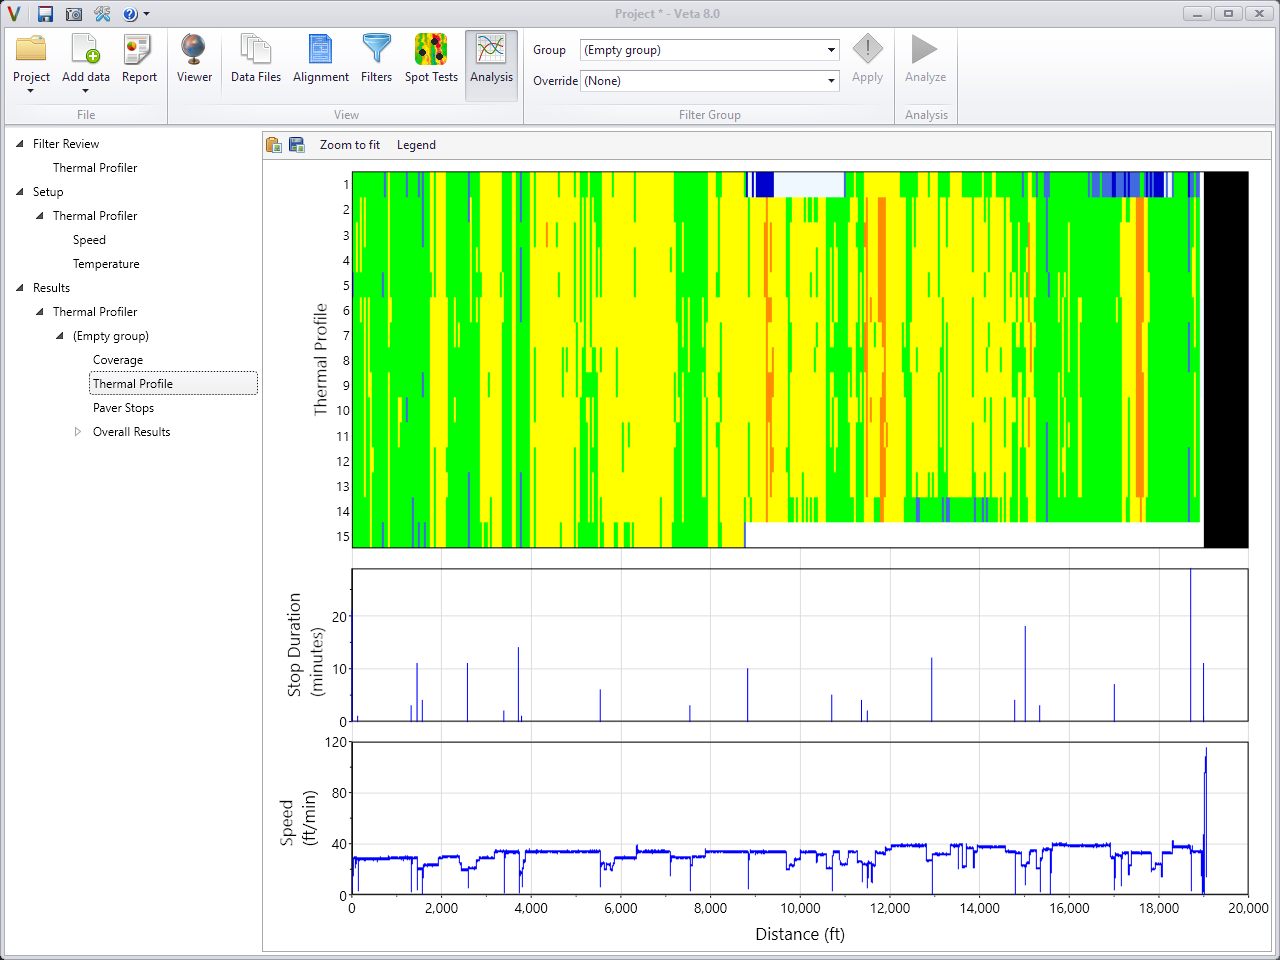
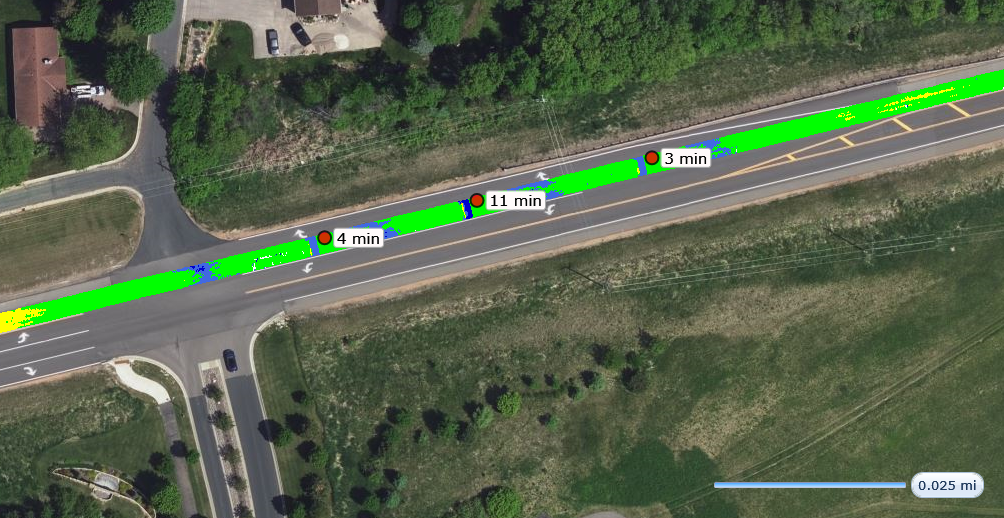
View IC, PMTP, and DPS data in the same project as color-coded maps on top of geographical street or aerial maps and easily zoom, pan, and scroll.
-
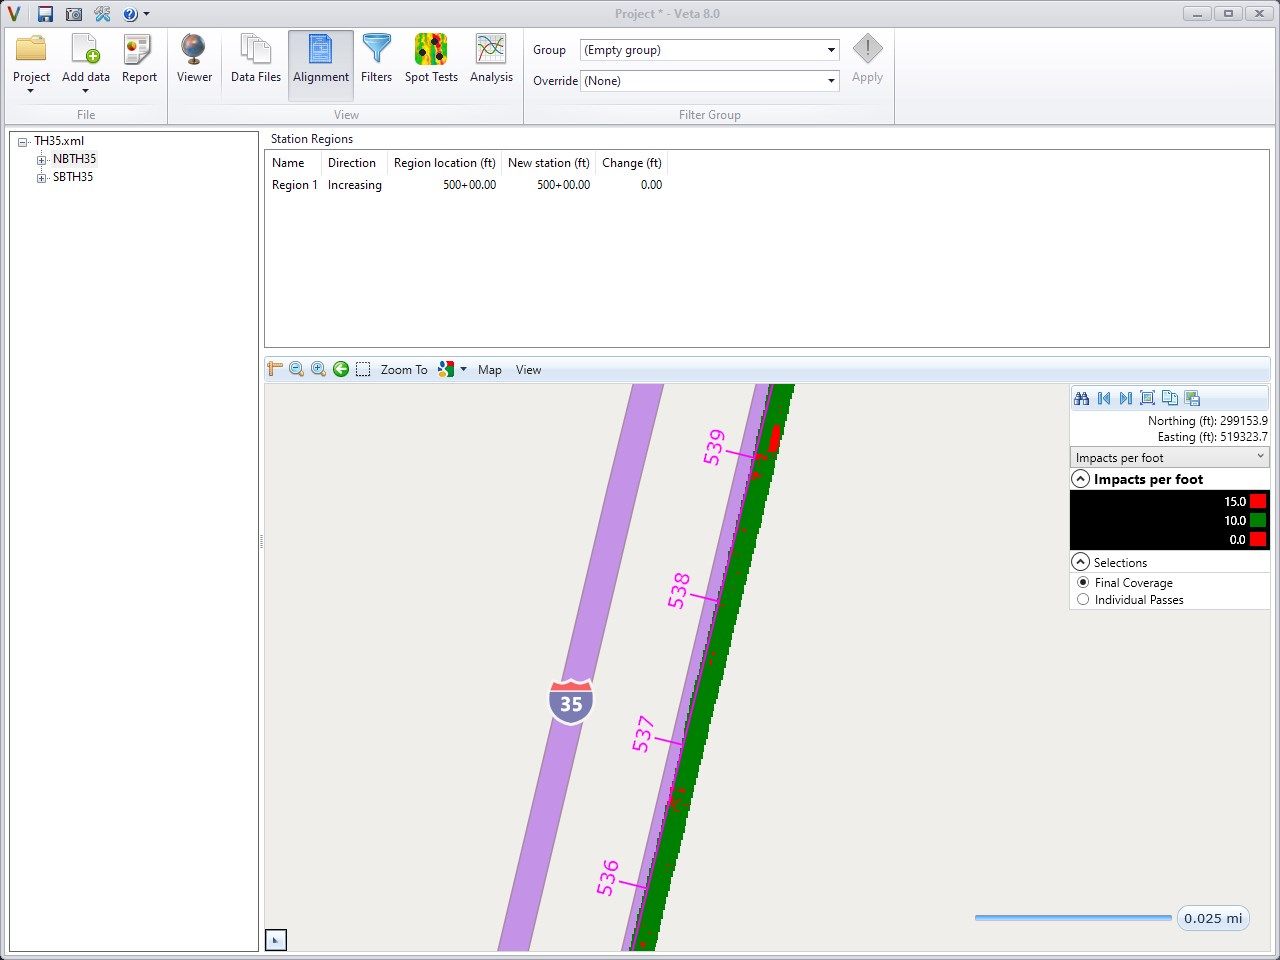
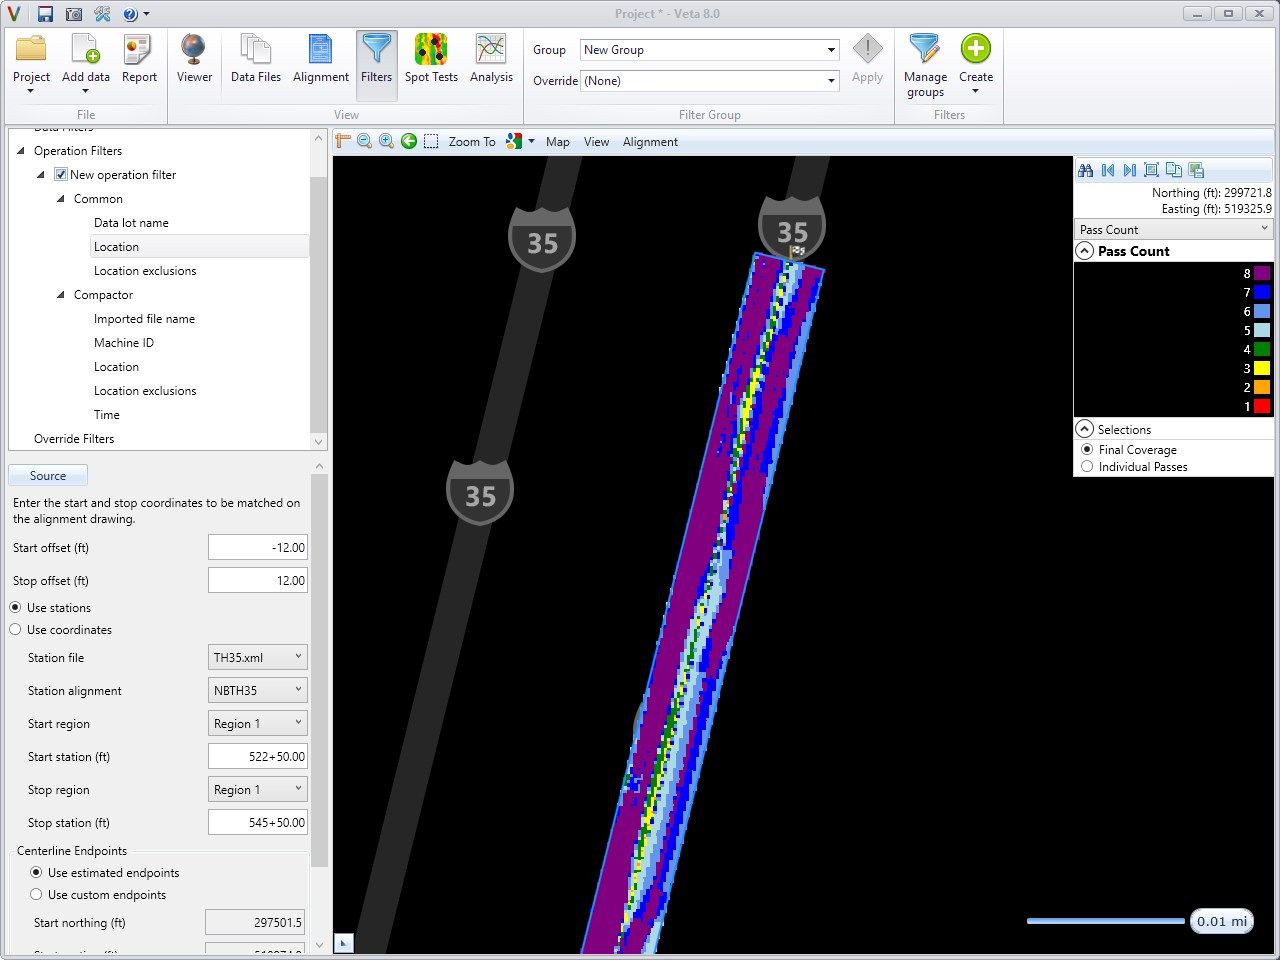
Import alignment files to aid data filtering and data interpretation.
-
Powerful filter groups to extract data in many different ways.
-
Split the project into sublots for detailed analysis.
-
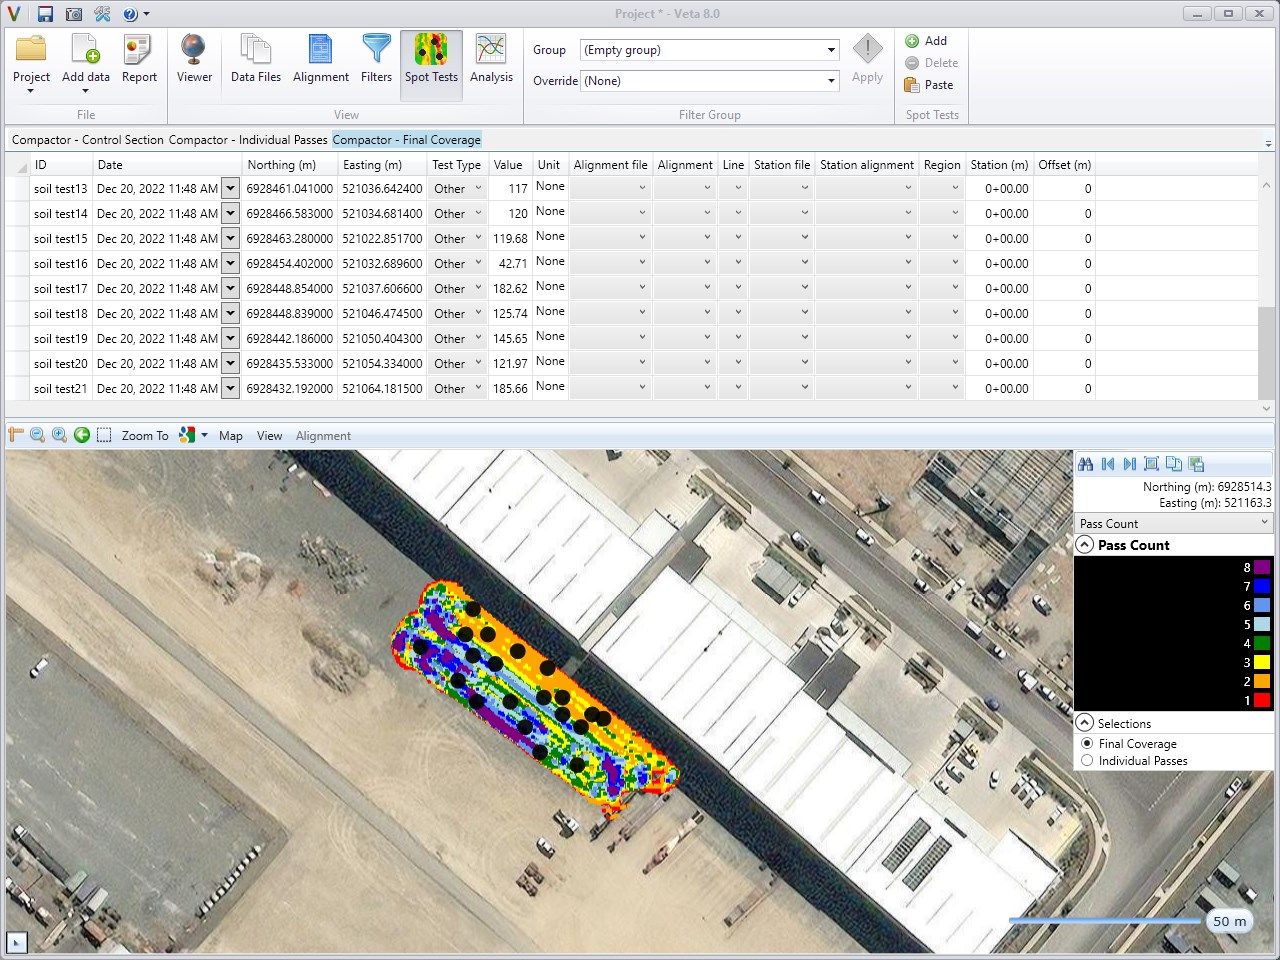
Add in-situ spot test data for correlation analysis against IC data to establish target values.
-
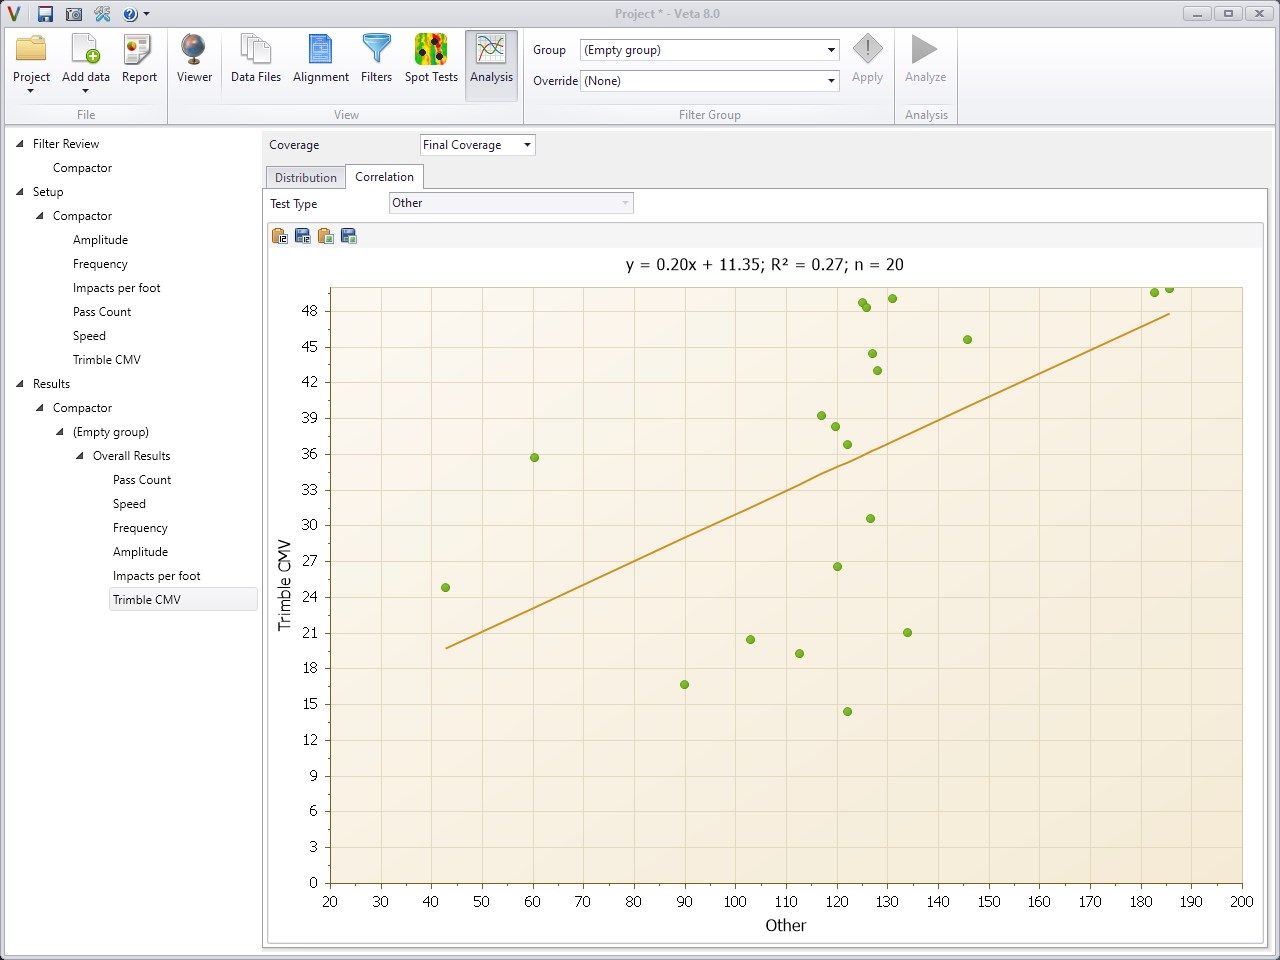
Analyze statistics, histograms, coverage analysis, sublot reports, semi-variogram (uniformity metrics), temperature segregation, compaction curves, correlation analyses, and spec compliance.
-
Generate analysis reports in various ways including in secured PDF.